

Abstract
Human glucose-6-phosphate dehydrogenase (G6PD) is a crucial enzyme in the pentose phosphate pathway, and serves an important role in biosynthesis and the redox balance. G6PD deficiency is a major cause of neonatal jaundice and acute hemolyticanemia, and recently, G6PD has been associated with diseases including inflammation and cancer. The aim of the present study was to conduct a search of the National Center for Biotechnology Information PubMed library for articles discussing G6PD. Genes that were identified to be associated with G6PD were recorded, and the frequency at which each gene appeared was calculated. Gene ontology (GO), pathway and network analyses were then performed. A total of 98 G6PD-associated genes and 33 microRNAs (miRNAs) that potentially regulate G6PD were identified. The 98 G6PD-associated genes were then sub-classified into three functional groups by GO analysis, followed by analysis of function, pathway, network, and disease association. Out of the 47 signaling pathways identified, seven were significantly correlated with G6PD-associated genes. At least two out of four independent programs identified the 33 miRNAs that were predicted to target G6PD. miR-1207-5P, miR-1 and miR-125a-5p were predicted by all four software programs to target G6PD. The results of the present study revealed that dysregulation of G6PD was associated with cancer, autoimmune diseases, and oxidative stress-induced disorders. These results revealed the potential roles of G6PD-regulated signaling and metabolic pathways in the etiology of these diseases.
Keywords: glucose-6-phosphate dehydrogenase, microRNAs, systematic analysis
Introduction
Glucose-6-phosphate dehydrogenase (G6PD) is a critical enzyme in the pentose phosphate pathway (PPP). G6PD serves an important role in nucleic acid synthesis via generation of ribose 5-phosphate, and in the cellular response to oxidative stress through the generation of reduced nicotinamide adenine-dinucleotide phosphate (NADPH) (1,2). G6PD deficiency was the first prevalent enzyme deficiency characterized by the World Health Organization in 1984 (3). It is an X-linked, hereditary genetic defect involving mutations in the G6PD gene, which lead to specific amino acid substitutions that alter enzymatic function (4). Globally, >400 million people suffer from G6PD deficiency (5). The most frequent clinical manifestations of G6PD deficiency are neonatal jaundice and acute hemolytic anemia, which are initiated by exogenous oxidative agents, including drugs, infection or ingestion of fava beans (4,6).
As G6PD activity is essential for preventing reactive oxygen species (ROS)/serum starvation-mediated cell death, dysregulation of G6PD activity may lead to the development of disease (7). G6PD deficiency predisposes human foreskin fibroblasts to retarded growth and accelerated cellular senescence (8). Knocking out G6PD is embryonically lethal, and leads to cellular sensitivity to H2O2 and additional oxidative agents (9,10). By contrast, overexpression of G6PD in NIH 3T3 cells leads to anchorage-independent growth (11). Decreased G6PD activity may predispose humans to type 1 and type 2 diabetes (12,13). In addition, G6PD has been associated with hypertension (14).
Increased G6PD activity has been reported in various neoplasms, including hepatocellular cancer, leukemia, colorectal cancer, breast tumors, renal cell carcinomas, and gastrointestinal cancers (15–20). A previous study demonstrated that silencing of G6PD in human A375 malignant melanoma cells downregulated cyclin D1, cyclin E, p53, S100 calcium-binding protein A4 and the apoptosis factor Fas, and upregulated the apoptosis-inhibiting factors B-cell lymphoma (Bcl) 2 and Bcl-extra large (21). G6PD regulates apoptosis and the proliferation of A375 cells, potentially via the signal transducer and activator of transcription (STAT) 3/5 signaling pathway (22).
MicroRNAs (miRNAs) are a class of single-stranded molecules, 20 to 22 nucleotides in length, which constitute approximately 0.01% of total RNA. By binding to specific sites within the 3′-untranslated region, miRNAs inhibit the translation of multiple mRNA targets (22). miRNAs have been reported to serve critical roles in embryonic development, cell proliferation, the cell cycle, apoptosis, neovascularization, inflammation, tumorigenesis and various additional diseases (23–33). Therefore, determining whether any miRNAs regulate G6PD may provide an insight into G6PD-associated biological processes and diseases.
miRNAs function to promote, as well as suppress tumor development. For instance, overexpression of the oncogenic miRNA-155 in transgenic mice leads to B cell proliferation, which develops into B cell leukemia and aggressive lymphoma (23). By contrast, tumor suppressive miRNAs prevent tumors from developing by negatively regulating oncogenes and/or genes controlling proliferation or apoptosis. The expression of let-7, which was one of the first miRNAs discovered, is downregulated in lung cancer (34). Overexpression of let-7 is capable of inhibiting cancer cell growth in vitro and in vivo, while downregulation of let-7 impairs the survival of various types of tumor (25,26,35). In addition, the expression levels of several miRNAs have been reported to correlate with tumor metastasis. For instance, the expression level miRNA-422a is negatively correlated with metastasis of hepatocellular carcinoma (HCC), and miRNA-422a is significantly downregulated in HCC (33). Overexpression of miR-422a in HCC tumor cells significantly inhibits tumor growth and liver metastasis in xenograft tumor models (33).
In addition to cancer, miRNAs are involved in various additional biological processes and diseases. An miRNA cluster at chromosome 14q32 participates in neovascularization, and inhibition of 14q32 miRNAs, including miR-329, miR-487b, miR-494 and miR-495 promotes neovascularization and recovery of blood flow following ischemia (30,33). In addition, a number of miRNAs influence energy metabolism. By repressing cardiac peroxisome proliferator-activated receptor-Δ, miR-199a facilitates a metabolic shift from a predominant reliance on fatty acid utilization toward an increased reliance on glucose metabolism, which leads to lethal heart failure (36). Inhibition of miRNA binding improved cardiac function and restored mitochondrial fatty acid oxidation in animal models, thus highlighting a novel potential therapy for heart failure (36).
To the best of the author's knowledge no systematic studies investigating the correlation between G6PD, G6PD-associated genes, and miRNAs regulating G6PD have been conducted to date. Therefore, 2,253 articles retrieved from the National Center for Biotechnology Information (NCBI) PubMed library were used to investigate the networks of G6PD-associated genes in the present study. A total of 98 genes and 7 signaling pathways were demonstrated to be significantly correlated with G6PD. In addition, 33 miRNAs that may modulate the expression or activity of G6PD were identified.
Materials and methods
Data selection, extraction and filtering for the natural language processing (NLP) analysis of human G6PD
The PubMed library was first searched for articles regarding G6PD deficiency that were published between January 1980 and June 2014, using the following keywords: ‘Glucosephosphate Dehydrogenase Deficiency’[Mesh] AND ‘1980/01/01’[Date-Publication]: ‘2014/06/01’[Date-Publication]. All abstracts were downloaded as. HTML text without images and converted into. XML documents. The genes and proteins reported were compiled into a data pool, and gene mention recognition was performed using A Biomedical Named Entity Recognizer version 1.5 tool (http://pages.cs.wisc.edu/~bsettles/abner/) (37), and conjunction resolution was conducted to obtain specialized descriptions of the extracted genes. For instance, ‘CASP 3/7 gene’ was divided into the CASP 3 genes and CASP 7 genes. In order to normalize the variety of gene aliases identified, all genes were unified according to the Entrez gene official symbols (http://www.ncbi.nlm.nih.gov/gene) (38–42). The process of NLP is illustrated in Fig. 1.
Figure 1.
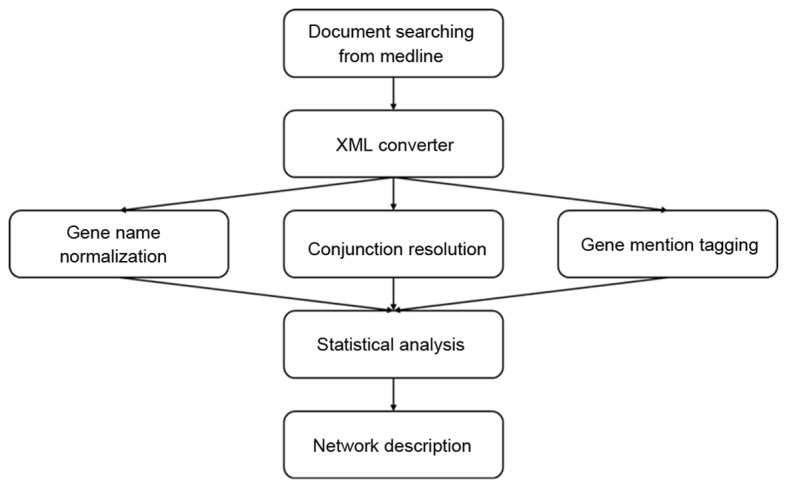
A flow chart of the natural language processing strategy employed in the present study. A total of 2,253 articles were obtained by querying the National Center for Biotechnology Information PubMed library with: ‘Glucosephosphate Dehydrogenase Deficiency’[Mesh] AND ‘1980/01/01’[Date-Publication]: ‘2014/06/01’[Date-Publication]. All the abstracts were downloaded as HTML text and converted into XML documents. Following ABNER tagging, all of the genes that were mentioned were normalized according to the Entrez database. ABNER, a biomedical named entity recognizer.
Statistical analysis of selected data
For all publications retrieved from the PubMed database (N) the number of genes mentioned in the PubMed database for G6PD (m) and associated genes (n) were recorded. The frequency at which each gene appeared was calculated. The rate at which each gene was mentioned was assumed to be associated with the likelihood that it was correlated with G6PD, and the number of articles in which a given gene was associated with G6PD (k) was recorded. By employing the hypergeometric distribution, the probability of a frequency greater than k under completely random conditions was calculated using the following formula:
where,
The G6PD-gene associations where the p-value was equal to <0.05, were subsequently summarized and subjected to a linked database (http://www.r-project.org/; http://www.bioconductor.org/packages/2.4/bioc/html/KEGGSOAP.html; http://www.genmapp.org/; http://mips.helmholtz-muenchen.de/proj/ppi) for further analysis.
Gene ontology (GO) analysis
Enrichment of gene sets was analyzed using the GOstats software package (http://www.bioconductor.org/packages/release/bioc/html/GO stats.html) (39). GO analysis was implemented through the GSEABase package version 1.4.0 from The R Project for Statistical Computing (http://www.r-project.org/) (43). Genes were classified according to biological process, cellular component and molecular function.
Pathway and gene network analysis
The G6PD-associated genes were mapped to the Kyoto Encyclopedia of Genes and Genomes pathway database (KEGG; http://www.kegg.jp/) using the GenMAPP version C3 (http://www.genmapp.org/), and the enrichment p-value was calculated for each pathway (44,45). Based on the protein interactions, regulated genes and protein modifications listed in the KEGG database, the G6PD-associated genes were integrated into the following three different interaction associations: Enzyme-enzyme interactions, representing two enzymes catalyzing successive reaction steps; protein-protein interactions, representing binding and modification; transcription factor-target gene product interactions, representing gene expression interactions. In addition, the KEGG database was used to investigate the differentially expressed genes associated with metabolism and disease signaling pathways. Briefly, the results of the signaling pathway analysis was downloaded from the KEGG database, and the interactions between genes were analyzed using the KEGGSOAP package version 2.4 (http://www.bioconductor.org/packages/2.4/bioc/html/KEGGSOAP.html) derived from The R Project for Statistical Computing (http://www.r-project.org/) (46,47). Protein-protein interaction data was downloaded from the MIPS Mammalian Protein-Protein Interaction Database (http://mips.helmholtz-muenchen.de/proj/ppi/) (48). The frequency of the co-citation of each gene was calculated employing co-citation matrices to identify a specific gene term and its variants included within an abstract. Statistical analysis was performed using the same methods described for the NLP analysis of G6PD, and the subsequent network was visualized using the open-source Medusa software program version 3.0 (https://sites.google.com/site/medusa3visualization) (49). Genes were classified according to associated signaling pathways. Genes involved in various signaling pathways were assigned to the single pathway with the smallest enrichment P-value. Following integration of the PubMed articles, the collection of protein-protein interaction and conjunction resolution information, and additional results from the Search Tool for the Retrieval of Interacting Genes/Proteins tool version 2.0 (http://string-db.org/) (50), a network of G6PD-associated genes was established.
Prediction of miRNAs targeting G6PD
The miRNAs targeting G6PD were identified using four independent software programs: TargetScan 6.2 (http://www.targetscan.org/) (51); miRanda (version 5.0; http://www.ebi.ac.uk/enright-srv/microcosm/htdocs/targets/v5/); starBase (version, 2.0; http://starbase.sysu.edu.cn/browseIntersectTargetSite.php) (52) and PicTar (http://pictar.mdc-berlin.de/cgi-bin/PicTar_vertebrate.cgi?species=vertebrate).
Results
Natural language processing analysis of G6PD
A search of the PubMed library for articles discussing G6PD deficiency that were published between January 1980 and June 2014, identified 2,253 primary G6PD-associated studies (Fig. 1). Each gene mentioned in these articles was recorded, and the top five most cited genes were glutathione-disulfide reductase (GSR), insulin (INS), catalase (CAT), superoxide dismutase (SOD1) and adenosine deaminase (ADA; Table I). Each gene mentioned in these articles was categorized using GO analysis (Table II), and 98 G6PD-associated genes were identified and categorized according to cellular component, molecular function and biological process. The most highly represented categories of cellular components were ‘other cellular component’ (25%), ‘other membranes’ (20%) and the plasma membrane (12%; Fig. 2A). The most highly represented categories of molecular function were ‘other molecular function’ (52%), ‘signal transduction’ (17%) and ‘kinase activity (8%; Fig. 2B). The most highly represented categories of biological processes were ‘other metabolic processes’ (18%), ‘other biological processes’ (14%) and developmental processes (13%; Fig. 2C).
Table I.
Top ten significant glucose-6-phosphate dehydrogenase-associated genes.
| Entrez gene ID | Official gene symbol | Gene definition | PubMed count | P-value |
|---|---|---|---|---|
| 2936 | GSR | Glutathione reductase | 44 | <1.00×10⁻³ |
| 3630 | INS | Insulin | 40 | <1.00×10⁻³ |
| 847 | CAT | Catalase | 38 | 4.80×10⁻⁹ |
| 2908 | NR3C1 | Nuclear receptor subfamily 3, group C, member 1 (glucocorticoid receptor) | 23 | <1.00×10⁻³ |
| 6647 | SOD1 | Superoxide dismutase 1, soluble | 17 | <1.00×10⁻³ |
| 3251 | HPRT1 | Hypoxanthine phosphoribosyltransferase 1 | 7 | <1.00×10⁻³ |
| 2157 | F8 | Coagulation factor VIII, procoagulant component | 6 | 3.96×10⁻⁵ |
| 100 | ADA | Adenosine deaminase | 3 | 1.21×10⁻³ |
| 10327 | AKR1A1 | Aldo-keto reductase family 1, member A1 (aldehyde reductase) | 3 | 1.75×10⁻⁵ |
| 3439 | IFNA1 | Interferon, α 1 | 3 | 2.15×10⁻³ |
Table II.
Gene ontology analysis of significant genes obtained from the natural language processing analysis.
| A, Cellular component | |||
|---|---|---|---|
| Term | Genes | Count | P-value |
| Mitochondrion | CAT, NOS1, HK1, MPO, BCL2, SOD1, GCK, CYB5R3, ATP5A1, GSR | 10 | 1.50×10⁻² |
| Endoplasmic reticulum/Golgi | NOX4, UGT1A1, SGK1, BCL2, PRKG1, PTGS2, HSPA5, EPHX1, ATP7B, POR, CYB5R3, NOS3 | 12 | 1.42×10⁻² |
| Additional cytoplasmic organelles | CAT, TNF, MPO, GLA, ATP6AP1, XDH | 6 | 2.13×10⁻² |
| Cytosol | CCND1, NR3C1, HK1, BCL2, HSP90AA1, NADK, MDH1 | 7 | 1.32×10⁻³a |
| Plasma membrane | EGF, L1CAM, SLC6A8, NOX4, VASP, NOS1, ATF4, TNF, UGT1A1, INSR, FPR1, BCL2, EGFR | 21 | 1.00×10⁻² |
| Non-structural extracellular | FST, EGF, IL1B, CSF3, F8, TNF, PTH, IFNA1, LPL, LTF, IL6, SOD1 | 17 | 8.03×10⁻⁴a |
| Additional cellular components | CCND1, L1CAM, IL1B, AR, NR3C1, SORD, VASP, NOS1, ATF4, TNF, NASP, ESR1 | 43 | 7.67×10⁻³a |
| B, Molecular function | |||
| Term | Genes | Count | P-value |
| Transcription regulatory activity | AR, NR3C1, ATF4, ESR1, CREM, BCL2, STAT3, PGR, CREB1, SMARCA5, CDKN2A | 11 | 2.15×10⁻² |
| Kinase activity | CCND1, INSR, HK1, PGK1, SGK1, PDGFRB, EGFR, PRKG1, GCK, NADK, CDKN2A, IKBKG | 12 | 9.20×10⁻⁴a |
| Additional molecular functions | TKT, CCND1, FST, EGF, L1CAM, SLC6A8, AR, CAT, GSS, NR3C1, SORD, NOX4 | 75 | 2.08×10⁻³a |
| C, Biological process | |||
| Term | Genes | Count | P-value |
| Cell cycle and proliferation | CCND1, FST, EGF, IL1B, AR, CAT, NOX4, TNF, NASP, ESR1, PTEN, ADA | 23 | 4.13×10⁻⁸a |
| Transport | IL1B, SLC6A8, NOS1, TNF, NASP, SGK1, ADA, BCL2, SLC2A1, CREB1, NOX1, LTF | 22 | 1.75×10⁻² |
| Stress response | CCND1, IL1B, CAT, F8, TNF, MPO, IFNA1, SGK1, ADA, BCL2, STAT3, HSPB1 | 19 | 3.75×10⁻⁶ |
| Developmental processes | CCND1, FST, EGF, L1CAM, IL1B, AR, NR3C1, NOX4, CSF3, VASP, TNF, INSR | 41 | 1.21×10⁻⁸a |
| Additional metabolic processes | TKT, IL1B, AR, CAT, GSS, NR3C1, SORD, NOX4, NOS1, ATF4, TNF, UGT1A1 | 54 | 3.37×10⁻¹²a |
| Cell-to-cell signaling | IL1B, TF, AR, CREB1, IL6, GCK | 6 | 7.59×10⁻³a |
| Signal transduction | CCND1, FST, EGF, L1CAM, IL1B, AR, CAT, NR3C1, TNF, INSR, PTEN, PLCG1 | 29 | 8.84×10⁻³a |
| Death | NR3C1, TNF, PTEN, SGK1, ADA, BCL2, HPRT1, IL6, SOD1, IL2, IL10, ALDH1A1 | 14 | 7.66×10⁻⁵a |
| Additional biological processes | TKT, CCND1, FST, L1CAM, IL1B, TF, AR, GSS, NR3C1, NOX4, CSF3, NOS1 | 43 | 3.94×10⁻²a |
P<0.01.
Figure 2.
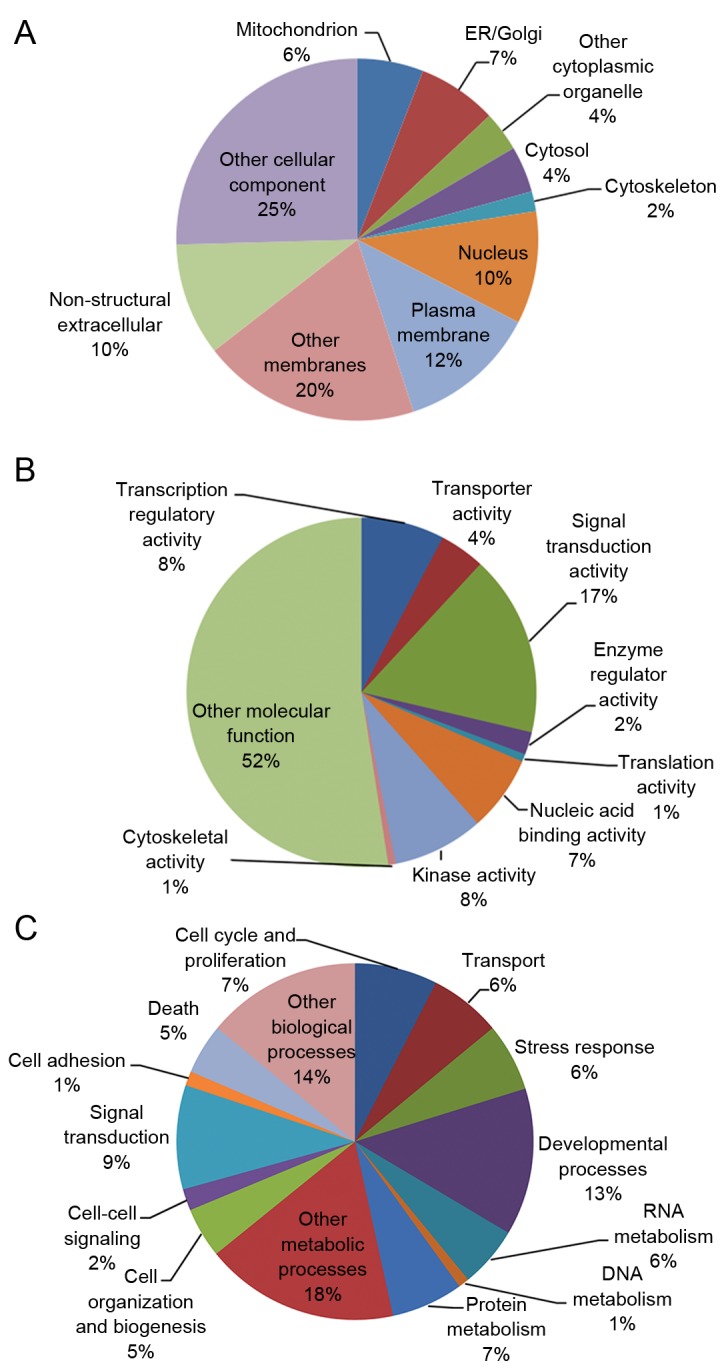
Gene ontology analysis of G6PD-associated genes. Each pie chart represents the (A) cellular components (B) molecular functions and (C) biological processes of G6PD-associated genes. G6PD, glucose-6-phosphate dehydrogenase; ER, endoplasmic reticulum.
A gene network was constructed to identify a correlation between these 98 G6PD-associated genes, and the stability of gene regulatory networks (Fig. 3A). The most highly connected hub genes critically contribute to the stability of the network. The most highly connected gene identified in the present study was INS, which encodes insulin that regulates glucose absorption (Fig. 3B).
Figure 3.

Network of G6PD-associated genes. (A) A schematic of the G6PD-associated gene network. The purple line indicates an experimentally confirmed connection, whereas the blue lines indicate a connection retrieved from the databases, and the yellow lines represent connections derived from literature mining. (B) Quantification of the connectivity of G6PD-associated genes. G6PD, glucose-6-phosphate dehydrogenase; INS, insulin.
The signaling pathways that correlated with each G6PD-associated gene were retrieved from the KEGG database, which implicated 47 pathways involved G6PD expression and activity. Out of these 7 were significantly associated with G6PD (P<0.01; Table III). G6PD-associated genes were most significantly correlated with the cytokine-cytokine receptor interaction pathway. In addition, G6PD-associated genes were involved in regulating the mitogen-activated protein kinase (MAPK) signaling pathway, as well as the focal adhesion, Janus kinase (Jak)-signal transducer and activator of transcription (STAT), p53, long-term depression and apoptosis signaling pathways (Table III).
Table III.
Signaling pathways significantly represented by glucose-6-phosphate dehydrogenase-associated genes.
| Pathway ID | Pathway name | Genes | Count | Enrichment P-value |
|---|---|---|---|---|
| 4060 | Cytokine-cytokine receptor interaction | EGF, IL1B, CSF3, TNF, IFNA1, PDGFRB, EGFR, IL6, IL2, IL10 | 10 | 5.28×10⁻³a |
| 4010 | MAPK signaling pathway | EGF, IL1B, ATF4, TP53, TNF, PDGFRB, EGFR, HSPB1, DUSP1, IKBKG | 10 | 6.51×10⁻³a |
| 4510 | Focal adhesion | CCND1, EGF, VASP, PTEN, PDGFRB, BCL2, EGFR, PPP1R12A, IGF1 | 9 | 2.75×10⁻³a |
| 4630 | Jak-STAT signaling pathway | CCND1, CSF3, IFNA1, STAT3, IL6, IL2, IL10 | 7 | 8.11×10⁻³a |
| 4910 | Insulin signaling pathway | INSR, HK1, INS, FBP2, GCK, FASN | 6 | 1.67×10⁻² |
| 4020 | Calcium signaling pathway | NOS1, PLCG1, PDGFRB, EGFR, NOS3, GNAS | 6 | 4.95×10⁻² |
| 4115 | p53 signaling pathway | CCND1, TP53, PTEN, IGF1, CDKN2A | 5 | 3.30×10⁻³a |
| 4730 | Long-term depression | NOS1, PRKG1, NOS3, IGF1, GNAS | 5 | 3.98×10⁻³a |
| 4210 | Apoptosis | IL1B, TP53, TNF, BCL2, IKBKG | 5 | 9.85×10⁻³a |
| 4540 | Gap junction | EGF, PDGFRB, EGFR, PRKG1, GNAS | 5 | 1.13×10⁻³ |
| 4620 | Toll-like receptor signaling pathway | IL1B, TNF, IFNA1, IL6, IKBKG | 5 | 1.72×10⁻² |
| 4660 | T cell receptor signaling pathway | TNF, PLCG1, IL2, IL10, IKBKG | 5 | 2.23×10⁻² |
| 4920 | Adipocytokine signaling pathway | TNF, STAT3, SLC2A1, IKBKG | 4 | 1.75×10⁻² |
| 4370 | VEGF signaling pathway | PLCG1, HSPB1, PTGS2, NOS3 | 4 | 2.54×10⁻² |
| 4640 | Hematopoietic cell lineage | IL1B, CSF3, TNF, IL6 | 4 | 4.07×10⁻² |
| 4612 | Antigen processing and presentation | IFNA1, CREB1, HSPA5, HSP90AA1 | 4 | 4.22×10⁻² |
P<0.01.
In addition to the notable PPP, G6PD-associated genes were observed to be involved in the regulation of fructose and mannose, glycerolipid, nitrogen, galactose, starch, sucrose, amino and nucleotide sugars, glutathione and drug metabolic pathways (3 or 4 counts for each metabolic pathway; P<0.05; Table IV). Furthermore, G6PD-associated genes were significantly correlated with a number of cancers, autoimmune diseases and oxidative stress-associated disorders (>3 counts for each disease; P<0.05; Table V). These results suggest that the aberrant regulation of G6PD signaling and/or metabolic pathways may be associated with the pathogenesis of these diseases.
Table IV.
Metabolic pathways significantly represented by glucose-6-phosphate dehydrogenase-associated genes.
| Metabolic pathway | Genes | Count | Enrichment P-value |
|---|---|---|---|
| Pentose phosphate pathway | TKT, FBP2, GPI, PGD | 4 | 5.42×10⁻⁴a |
| Fructose and mannose metabolism | AKR1B1, SORD, HK1, FBP2 | 4 | 1.37×10⁻³a |
| Glycerolipid metabolism | AKR1B1, GLA, LPL, AKR1A1 | 4 | 4.72×10⁻³a |
| Starch and sucrose metabolism | UGT1A1, HK1, GCK, GPI | 4 | 7.32×10⁻³a |
| Nitrogen metabolism | CA1, CA2, CA3 | 3 | 5.22×10⁻³a |
| Galactose metabolism | AKR1B1, HK1, GLA | 3 | 5.87×10⁻³a |
| Glutathione metabolism | GSS, GSR, PGD | 3 | 3.83×10⁻² |
| Drug metabolism-other enzymes | UGT1A1, HPRT1, XDH | 3 | 4.03×10⁻² |
| Amino sugar and nucleotide sugar metabolism | HK1, GCK, CYB5R3 | 3 | 2.60×10⁻² |
P<0.01.
Table V.
Diseases significantly represented by glucose-6-phosphate dehydrogenase-associated genes.
| Disease | Genes | Count | Enrichment P-value |
|---|---|---|---|
| Prostate cancer | CCND1, EGF, AR, ATF4, TP53, PTEN, PDGFRB, BCL2, EGFR, INS, CREB1, HSP90AA1, IGF1, IKBKG | 14 | 2.81×10⁻¹¹a |
| Glioma | CCND1, EGF, TP53, PTEN, PLCG1, PDGFRB, EGFR, IGF1, CDKN2A | 9 | 3.79×10⁻⁷a |
| Melanoma | CCND1, EGF, TP53, PTEN, PDGFRB, EGFR, IGF1, CDKN2A | 8 | 8.66×10⁻⁶a |
| Small cell lung cancer | CCND1, NOS1, TP53, PTEN, BCL2, PTGS2, NOS3, IKBKG | 8 | 3.61×10⁻⁵a |
| Amyotrophic lateral sclerosis | CAT, NOS1, TP53, TNF, BCL2, SOD1, NOS3 | 7 | 1.46×10⁻⁵a |
| Pancreatic cancer | CCND1, EGF, TP53, EGFR, STAT3, CDKN2A, IKBKG | 7 | 8.63×10⁻⁵a |
| Non-small cell lung cancer | CCND1, EGF, TP53, PLCG1, EGFR, CDKN2A | 6 | 1.35×10⁻⁴a |
| Alzheimer's disease | IL1B, NOS1, TNF, LPL, NOS3, ATP5A1 | 6 | 3.72×10⁻² |
| Bladder cancer | CCND1, EGF, TP53, EGFR, CDKN2A | 5 | 3.65×10⁻⁴a |
| Type II diabetes mellitus | TNF, INSR, HK1, INS, GCK | 5 | 6.20×10⁻⁴a |
| Endometrial cancer | CCND1, EGF, TP53, PTEN, EGFR | 5 | 9.91×10⁻⁴a |
| Colorectal cancer | CCND1, TP53, PDGFRB, BCL2, EGFR | 5 | 8.13×10⁻³a |
| Type I diabetes mellitus | IL1B, TNF, INS, IL2 | 4 | 3.69×10⁻³a |
| Chronic myeloid leukemia | CCND1, TP53, CDKN2A, IKBKG | 4 | 2.54×10⁻² |
| Graft-vs.-host disease | IL1B, TNF, IL6, IL2 | 4 | 3.10×10⁻³a |
| Autoimmune thyroid disease | IFNA1, IL2, IL10 | 3 | 4.23×10⁻² |
P<0.01.
Analysis of miRNAs targeting G6PD. Four independent software programs were used to predict the miRNA-targets of G6PD. The searches yielded 33 miRNAs that were predicted by at least two software programs to target G6PD (Fig. 4). Out of these, three miRNAs, including miR-1207-5P, miR-1 and miR-125a-5p, were predicted to target G6PD by all four software programs, thus indicating that these miRNAs are most likely to be involved in the regulation of G6PD expression.
Figure 4.

Integrative analysis of miRNAs predicted to target G6PD. A total of 33 miRNAs were identified to potentially modulate the expression and/or activity of G6PD using four miRNA target prediction software programs. miRNA, microRNA; G6PD, glucose-6-phosphate dehydrogenase. *The lower expression quantity product by the same precursor of miRNA.
Discussion
A systematic analysis of G6PD-associated genes may provide useful information regarding the role of G6PD in healthy and pathological processes. In the present study, all genes reportedly associated with G6PD in published articles retrieved from the PubMed library were systematically analyzed. NLP and database searching strategies were employed to analyze the association between the identified genes and G6PD, as well as the signaling pathways that they may be involved in, and their potential connection to a number of clinical diseases.
A total of 98 G6PD-associated genes were identified, and out of the 47 implicated signaling pathways, seven were highly likely to be regulated by G6PD-associated genes. These results highlight the mechanisms by which G6PD dysregulation may contribute to cancer or autoimmune diseases. In addition, four separate databases were used to identify 33 miRNAs that were predicted to regulate G6PD. To the best of the author's knowledge, this is the first study to perform systematic analysis of miRNAs that may target G6PD.
Out of the 98 G6PD-associated genes that were identified, the five most frequently cited genes were GSR, INS, CAT, SOD1 and ADA. The products encoded by these genes are involved in maintaining homeostasis of NADPH. GSR utilizes NADPH, derived from the PPP (of which G6PD catalyzes the first committed step), for recycling oxidized glutathione disulfide to reduced glutathione (Fig. 5) (53,54). In addition, NADPH is required and consumed during fatty acid synthesis. Reduced consumption of NADPH has been observed when fatty acid synthesis is inhibited by AMP-activated protein kinase (AMPK) via inhibition of acetyl-coenzyme A carboxylase (55). The INS gene encodes insulin, which increases cell permeability to fatty acids and accelerates the pentose phosphate cycle for NADPH production in the liver (56,57). The CAT gene encodes catalase, a crucial scavenger of hydrogen peroxide in human erythrocytes, which is dependent on the availability of PPP-derived NADPH (58). NADPH is known to be tightly bound to mammalian catalase, and prevents inactivation of catalase by H2O2 (Fig. 5) (59). Significantly lower SOD and G6PD activities have been reported in cystic echinococcosis of the liver and Parkinson's disease (57,60). Reduced SOD activity in erythrocytes, potentially as a result of inactivation of SOD by diminished reductive equivalents, has been detected in 26 carriers of G6PD defects (Fig. 5) (61).
Figure 5.

A schematic indicating the enzymatic reactions that involve the most cited G6PD-associated genes. As the rate-limiting enzyme in the pentose phosphate pathway, G6PD catalyzes the production of R-5-P and NADPH. R-5-Pis converted to IMP, which leads to the production of AMP. This product is converted to IMP when adenosine deaminase is present. NADPH serves crucial roles in the reduction of GSSG to GSH by glutathione reductase, and protects catalase from inactivation by H2O2. HKs, hexokinases; G6PD, guocose-6-phosphate dehydrogenase; R-5-P, ribose-5-phosphate; PPP, pentose phosphate pathway; NADP+, oxidized nicotinamide adenine-dinucleotide phosphate; NADPH, reduced nicotinamide adenine-dinucleotide phosphate; PRPP, phosphoribosyl pyrophosphate; IMP, inosine monophosphate; AMP, adenosine monophosphate; GMP, guanosine monophosphate; GSSG, glutathione disulfide; GSH, reduced glutathione.
Signaling pathway analysis identified 47 pathways, of which the cytokine-cytokine receptor interaction was most significantly associated with G6PD-related genes. In addition, G6PD-associated genes were demonstrated to be potentially involved in regulating focal adhesion, the MAPK, Jak-STAT, p53, long-term depression and apoptosis signaling pathways. Notably, G6PD itself may be involved in regulating the MAPK and p53 signaling pathways. By increasing the availability of glucose for glycolysis, AMPK functions as a master sensor of cellular energy balance. AMPK is activated when cells undergo energy-depleting stresses (62–65). Due to insufficient NADPH, G6PD-deficiency leads to a switch of the biosynthetic pathway for GSH, thus limiting AMPK activation (62). p38 MAPK has been implicated in a number of cellular processes, including the cell cycle, apoptosis, differentiation, neoplasm metastasis, angiogenesis and vasculogenesis (63). Transforming growth factor-β-activated protein kinase 1-binding protein 1 (TAB1) is a scaffold protein responsible for the autophosphorylation of MAPK (64). Activation of AMPK has been demonstrated to recruit p38 MAPK to the TAB1/AMPK-containing macromolecular complex, thus facilitating p38 MAPK activation in the ischemic heart (64).
It was previously reported that p53 might prevent the inactive G6PD monomer from forming active dimers (65). In addition, p53 may be regulated by G6PD. Following phosphorylation by ataxia telangiectasia mutated (ATM), p53 regulates lipid metabolism through promoting transcription of Lpin1, which encodes a protein that regulates lipid metabolism (66,67). Notably, Lpin1 induction is dependent on elevated ROS and ATM levels, and this process is inhibited by the N-acetyl cysteine antioxidant (66). ATM is activated directly by oxidative stress (67). Considering that the ROS-ATM-p53 signaling pathway contributes to the induction of Lpin1 and G6PD greatly influences ROS levels, it is reasonable to hypothesize that G6PD may regulate p53 function. Whether G6PD regulates MAPK and p53 signaling pathways remains to be addressed in future studies.
Alteration of G6PD-regulated pathways may lead to certain diseases. Dysregulation of G6PD has been reported to be associated with neoplasms (68–70). For example, increased G6PD expression levels correlated with grading, metastasis and poor prognosis in human hepatocellular carcinoma patients (68). Alterations in G6PD levels may promote tumor cell proliferation or apoptosis via the STAT3/5 pathway in a human melanoma xenograft model, and G6PD regulated STAT3 activity via the NADPH oxidase 4-NADPH-ROS-proto-oncogene tyrosine protein kinase/protein-tyrosine phosphatase 1D signaling pathway in A375 melanoma cells (69,70). In the present study that G6PD-associated genes were highly correlated with various cancers, including prostate cancer, glioma, small cell lung cancer, non-small cell lung cancer, chromic myeloid leukemia, pancreatic cancer and bladder cancer. In addition, G6PD-associated genes were highly correlated with autoimmune diseases, including amyotrophic lateral sclerosis, graft-versus-host diseases, and autoimmune thyroid disease. One of the G6PD-associated genes, interleukin 6 (IL6), has been reported to be involved in autoimmune diseases (71). Activation of the IL6 inflammatory loop may mediate trastuzumab resistance in human epidermal growth factor receptor 2-positive breast cancer by promoting growth of the cancer stem cell population (72).
Accumulating evidence suggests that miRNAs are involved in various biological processes and human diseases, and they are versatile regulators of gene expression in higher eukaryotes and additional organisms. Aberrant expression of G6PD leads to the development of a number of different diseases. Therefore, miRNAs capable of targeting G6PD may be of therapeutic interest. Previous studies have reported the potential for particular miRNAs to influence G6PD expression (73,74). Therefore, the aim of the present study was to identify all miRNAs capable of binding G6PD. A total of 33 miRNAs were predicted to target G6PD in at least two of four independent programs employed in the current study. miR-1207-5P, miR-1 and miR-125a-5p were the only three miRNAs predicted by all four software programs to potentially target G6PD, indicating that these three miRNAs may be potentially important regulators of G6PD. Notably, Alvarez (75) validated G6PD as a direct target of miR-1207-5p using a dual Firefly-Renilla luciferase reporter assay.
In conclusion, the present study systematically evaluated G6PD-associated genes and miRNAs that potentially target G6PD. The results of the analysis identified signaling and metabolic pathways regulated by G6PD-associated genes, as well as miRNAs that are predicted to target G6PD. This may provide a greater understanding of the role of G6PD in different pathological processes, and contribute to the development of rational therapeutic approaches for G6PD-associated diseases. However, further experiments will be required to confirm the results. By integrating genomics, transcriptomics, and proteomics analyses of G6PD-associated disorders, a novel area of G6PD research may be explored.
Acknowledgements
The present study was supported by grants from the Natural Science Foundation of China (grant nos. 81160246, 81460421 and 31660246) and the Science and Technology Fund of Yunnan Province (grant nos. 2013FB102 and 2016FB003).
References
- 1.Carson PE, Frischer H. Glucose-6-phosphate dehydrogenase deficiency and related disorders of the pentose phosphate pathway. Am J Med. 1966;41:744–761. doi: 10.1016/0002-9343(66)90035-0. [DOI] [PubMed] [Google Scholar]
- 2.Lewis CA, Parker SJ, Fiske BP, McCloskey D, Gui DY, Green CR, Vokes NI, Feist AM, Heiden MG Vander, Metallo CM. Tracing compartmentalized NADPH metabolism in the cytosol and mitochondria of mammalian cells. Mol Cell. 2014;55:253–263. doi: 10.1016/j.molcel.2014.05.008. [DOI] [PMC free article] [PubMed] [Google Scholar]
- 3.Glucose-6-phosphate dehydrogenase deficiency. WHO Working Group. Bull World Health Organ. 1989;67:601–611. [PMC free article] [PubMed] [Google Scholar]
- 4.Cappellini MD, Fiorelli G. Glucose-6-phosphate dehydrogenase deficiency. Lancet. 2008;371:64–74. doi: 10.1016/S0140-6736(08)60073-2. [DOI] [PubMed] [Google Scholar]
- 5.Wang YP, Zhou LS, Zhao YZ, Wang SW, Chen LL, Liu LX, Ling ZQ, Hu FJ, Sun YP, Zhang JY, et al. Regulation of G6PD acetylation by SIRT2 and KAT9 modulates NADPH homeostasis and cell survival during oxidative stress. EMBO J. 2014;33:1304–1320. doi: 10.1002/embj.201387224. [DOI] [PMC free article] [PubMed] [Google Scholar]
- 6.WHO Working Group, corp-author. Glucose-6-phosphate dehydrogenase deficiency. Bull World Health Organ. 1989;67:601–611. [PMC free article] [PubMed] [Google Scholar]
- 7.Tian WN, Braunstein LD, Apse K, Pang J, Rose M, Tian X, Stanton RC. Importance of glucose-6-phosphate dehydrogenase activity in cell death. Am J Physiol. 1999;276:C1121–C1131. doi: 10.1152/ajpcell.1999.276.5.C1121. [DOI] [PubMed] [Google Scholar]
- 8.Ho HY, Cheng ML, Lu FJ, Chou YH, Stern A, Liang CM, Chiu DT. Enhanced oxidative stress and accelerated cellular senescence in glucose-6-phosphate dehydrogenase (G6PD)-deficient human fibroblasts. Free Radic Biol Med. 2000;29:156–169. doi: 10.1016/S0891-5849(00)00331-2. [DOI] [PubMed] [Google Scholar]
- 9.Pandolfi PP, Sonati F, Rivi R, Mason P, Grosveld F, Luzzatto L. Targeted disruption of the housekeeping gene encoding glucose 6-phosphate dehydrogenase (G6PD): G6PD is dispensable for pentose synthesis but essential for defense against oxidative stress. EMBO J. 1995;14:5209–5215. doi: 10.1002/j.1460-2075.1995.tb00205.x. [DOI] [PMC free article] [PubMed] [Google Scholar]
- 10.Longo L, Vanegas OC, Patel M, Rosti V, Li H, Waka J, Merghoub T, Pandolfi PP, Notaro R, Manova K, Luzzatto L. Maternally transmitted severe glucose 6-phosphate dehydrogenase deficiency is an embryonic lethal. EMBO J. 2002;21:4229–4239. doi: 10.1093/emboj/cdf426. [DOI] [PMC free article] [PubMed] [Google Scholar]
- 11.Kuo W, Lin J, Tang TK. Human glucose-6-phosphate dehydrogenase (G6PD) gene transforms NIH 3T3 cells and induces tumors in nude mice. Int J Cancer. 2000;85:857–864. doi: 10.1002/(SICI)1097-0215(20000315)85:6<857::AID-IJC20>3.3.CO;2-L. [DOI] [PubMed] [Google Scholar]
- 12.Cappai G, Songini M, Doria A, Cavallerano JD, Lorenzi M. Increased prevalence of proliferative retinopathy in patients with type 1 diabetes who are deficient in glucose-6-phosphate dehydrogenase. Diabetologia. 2011;54:1539–1542. doi: 10.1007/s00125-011-2099-3. [DOI] [PubMed] [Google Scholar]
- 13.Heymann AD, Cohen Y, Chodick G. Glucose-6-phosphate dehydrogenase deficiency and type 2 diabetes. Diabetes Care. 2012;35:e58. doi: 10.2337/dc11-2527. [DOI] [PMC free article] [PubMed] [Google Scholar]
- 14.Gaskin RS, Estwick D, Peddi R. G6PD deficiency: Its role in the high prevalence of hypertension and diabetes mellitus. Ethn Dis. 2001;11:749–754. [PubMed] [Google Scholar]
- 15.Rao KN, Elm MS, Kelly RH, Chandar N, Brady EP, Rao B, Shinozuka H, Eagon PK. Hepatic hyperplasia and cancer in rats: Metabolic alterations associated with cell growth. Gastroenterology. 1997;113:238–248. doi: 10.1016/S0016-5085(97)70101-X. [DOI] [PubMed] [Google Scholar]
- 16.Batetta B, Pulisci D, Bonatesta RR, Sanna F, Piras S, Mulas MF, Spano O, Putzolu M, Broccia G, Dessì S. G6PD activity and gene expression in leukemic cells from G6PD-deficient subjects. Cancer Lett. 1999;140:53–58. doi: 10.1016/S0304-3835(99)00052-X. [DOI] [PubMed] [Google Scholar]
- 17.Van Driel BE, Valet GK, Lyon H, Hansen U, Song JY, Van Noorden CJ. Prognostic estimation of survival of colorectal cancer patients with the quantitative histochemical assay of G6PDH activity and the multiparameter classification program CLASSIF1. Cytometry. 1999;38:176–183. doi: 10.1002/(SICI)1097-0320(19990815)38:4<176::AID-CYTO4>3.0.CO;2-#. [DOI] [PubMed] [Google Scholar]
- 18.Polat MF, Taysi S, Gul M, Cikman O, Yilmaz I, Bakan E, Erdogan F. Oxidant/antioxidant status in blood of patients with malignant breast tumour and benign breast disease. Cell Biochem Funct. 2002;20:327–331. doi: 10.1002/cbf.980. [DOI] [PubMed] [Google Scholar]
- 19.Langbein S, Frederiks WM, zur Hausen A, Popa J, Lehmann J, Weiss C, Alken P, Coy JF. Metastasis is promoted by a bioenergetic switch: New targets for progressive renal cell cancer. Int J Cancer. 2008;122:2422–2428. doi: 10.1002/ijc.23403. [DOI] [PubMed] [Google Scholar]
- 20.Wang J, Yuan W, Chen Z, Wu S, Chen J, Ge J, Hou F, Chen Z. Overexpression of G6PD is associated with poor clinical outcome in gastric cancer. Tumour Biol. 2012;33:95–101. doi: 10.1007/s13277-011-0251-9. [DOI] [PubMed] [Google Scholar]
- 21.Hu T, Zhang C, Tang Q, Su Y, Li B, Chen L, Zhang Z, Cai T, Zhu Y. Variant G6PD levels promote tumor cell proliferation or apoptosis via the STAT3/5 pathway in the human melanoma xenograft mouse model. BMC Cancer. 2013;13:251. doi: 10.1186/1471-2407-13-251. [DOI] [PMC free article] [PubMed] [Google Scholar]
- 22.Dong H, Lei J, Ding L, Wen Y, Ju H, Zhang X. MicroRNA: Function, detection, and bioanalysis. Chem Rev. 2013;113:6207–6233. doi: 10.1021/cr300362f. [DOI] [PubMed] [Google Scholar]
- 23.Costinean S, Zanesi N, Pekarsky Y, Tili E, Volinia S, Heerema N, Croce CM. Pre-B cell proliferation and lymphoblastic leukemia/high-grade lymphoma in E(mu)-miR155 transgenic mice. Proc Natl Acad Sci USA. 2006;103:7024–7029. doi: 10.1073/pnas.0602266103. [DOI] [PMC free article] [PubMed] [Google Scholar]
- 24.Zhang B, Pan X, Cobb GP, Anderson TA. microRNAs as oncogenes and tumor suppressors. Dev Biol. 2007;302:1–12. doi: 10.1016/j.ydbio.2006.08.028. [DOI] [PubMed] [Google Scholar]
- 25.Li C, Feng Y, Coukos G, Zhang L. Therapeutic microRNA strategies in human cancer. AAPS J. 2009;11:747–757. doi: 10.1208/s12248-009-9145-9. [DOI] [PMC free article] [PubMed] [Google Scholar]
- 26.Burchard J, Zhang C, Liu AM, Poon RT, Lee NP, Wong KF, Sham PC, Lam BY, Ferguson MD, Tokiwa G, et al. microRNA-122 as a regulator of mitochondrial metabolic gene network in hepatocellular carcinoma. Mol Syst Biol. 2010;6:402. doi: 10.1038/msb.2010.58. [DOI] [PMC free article] [PubMed] [Google Scholar]
- 27.Brameier M, Herwig A, Reinhardt R, Walter L, Gruber J. Human box C/D snoRNAs with miRNA like functions: Expanding the range of regulatory RNAs. Nucleic Acids Res. 2011;39:675–686. doi: 10.1093/nar/gkq776. [DOI] [PMC free article] [PubMed] [Google Scholar]
- 28.Dumortier O, Hinault C, Van Obberghen E. MicroRNAs and metabolism crosstalk in energy homeostasis. Cell Metab. 2013;18:312–324. doi: 10.1016/j.cmet.2013.06.004. [DOI] [PubMed] [Google Scholar]
- 29.Yates LA, Norbury CJ, Gilbert RJ. The long and short of microRNA. Cell. 2013;153:516–519. doi: 10.1016/j.cell.2013.04.003. [DOI] [PubMed] [Google Scholar]
- 30.Dimmeler S, Ylä-Herttuala S. 14q32 miRNA cluster takes center stage in neovascularization. Circ Res. 2014;115:680–682. doi: 10.1161/CIRCRESAHA.114.304973. [DOI] [PubMed] [Google Scholar]
- 31.Sachdeva M, Mito JK, Lee CL, Zhang M, Li Z, Dodd RD, Cason D, Luo L, Ma Y, van Mater D, et al. MicroRNA-182 drives metastasis of primary sarcomas by targeting multiple genes. J Clin Invest. 2014;124:4305–4319. doi: 10.1172/JCI77116. [DOI] [PMC free article] [PubMed] [Google Scholar]
- 32.Xie C, Han Y, Liu Y, Han L, Liu J. miRNA-124 down-regulates SOX8 expression and suppresses cell proliferation in non-small cell lung cancer. Int J Clin Exp Pathol. 2014;7:6534–6542. [PMC free article] [PubMed] [Google Scholar]
- 33.Zhang J, Yang Y, Yang T, Yuan S, Wang R, Pan Z, Yang Y, Huang G, Gu F, Jiang B, et al. Double-negative feedback loop between microRNA-422a and forkhead box (FOX)G1/Q1/E1 regulates hepatocellular carcinoma tumor growth and metastasis. Hepatology. 2015;61:561–573. doi: 10.1002/hep.27491. [DOI] [PubMed] [Google Scholar]
- 34.Johnson CD, Esquela-Kerscher A, Stefani G, Byrom M, Kelnar K, Ovcharenko D, Wilson M, Wang X, Shelton J, Shingara J, et al. The let-7 microRNA represses cell proliferation pathways in human cells. Cancer Res. 2007;67:7713–7722. doi: 10.1158/0008-5472.CAN-07-1083. [DOI] [PubMed] [Google Scholar]
- 35.Welten SM, Bastiaansen AJ, de Jong RC, de Vries MR, Peters EA, Boonstra MC, Sheikh SP, La Monica N, Kandimalla ER, Quax PH, Nossent AY. Inhibition of 14q32 microRNAs miR-329, miR-487b, miR-494, and miR-495 increases neovascularization and blood flow recovery after ischemia. Circ Res. 2014;115:696–708. doi: 10.1161/CIRCRESAHA.114.304747. [DOI] [PubMed] [Google Scholar]
- 36.El Azzouzi H, Leptidis S, Dirkx E, Hoeks J, van Bree B, Brand K, McClellan EA, Poels E, Sluimer JC, van den Hoogenhof MM, et al. The hypoxia-inducible microRNA cluster miR-199a-214 targets myocardial PPARδ and impairs mitochondrial fatty acid oxidation. Cell Metab. 2013;18:341–354. doi: 10.1016/j.cmet.2013.08.009. [DOI] [PubMed] [Google Scholar]
- 37.Settles B. ABNER: An open source tool for automatically tagging genes, proteins and other entity names in text. Bioinformatics. 2005;21:3191–3192. doi: 10.1093/bioinformatics/bti475. [DOI] [PubMed] [Google Scholar]
- 38.Falcon S, Gentleman R. Using GOstats to test gene lists for GO term association. Bioinformatics. 2007;23:257–258. doi: 10.1093/bioinformatics/btl567. [DOI] [PubMed] [Google Scholar]
- 39.Morgan AA, Lu Z, Wang X, Cohen AM, Fluck J, Ruch P, Divoli A, Fundel K, Leaman R, Hakenberg J, et al. Overview of BioCreative II gene normalization. Genome Biol. 2008;9:(Suppl 2): S3. doi: 10.1186/gb-2008-9-s2-s3. [DOI] [PMC free article] [PubMed] [Google Scholar]
- 40.Maglott D, Ostell J, Pruitt KD, Tatusova T. Entrez Gene: Gene-centered information at NCBI. Nucleic Acids Res. 2011;39:D52–D57. doi: 10.1093/nar/gkq1237. [DOI] [PMC free article] [PubMed] [Google Scholar]
- 41.Arighi CN, Carterette B, Cohen KB, Krallinger M, Wilbur WJ, Fey P, Dodson R, Cooper L, van Slyke CE, Dahdul W, et al. An overview of the BioCreative 2012 Workshop Track III: Interactive text mining task. Database (Oxford) 2013;2013:bas056. doi: 10.1093/database/bas056. [DOI] [PMC free article] [PubMed] [Google Scholar]
- 42.Arighi CN, Lu Z, Krallinger M, Cohen KB, Wilbur WJ, Valencia A, Hirschman L, Wu CH. Overview of the BioCreative III workshop. BMC Bioinformatics. 2011;12(Suppl 8):S1. doi: 10.1186/1471-2105-12-S8-S1. [DOI] [PMC free article] [PubMed] [Google Scholar]
- 43.Morgan MFS, Gentleman R. [Jun 2;2011 ];GSEABase: Gene set enrichment data structures and methods. R package version 1.4.0. available at conductor.org. 2007 [Google Scholar]
- 44.Dahlquist KD, Salomonis N, Vranizan K, Lawlor SC, Conklin BR. GenMAPP, a new tool for viewing and analyzing microarray data on biological pathways. Nat Genet. 2002;31:19–20. doi: 10.1038/ng0502-19. [DOI] [PubMed] [Google Scholar]
- 45.Kanehisa M, Goto S, Sato Y, Furumichi M, Tanabe M. KEGG for integration and interpretation of large-scale molecular data sets. Nucleic Acids Res. 2012;40:D109–D114. doi: 10.1093/nar/gkr988. [DOI] [PMC free article] [PubMed] [Google Scholar]
- 46.Kanehisa M, Goto S. KEGG: Kyoto encyclopedia of genes and genomes. Nucleic Acids Res. 2000;28:27–30. doi: 10.1093/nar/28.1.27. [DOI] [PMC free article] [PubMed] [Google Scholar]
- 47.Sultana KZ, Bhattacharjee A, Jamil H. Querying KEGG pathways in logic. Int J Data Min Bioinform. 2014;9:1–21. doi: 10.1504/IJDMB.2014.057772. [DOI] [PubMed] [Google Scholar]
- 48.Pagel P, Kovac S, Oesterheld M, Brauner B, Dunger-Kaltenbach I, Frishman G, Montrone C, Mark P, Stümpflen V, Mewes HW, et al. The MIPS mammalian protein-protein interaction database. Bioinformatics. 2005;21:832–834. doi: 10.1093/bioinformatics/bti115. [DOI] [PubMed] [Google Scholar]
- 49.Pavlopoulos GA, Hooper SD, Sifrim A, Schneider R, Aerts J. Medusa: A tool for exploring and clustering biological networks. BMC Res Notes. 2011;4:384. doi: 10.1186/1756-0500-4-384. [DOI] [PMC free article] [PubMed] [Google Scholar]
- 50.Franceschini A, Szklarczyk D, Frankild S, Kuhn M, Simonovic M, Roth A, Lin J, Minguez P, Bork P, von Mering C, Jensen LJ. STRING v9.1: Protein-protein interaction networks, with increased coverage and integration. Nucleic Acids Res. 2013;41:D808–D815. doi: 10.1093/nar/gks1094. [DOI] [PMC free article] [PubMed] [Google Scholar]
- 51.Agarwal V, Bell GW2, Nam JW, Bartel DP. Predicting effective microRNA target sites in mammalian mRNAs. Elife. 2015 Aug 12; doi: 10.7554/eLife.05005. (Epub ahead of print). doi: 10.7554/eLife.05005. [DOI] [PMC free article] [PubMed] [Google Scholar]
- 52.Li JH, Liu S, Zhou H, Qu LH, Yang JH. starBase v2.0: Decoding miRNA-ceRNA, miRNA-ncRNA and protein-RNA interaction networks from large-scale CLIP-Seq data. Nucleic Acids Res. 2014;42:D92–D97. doi: 10.1093/nar/gkt1248. [DOI] [PMC free article] [PubMed] [Google Scholar]
- 53.Préville X, Salvemini F, Giraud S, Chaufour S, Paul C, Stepien G, Ursini MV, Arrigo AP. Mammalian small stress proteins protect against oxidative stress through their ability to increase glucose-6-phosphate dehydrogenase activity and by maintaining optimal cellular detoxifying machinery. Exp Cell Res. 1999;247:61–78. doi: 10.1006/excr.1998.4347. [DOI] [PubMed] [Google Scholar]
- 54.Rajasekaran NS, Connell P, Christians ES, Yan LJ, Taylor RP, Orosz A, Zhang XQ, Stevenson TJ, Peshock RM, Leopold JA, et al. Human alpha B-crystallin mutation causes oxido-reductive stress and protein aggregation cardiomyopathy in mice. Cell. 2007;130:427–439. doi: 10.1016/j.cell.2007.06.044. [DOI] [PMC free article] [PubMed] [Google Scholar]
- 55.Patra KC, Hay N. The pentose phosphate pathway and cancer. Trends Biochem Sci. 2014;39:347–354. doi: 10.1016/j.tibs.2014.06.005. [DOI] [PMC free article] [PubMed] [Google Scholar]
- 56.Ceddia RB, Bikopoulos GJ, Hilliker AJ, Sweeney G. Insulin stimulates glucose metabolism via the pentose phosphate pathway in Drosophila Kc cells. FEBS Lett. 2003;555:307–310. doi: 10.1016/S0014-5793(03)01261-4. [DOI] [PubMed] [Google Scholar]
- 57.Heidarpour M, Mohri M, Borji H, Moghdass E. Oxidant/antioxidant status in cattle with liver cystic echinococcosis. Vet Parasitol. 2013;195:131–135. doi: 10.1016/j.vetpar.2013.01.018. [DOI] [PubMed] [Google Scholar]
- 58.Gaetani GF, Rolfo M, Arena S, Mangerini R, Meloni GF, Ferraris AM. Active involvement of catalase during hemolytic crises of favism. Blood. 1996;88:1084–1088. [PubMed] [Google Scholar]
- 59.Kirkman HN, Rolfo M, Ferraris AM, Gaetani GF. Mechanisms of protection of catalase by NADPH. Kinetics and stoichiometry. J Biol Chem. 1999;274:13908–13914. doi: 10.1074/jbc.274.20.13908. [DOI] [PubMed] [Google Scholar]
- 60.Abraham S, Soundararajan CC, Vivekanandhan S, Behari M. Erythrocyte antioxidant enzymes in Parkinson's disease. Indian J Med Res. 2005;121:111–115. [PubMed] [Google Scholar]
- 61.Grieger M, Schulz S. Determination of superoxide dismutase (sod) in erythrocytes in glucose-6-phosphate dehydrogenase deficiency (G6PD-deficiency) Folia Haematol Int Mag Klin Morphol Blutforsch. 1983;110:427–436. (In German) [PubMed] [Google Scholar]
- 62.Tang HY, Ho HY, Wu PR, Chen SH, Kuypers FA, Cheng ML, Chiu DT. Inability to maintain GSH pool in G6PD-deficient red cells causes futile AMPK activation and irreversible metabolic disturbance. Antioxid Redox Signal. 2015;22:744–759. doi: 10.1089/ars.2014.6142. [DOI] [PMC free article] [PubMed] [Google Scholar]
- 63.Boutros T, Chevet E, Metrakos P. Mitogen-activated protein (MAP) kinase/MAP kinase phosphatase regulation: Roles in cell growth, death, and cancer. Pharmacol Rev. 2008;60:261–310. doi: 10.1124/pr.107.00106. [DOI] [PubMed] [Google Scholar]
- 64.Li J, Miller EJ, Ninomiya-Tsuji J, Russell RR, III, Young LH. AMP-activated protein kinase activates p38 mitogen-activated protein kinase by increasing recruitment of p38 MAPK to TAB1 in the ischemic heart. Circ Res. 2005;97:872–879. doi: 10.1161/01.RES.0000187458.77026.10. [DOI] [PubMed] [Google Scholar]
- 65.Jiang P, Du W, Wang X, Mancuso A, Gao X, Wu M, Yang X. p53 regulates biosynthesis through direct inactivation of glucose-6-phosphate dehydrogenase. Nat Cell Biol. 2011;13:310–316. doi: 10.1038/ncb2172. [DOI] [PMC free article] [PubMed] [Google Scholar]
- 66.Assaily W, Rubinger DA, Wheaton K, Lin Y, Ma W, Xuan W, Brown-Endres L, Tsuchihara K, Mak TW, Benchimol S. ROS-mediated p53 induction of Lpin1 regulates fatty acid oxidation in response to nutritional stress. Mol Cell. 2011;44:491–501. doi: 10.1016/j.molcel.2011.08.038. [DOI] [PubMed] [Google Scholar]
- 67.Guo Z, Kozlov S, Lavin MF, Person MD, Paull TT. ATM activation by oxidative stress. Science. 2010;330:517–521. doi: 10.1126/science.1192912. [DOI] [PubMed] [Google Scholar]
- 68.Kowalik MA, Guzzo G, Morandi A, Perra A, Menegon S, Masgras I, Trevisan E, Angioni MM, Fornari F, Quagliata L, et al. Metabolic reprogramming identifies the most aggressive lesions at early phases of hepatic carcinogenesis. Oncotarget. 2016;7:32375–32393. doi: 10.18632/oncotarget.8632. [DOI] [PMC free article] [PubMed] [Google Scholar]
- 69.Hu T, Zhang C, Tang Q, Su Y, Li B, Chen L, Zhang Z, Cai T, Zhu Y. Variant G6PD levels promote tumor cell proliferation or apoptosis via the STAT3/5 pathway in the human melanoma xenograft mouse model. BMC Cancer. 2013;13:251. doi: 10.1186/1471-2407-13-251. [DOI] [PMC free article] [PubMed] [Google Scholar]
- 70.Cai T, Kuang Y, Zhang C, Zhang Z, Chen L, Li B, Li Y, Wang Y, Yang H, Han Q, Zhu Y. Glucose-6-phosphate dehydrogenase and NADPH oxidase 4 control STAT3 activity in melanoma cells through a pathway involving reactive oxygen species, c-SRC and SHP2. Am J Cancer Res. 2015;5:1610–1620. [PMC free article] [PubMed] [Google Scholar]
- 71.Liao SL, Lai SH, Tsai MH, Weng YH. Cytokine responses of TNF-α, IL-6, and IL-10 in G6PD-deficient infants. Pediatr Hematol Oncol. 2014;31:87–94. doi: 10.3109/08880018.2013.865821. [DOI] [PubMed] [Google Scholar]
- 72.Korkaya H, Kim GI, Davis A, Malik F, Henry NL, Ithimakin S, Quraishi AA, Tawakkol N, D'Angelo R, Paulson AK, et al. Activation of an IL6 inflammatory loop mediates trastuzumab resistance in HER2+ breast cancer by expanding the cancer stem cell population. Mol Cell. 2012;47:570–584. doi: 10.1016/j.molcel.2012.06.014. [DOI] [PMC free article] [PubMed] [Google Scholar]
- 73.Hu T, Chang YF, Xiao Z, Mao R, Tong J, Chen B, Liu GC, Hong Y, Chen HL, Kong SY, et al. miR-1 inhibits progression of high-risk papillomavirus-associated human cervical cancer by targeting G6PD. Oncotarget. 2016;7:86103–86116. doi: 10.18632/oncotarget.13344. [DOI] [PMC free article] [PubMed] [Google Scholar]
- 74.Coda DM, Lingua MF, Morena D, Foglizzo V, Bersani F, Ala U, Ponzetto C, Taulli R. SMYD1 and G6PD modulation are critical events for miR-206-mediated differentiation of rhabdomyosarcoma. Cell Cycle. 2015;14:1389–1402. doi: 10.1080/15384101.2015.1005993. [DOI] [PMC free article] [PubMed] [Google Scholar]
- 75.Alvarez ML. Faster experimental validation of microRNA targets using cold fusion cloning and a dual firefly-Renilla luciferase reporter assay. Methods Mol Biol. 2014;1182:227–243. doi: 10.1007/978-1-4939-1062-5_21. [DOI] [PubMed] [Google Scholar]