

Abstract
Introduction
Studying remitted Major Depressive Disorder (rMDD) facilitates a better understanding of neural mechanisms for risk, given that confounding effects of active symptoms are removed. Disrupted functional connectivity has been reported in multiple networks in MDD. However, no study to date of rMDD has specifically examined connectivity of the ventral striatum (VS), a region highly implicated in reward and motivation. We investigated functional connectivity of the VS in individuals with and without a history of MDD, and in relation to affective personality traits.
Methods
Forty-two individuals with rMDD and 28 healthy controls across two sites completed resting-state fMRI and the Behavioral Inhibition System/Behavioral Activation System Scale. Voxel-wise, whole-brain comparisons were conducted across and between groups for four seeds: left and right inferior VS (VSi), left and right superior VS (VSs).
Results
VSs connectivity to temporal and subcortical regions including the putamen and amygdala was positive and greater in HCs compared to rMDD individuals. Across groups, VSi connectivity was positively correlated with trait reward-responsiveness in somatomotor regions. Across groups, VSs connectivity was positively correlated with trait drive, particularly in the putamen, parahippocampal, and inferior temporal gyrus, and was negatively associated with trait behavioral inhibition in the anterior cingulate, frontal gyri, and insula.
Limitations
Limitations include scanning at two sites and using multiple comparisons.
Discussion
Group connectivity differences emerged from the VSs rather than VSi. VSs showed associations with trait drive and behavioral inhibition, whereas VSi corrrelated with reward-responsiveness. Depression history and affective traits contribute meaningful and specific information about VS connectivity in understanding risk for MDD.
Keywords: ventral striatum, functional connectivity, depression, reward-responsiveness, affective traits
Introduction
Studying remitted MDD (rMDD) may facilitate a clearer understanding of disease mechanisms because symptoms related to active MDD are diminished, thus potentially allowing for the dissociation of state and trait factors. However, evidence of differences between individuals with rMDD and healthy controls (HC) is mixed, specifically with reward task performance. For example, young adults with rMDD exhibited intact reward responsiveness performance compared to HC, while active MDD individuals exhibited deficits (DelDonno et al., 2015). In another study, however, individuals with rMDD responded slower than HCs during reward anticipation (Dichter et al., 2012) and failed to develop a response bias towards rewarding stimuli (Pizzagalli et al., 2009; Pechtel et al., 2013; Whitton et al., 2016). Differences in reward task performance may challenge interpretations for task-based fMRI.
Task-related brain activation differences between rMDD and HC individuals (e.g. Morgan et al., 2015) may be more sensitive than performance markers (Admon et al., 2015; Dichter et al., 2012; Jenkins et al., 2015). Individuals with rMDD exhibited greater activation relative to HCs during reward anticipation in the bilateral anterior cingulate gyrus, right midfrontal gyrus, and right cerebellum (Dichter et al., 2012). During reward receipt, individuals with rMDD exhibited hypoactivation compared to HCs in the bilateral orbital frontal cortex (OFC), right frontal pole, left insular cortex, and left thalamus, with no performance differences (Dichter et al., 2012). In a mildly stressful negative picture-viewing task, individuals with rMDD showed hyperactivation relative to HCs in the caudate, nucleus accumbens (NAcc), and putamen (Admon et al., 2015). Moreover, studies examining reward responding in individuals with active MDD have reported weaker activation in the NAcc/VS and caudate compared to HCs (Pizzagalli et al., 2009; Smoski et al., 2009). Overall, evidence for network activation alterations at rest and during tasks in MDD is mixed, particularly regarding ventral striatum (VS) activation. Examining resting-state functional connectivity (rsFC), which may reflect stable trait-like neural characteristics that are independent of and more generalizable than task activation and performance differences, may clarify mixed findings about reward-relevant neural activity in MDD. A better understanding of neural vulnerabilities revealed by rsFC analyses of individuals not currently depressed (but who are at risk for recurrence given their prior history) may improve our understanding of disease mechanisms, novel treatment targets, and relapse prediction.
Meta-analysis of rsFC in MDD has revealed three overarching patterns that support a model of depression in which dysfunctional communication between networks relates to deficits in cognitive control, emotional regulation, and internal thought (Kaiser et al., 2015). First, individuals with MDD exhibited hypoconnectivity relative to HCs in frontoparietal regions implicated in cognitive control such as the dorsolateral prefrontal cortex (DLPFC) and posterior parietal cortex (Kaiser et al., 2015). Second, individuals with MDD relative to HC showed reduced connectivity between the medial PFC (MPFC) and limbic regions, suggesting aberrant emotion regulation in terms of diminished positivity (hypoconnectivity of MPFC and NAcc) and heightened negativity (hyperconnectivity of MPFC and amygdala) (Kaiser et al., 2015). Third, there was mixed evidence for hypoconnectivity between regions responsible for salience processing and cognitive control or internal thought in those with MDD relative to HC (Kaiser et al., 2015).
Examining rsFC in remitted versus active MDD may allow for a more accurate view of the complex neural networks at play in that we may be capturing underlying mechanisms in the absence of symptoms that represent risk for relapse. It is also possible that rsFC abnormalities seen in MDD may or may not be present in rMDD. The present study focused on the VS, a primary structure in reward, motivation, and incentive salience (Di Martino et al., 2008) within the salience and emotion network (SEN; Seeley et al., 2007), as the seed for rsFC analyses. To define the SEN, we referred to work by Seeley and colleagues, who proposed that regions responsible for salience, affect, and emotion processing belong in a single salience-emotion network (2007). The SEN includes the medial thalamus, amygdala, insula, dorsal anterior cingulate cortex (dACC), and OFC (Seeley et al., 2007), with strong connections to other limbic structures such as the hypothalamus and NAcc (Sheline et al., 2010; Wang et al., 2012). The SEN integrates sensory information with internal and hedonic signals to facilitate or impede decisions, and includes emotional responses to pain, response to pleasurable music or touch, homeostatic regulation, and response to reward (Seeley et al., 2007). In addition to the SEN, previous studies have evaluated the default mode network (DMN; Yeo et al., 2011). Compared to HCs, young adults with rMDD exhibited hyperconnectivity of the DMN (i.e. posterior cingulate cortex [PCC] and subgenual cingulate) with lateral, parietal, and frontal regions (Jacobs et al., 2014). In fact, a machine-learning algorithm predicted rMDD versus HC status based on increased rsFC between left PCC and DLPFC (Bhaumik et al., 2016). Young adults with rMDD also showed left amygdala hyperconnectivity with the right medial frontal gyrus, medial parietal lobe, rostral ACC, and left parahippocampal gyrus, which suggests that SEN connectivity may be increased in individuals with rMDD compared to HCs (Jacobs et al., 2014). In contrast, greater amygdala connectivity with the superior VS predicted rMDD versus HC classification (Bhaumik et al., 2016). Hyperconnectivity from the caudate to the amygdala and hippocampus has been reported in adults with rMDD compared to HCs (Admon et al., 2015). In late adolescent boys with rMDD, hyperconnectivity between the NAcc and MPFC relative to HCs was observed when winning a reward relative to losing (Morgan et al., 2015). Overall, these rsFC studies suggest that the DMN and SEN are disrupted in rMDD.
The present study investigated rsFC of the VS in rMDD young adults, an understudied seed and sample. We chose to separately examine the superior VS (VSs, or ventral caudate head) and the inferior VS (VSi, or NAcc; Di Martino et al., 2008), not often done in the depression and reward literature. These segregations were based upon the seeds used by Di Martino and colleagues so that the present results could be compared across that study. The more dorsal and posterior caudal seeds were excluded to limit multiple comparisons concerns and focus on reward circuitry. First, we examined VS connectivity across groups in relation to self-reported behavioral approach (reward-responsiveness and drive) and inhibition to probe whether VS connectivity dimensionally relates to affective and motivation-relevant personality traits. Reward-responsiveness, drive, and behavioral inhibition (Carver & White, 1994) may better capture dimensional risks for illness, given previous findings that these affective traits did not differ between individuals with rMDD and HCs (DelDonno et al., 2015). Second, despite mixed findings on SEN functioning in active MDD, we hypothesized increased connectivity between the VS and SEN in rMDD compared to HC individuals. In a smaller subset of the present sample, our group recently found that greater amygdala and VSs connectivity predicted rMDD status (Bhaumik et al., 2016) and we designed our second hypothesis to follow up on this finding. We also predicted hyperconnectivity from the VS to the DMN in the rMDD group relative to HCs, given the association of DMN hyperconnectivity with key clinical features of rMDD (Jacobs et al., 2014).
Methods
Participants
Participants were recruited from the community in two sites: Ann Arbor, Michigan (2010-2012) and Chicago, Illinois (2012-2015). Participants were 70 adults aged 18-23 years old with no chronic or serious medical conditions. Of the 34 participants recruited in Ann Arbor, 56% were in the rMDD group. Of the 36 participants recruited in Chicago, 64% were in the rMDD group. Remitted MDD participants identified themselves as 69% white, 10% Asian, 5% black, 5% more than one race, 2% Middle Eastern, 2% Mexican, and 7% not reported. Remitted MDD participants (n = 42, 76% female) had one to five prior episodes of MDD (M = 2.05, SD = 1.97) but none in the past month, and the average age of first episode was 16 (SD = 2.91). Remitted MDD participants could have a family history of depression or anxiety, could have a comorbid anxiety diagnosis, and were free of psychotropic medication use in the past three months. Healthy control (HC; n = 28, 50% female) participants had no personal or family history of any psychiatric disorder. HCs identified themselves as 68% white, 14% Asian, 11% Indian, 4% black, and 4% Latino. Current or past psychotic symptoms, current or past bipolar disorder or mania, family history of psychosis, history of suicidal attempts or ideation in the past six months, regular tobacco use (more than 10 cigarettes per week), and presence of alcohol or substance abuse in the last six months were exclusionary criteria for both groups. Table 1 reports participant demographics and clinical characteristics.
Table 1. Participant demographics and clinical characteristics.
| rMDD (n = 42) | HC (n = 28) | t/χ2 | p | |
|---|---|---|---|---|
| Age | 21 (1.53) | 21 (1.56) | -.32 | .73 |
| Percent female | 76% | 50% | 5.12 | .02 |
| Race/ethnicity | - | - | 11.01 | .20 |
| Years of education | 14.40 (1.36) | 14.86 (1.24) | 1.41 | .16 |
| Verbal IQ estimate | 107.86 (9.07) | 107.00 (8.96) | .39 | .70 |
| HAM-D | 4.17 (.70) | .46 (1.07) | -2.95 | .004 |
| HAM-A | 2.84 (2.99) | .60 (1.35) | -2.69 | .01 |
| BAS-RR | 16.89 (1.87) | 17.04 (1.48) | .35 | .73 |
| BAS-D | 10.61 (2.06) | 10.29 (1.35) | .35 | .73 |
| BIS | 19.82 (3.38) | 19.08 (2.55) | -.97 | .33 |
HC, Healthy control; rMDD, remitted major depressive disorder; HAM-D, Hamilton Rating Scale for Depression; HAM-A, Hamilton Rating Scale for Anxiety; BAS-RR, Behavioral Activation Scale – Reward-Responsiveness; BAS-D, Behavioral Activation Scale – Drive.
Procedure
All study procedures were approved by the University of Michigan (UM) and the University of Illinois at Chicago (UIC) IRBs. Participants were screened over the phone by trained research assistants and provided informed consent in accordance with the Declaration of Helsinki. History of MDD diagnosis was determined by the Diagnostic Interview for Genetic Studies (Nurnberger et al., 1994), conducted by a trained masters- or doctoral-level interviewer. The interviewer also assessed current symptoms of depression and anxiety with the Hamilton Depression Rating Scale (HAM-D; Hamilton, 1960), and Hamilton Anxiety Rating Scale (HAM-A; Hamilton, 1959). A verbal IQ estimate was obtained (Shipley et al., 2009). Participants completed the BIS/BAS questionnaire and an fMRI scan. The fMRI tasks, order of tasks, and duration of scan were the same at both sites. Participants were compensated $120 for completion of the fMRI scan with the opportunity to win up to an additional $52 based upon performance on a computerized task. The resting-state scan was acquired after all tasks had been performed.
Measures
Behavioral Inhibition Scale/Behavioral Activation Scale (BIS/BAS)
The BIS/BAS is a 20-item self-report measure that assesses trait negative affect and appetitive motivation (Carver and White, 1994). The BAS has three subscales: Reward-Responsiveness (BAS-RR), Drive (BAS-D), and Fun-Seeking (BAS-FS). The BAS-RR probed reward anticipation or receipt (e.g., “When I get something I want, I feel excited and energized”). The BAS-D assessed goal pursuit (e.g., “I go out of my way to get things I want”). BAS-FS measured impulsivity and novelty-seeking. Because BAS-FS is less relevant to reward (Taubitz et al., 2015), it was not included as a variable in the present study. The BIS measured punishment anticipation, sensitivity to anxiety-provoking circumstances (e.g., “Criticism or scolding hurts me quite a bit”), and conflict generation and resolution (McNaughton and Gray, 2000). Items are rated on a Likert scale (1 = strongly disagree; 4 = strongly agree). The BIS/BAS has appropriate divergent and convergent validity, test-retest correlations ranging from 0.59 to 0.69 (Carver and White, 1994), high internal consistency, moderate intercorrelation of the BAS subscales, and high long-term reliability in assessing stable characteristics in a depressed sample (Kasch et al., 2002). The present sample had adequate internal consistency (Cronbach's α = .75) and moderately low correlation of BAS-RR and BAS-D (r = .30).
Resting-State Functional MRI Connectivity
fMRI acquisition
Functional connectivity data were acquired during an eight-minute eyes-open resting state scan at 3.0 T. At UM, scans were acquired on a GE Signa scanner using a T2* weighted single shot reverse spiral sequence (29 4-mm thick slices, TE = 30 ms; TR = 2000 ms; 240 TRs total; flip angle = 90°; FOV = 20; matrix = 64 × 64). At UIC, scans were acquired on a GE Discovery scanner using parallel imaging with ASSET and T2* gradient-echo axial echo planar imaging sequence (44 3-mm thick slices, TE = 22.2 ms; TR = 2000 ms; 240 TRs total; flip angle = 90°; FOV = 22; matrix = 64 × 64). High-resolution T1 anatomic scans were obtained for spatial normalization. Participants were instructed to keep their eyes open and fixate on a cross on the screen.
fMRI Preprocessing
Images underwent slice-timing corrections with SPM8 (http://www.fil.ion.ucl.ac.uk/spm/doc/) and motion detection algorithms with FSL (http://fsl.fmrib.ox.ac.uk/fsl/fslwiki/). During pre-processing, images were visually inspected and subjects were removed if they had motion greater than 1.5 mm across more than three TRs. Structural and functional images were co-registered and then the co-registered T1-SPGR underwent spatial normalization (DARTEL to MNI template). The resulting normalization matrix was then applied to the slice-time-corrected, movement corrected, time series data and smoothed with a 5 mm Gaussian kernel. Resulting T2* images were 2 mm on a side with isotropic voxels.
Cross-Correlation Analysis
Time series was detrended and mean centered. Physiologic correction was performed by regressing out mean signal from white matter and cerebral spinal fluid (Behzadi et al., 2007). Motion parameters and deviations in x, y, and z translation were regressed out within first level models (Jo et al., 2013). Global signal was not regressed due to colinearity violations with gray matter signal, problematic misestimates and introductions of anticorrelations (Fox et al., 2013), and effect on distance-micromovement relationships (Jo et al., 2013). Finally, time-series were bandpass filtered over 0.01–0.10 Hz. Seeds of interest were the left VSs, right VSs, left VSi, and right VSi, using the following coordinates: -10, 15, 0; 10, 15, 0; -9, 9, -8; and 9, 9, -8, respectively (Di Martino et al., 2008; Figure 1). These four spherical ROIs comprised 19 voxels (6×6×6 mm sphere) and were validated in MNI space. Spatially averaged time course data were modeled from each ROI in cross correlation analyses. Correlation coefficients between mean time course for the four seed regions and all other voxels of the brain were calculated, producing a three-dimensional correlation coefficient r image. R images were transformed to z-scores using a Fisher transformation, and the resulting z maps were used in independent samples t tests conducted in SPM8. In MarsBaR (Brett et al., 2002), mean z values were extracted from each cluster that differed significantly between groups or correlated with BIS/BAS scores, separately for each seed and participant.
Figure 1.
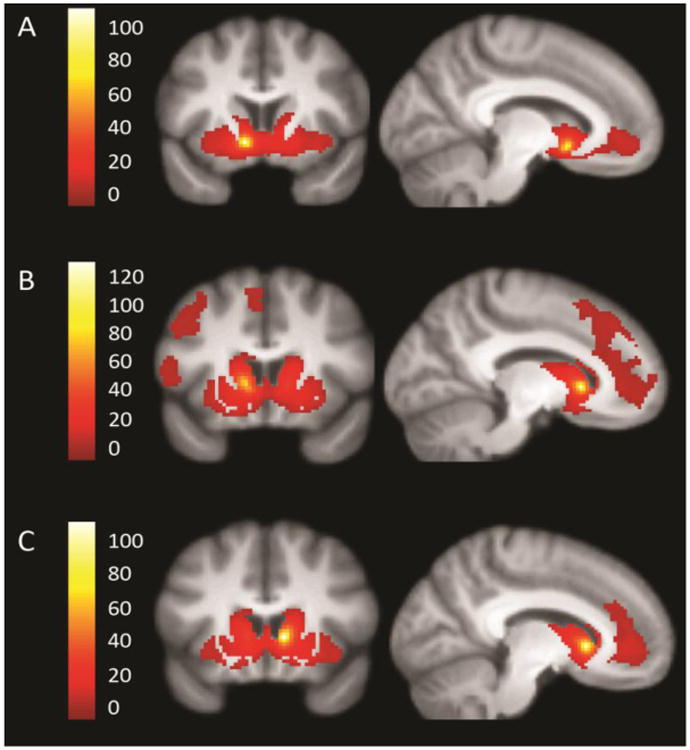
Network connectivity of the VS seeds across groups. The left inferior ventral striatum (A), left superior VS (B), and right superior VS (C) seeds are shown, t = 10. Right inferior VS connectivity was similar to left inferior VS and is not shown. The seeds are highlighted in yellow and each panel shows the extent of the network.
Statistical Analyses
Linear regressions with multiple predictors were computed for each of the four seeds using SPM8. For the primary aim, predictors were BAS-RR, BAS-D, BIS. For the secondary aim, diagnostic group was the predictor. Analyses for both aims included sex and site as covariates. Z values from regions that were temporally correlated with the seed region were the dependent variables. Contrasts were made for the predictor of interest, with all other predictors included as covariates. For example, the contrast with BAS-RR as the predictor of interest included BAS-D, BIS, diagnostic group, sex, and site as covariates. Whole brain correction was achieved for each multiple regression model at p = .01 by conducting 1000 Monte Carlo simulations in 3dClustSim to determine a joint threshold of height and extent (p < .005, extent of 464 mm3). The Monte Carlo approach was intended to balance Type I and Type II error and cluster extent was determined using the bug-fixed 3dClustSim tool (Cox et al., 2016), with each of the sixteen regression models having a corrected p < .01, the FWE = .16. Post-hoc, a Bonferroni correction was applied to achieve FWE < .05; clusters of activation that did not survive Bonferroni correction are noted in the tables reporting results of the regression models (Tables 2 and 3). Two QC post-hoc motion correction strategies were employed. First, the standard deviations of movement along the x, y, and z axes were checked for significant relationships with the predictors and extracted cluster values. These movement parameters were not significantly correlated with the affective trait measures (p's > .05) and did not significantly differ between groups (t = .50, t = .65, t = -.61 for deviations in x, y, and z translation, respectively, all p's > .05). Second, framewise displacement, defined as the sum of the absolute values of the six realignment parameters' derivatives (Power et al., 2012), was calculated for each participant. By providing a measure of the degree to which head position has changed from one frame to the next, framewise displacement (Power et al., 2012) represents a conservative index of data quality. Framewise displacement did not differ between groups (t = 1.77, p = .08; Supplemental Figure 1) and was not associated with the predictor variables BIS, BAS-RR, or BAS-D (all p's > .05).
Table 2. Functional connectivity clusters relating to predictors and group – VSi seeds.
| Seed | Contrast | Lobe | Gyrus | BA | MNI coordinatesa | Z | mm3 | ||
|---|---|---|---|---|---|---|---|---|---|
|
| |||||||||
| x | y | z | |||||||
| LVSi | BIS negative | Frontal | Superior frontal | - | -18 | 54 | 14 | 3.94 | 624 |
| Precentral | 6 | 52 | -12 | 36 | 3.16 | 560B | |||
| Parietal | ^ Postcentral | 3 | -32 | -34 | 56 | 3.41 | 728 | ||
| Temporal | ^ ○ Superior temporal | 38 | -38 | 12 | -40 | 3.92 | 504B | ||
| BAS-RR positive | Frontal | Mid/posterior cingulate | 24/31/5 | 6 | -12 | 36 | 3.74 | 2480 | |
| ^ Superior frontal | 6 | 12 | -2 | 70 | 3.18 | 688 | |||
| Occipital | Lingual | 17/18/1 9 | -14 | -94 | 20 | 3.8 | 3968 | ||
| Parietal | Inferior parietal | 40/5 | 48 | -18 | 32 | 3.49 | 800 | ||
| ^ Postcentral | 5/3 | -12 | -46 | 64 | 3.76 | 4152 | |||
| 5/3 | 20 | -44 | 70 | 3.75 | 1480 | ||||
| ^ Postcentral/supramarginal | 43/39 | 56 | -14 | 20 | 3.38 | 728 | |||
| Subcortical | Medial dorsal nucleus/pulvinar | - | 8 | -20 | 8 | 4.29 | 784 | ||
| Uvula | - | 22 | -84 | -36 | 3.37 | 816 | |||
| HC greater than rMDD | Temporal | Inferior temporal | 20 | 52 | -36 | -24 | 3.25 | 760 | |
| RVSi | BIS negative | Temporal | Middle temporal | 38 | -40 | 14 | -40 | 3.49 | 576B |
| BAS-RR positive | Frontal | Precentral | 4 | 48 | -16 | 34 | 3.43 | 568B | |
| Occipital | ^ Inferior occipital | 19/18 | -44 | -80 | -12 | 4.37 | 1392 | ||
| ^ Lingual | 18/17/1 9 | -8 | -98 | -14 | 5.11 | 3480 | |||
| Parietal | Postcentral | 43 | 60 | -10 | 12 | 3.18 | 592B | ||
| Postcentral, paracentral | 40/5/4/ 3/7 | 28 | -46 | 62 | 3.65 | 4088 | |||
| Precuneus | 19/7 | 28 | -82 | 40 | 3.81 | 880 | |||
| ^ Superior parietal | 7 | -32 | -40 | 50 | 3.81 | 2272 | |||
| Temporal | ^ Inferior temporal, fusiform | 37/20 | 52 | -40 | -22 | 3.31 | 888 | ||
| Inferior temporal, middle occipital | 37/19/1 8 | 46 | -72 | -14 | 4.64 | 5320 | |||
| Middle temporal | 39/19 | -52 | -66 | 14 | 3.24 | 904 | |||
| Subcortical | Posterior lobe, pyramis | - | 6 | -80 | -38 | 3.56 | 592B | ||
| Posterior lobe, uvula, declive | - | 18 | -84 | -34 | 3.7 | 1016 | |||
| BAS-D negative | Parietal | Inferior parietal | 40 | -40 | -48 | 60 | 4.49 | 752 | |
| HC greater than rMDD | Temporal | Inferior temporal, fusiform | 37/20 | 52 | -40 | -22 | 3.99 | 1376 | |
HC, Healthy control; rMDD, remitted major depressive disorder; BA, Brodmann area.
x, y, z = MNI (Montreal Neurological Institute) coordinates of significant effects.
Cluster significantly correlated with movement along the y axis.
Cluster significantly correlated with movement along the z axis.
Cluster not significant after Bonferroni correction.
Table 3. Functional connectivity clusters relating to predictors and group – VSs seeds.
| Seed | Contrast | Lobe | Gyrus | BA | MNI coordinatesa | Z | mm3 | ||
|---|---|---|---|---|---|---|---|---|---|
|
| |||||||||
| x | y | z | |||||||
| LVSs | BIS negative | Frontal | Dorsal anterior cingulate | 32/24 | 2 | 22 | 30 | 4.13 | 1352 |
| Subcortical | Caudate head | - | 8 | 10 | 2 | 4 | 544B | ||
| BAS-RR positive | Subcortical | Pons | - | 4 | -30 | -32 | 4.83 | 608 | |
| Temporal | *^ Parahippocampal | 36/35 | -14 | -34 | -10 | 3.89 | 488B | ||
| BAS-D positive | Frontal | Precentral | 13/6/44 | -48 | 2 | 10 | 4.28 | 1544 | |
| Parietal | *Cingulate | 23/31 | 2 | -36 | 26 | 3.2 | 888 | ||
| Inferior parietal | 19/7/39 | -38 | -68 | 42 | 3.26 | 624 | |||
| Superior parietal | 7 | 24 | -80 | 48 | 3.09 | 936 | |||
| *○ Posterior lobe, declive | - | 18 | -86 | -38 | 3.23 | 464B | |||
| Temporal | Fusiform/parahippocampal | 20/37 | -40 | -14 | -30 | 3.9 | 1424 | ||
| ^ Inferior temporal | 20/21 | -68 | -24 | -14 | 4.53 | 736 | |||
| ^ | 20 | 62 | -40 | -20 | 59 | 472B | |||
| HC greater than rMDD | Temporal | ○ Putamen, amygdala, inferior frontal | 47 | 28 | 2 | -16 | 3.72 | 2936 | |
| RVSs | BIS negative | Frontal | Anterior cingulate | 32 | 4 | 22 | 32 | 3.49 | 848 |
| ○ Frontal inferior operculum, precentral | 22/44 | 52 | 8 | 4 | 4.02 | 3600 | |||
| Occipital | Lingual | 18/17 | -22 | -96 | -12 | 3.82 | 824 | ||
| Parietal | ^ Supramarginal | 40 | -52 | -38 | 28 | 3.82 | 504B | ||
| Temporal | ^ Superior temporal | 22 | 48 | 18 | -6 | 3.56 | 552B | ||
| ○ Superior temporal, insula | 22/1 3 | -46 | 10 | -4 | 3.95 | 4856 | |||
| BAS-RR positive | Frontal | Anterior cingulate | 32 | 0 | 22 | -10 | 3.56 | 496B | |
| Subcortical | Pons | - | 4 | -30 | -34 | 4.2 | 632 | ||
| * Pulvinar | - | 10 | -26 | 6 | 3.29 | 560B | |||
| BAS-D positive | Frontal | ○ Dorsolateral prefrontal cortex | 46 | -34 | 44 | 0 | 3.79 | 488B | |
| ○ ^ Middle frontal | 44 | -44 | 8 | 12 | 3.85 | 1768 | |||
| Parietal | ^ ○ Precuneus | 7 | 16 | -66 | 54 | 3.77 | 760 | ||
| BAS-D negative | Temporal | Superior temporal/insula | 22/13 | 36 | 12 | -26 | 3.59 | 480B | |
| HC greater than rMDD | Subcortical | ○ Parahippocampal, lentiform nucleus, amygdala | 34 | -24 | -2 | -18 | 3.84 | 2824 | |
| *○ Parahippocampal, lentiform nucleus, amygdala | 34 | 28 | 0 | -12 | 3.97 | 4840 | |||
| Temporal | Inferior temporal | 20 | 62 | -26 | -28 | 3.66 | 728 | ||
| Superior temporal | 40/42 | 66 | -26 | 12 | 3.33 | 1112 | |||
| HC less than rMDD | Frontal | Superior frontal | 8 | 12 | 28 | 46 | 3.48 | 520B | |
| Occipit al | * ^ Lingual | 18 | -26 | -88 | -10 | 3.87 | 1136 | ||
HC, Healthy control; rMDD, remitted major depressive disorder; BA, Brodmann area.
x, y, z = MNI (Montreal Neurological Institute) coordinates of significant effect.
Cluster significantly correlated with movement along the x axis.
Cluster significantly correlated with movement along the y axis.
Cluster significantly correlated with movement along the z axis.
Cluster not significant after Bonferroni correction.
Results
VSi Results Summary
BAS-RR was correlated with VSi connectivity to many regions, including the inferior temporal, middle temporal, and fusiform gyri, as well as parietal clusters such as the precuneus, postcentral, paracentral, and superior parietal gyri (Figure 2, Panels A1 and A2). The VSi seeds related to few connectivity differences between groups (Figure 2, Panels B1 and B2).
Figure 2.

VSi connectivity relating to affective traits and diagnostic group. Several regions of connectivity to the LVSi (Panel A1) and RVSi (Panel A2) were positively correlated with BAS-RR. HCs had greater connectivity than rMDDs from the LVSi (Panel B1) and RVSi (Panel B2). All images display using threshold of p < .005 and k > 55.
Left Ventral Striatum – Inferior (LVSi)
Table 2 reports regions of connectivity from the LVSi seed in relation to BIS/BAS scales and diagnosis.
Affective Traits
LVSi connectivity to the superior frontal gyrus (L), precentral gyrus (R), postcentral gyrus (L), and superior temporal gyrus (L) was negatively correlated with BIS. BAS-RR was positively correlated with LVSi connectivity to the posterior cingulate (R), superior frontal gyrus (R), lingual gyrus (L), inferior parietal gyrus (R), postcentral gyrus (B), supramarginal gyrus (R), thalamus (R), and uvula (R).
Diagnosis
Relative to rMDDs, HCs showed greater connectivity from LVSi to the right inferior temporal gyrus.
Right Ventral Striatum – Inferior (RVSi)
Table 2 reports regions of connectivity from the RVSi seed in relation to BIS/BAS scales and diagnosis.
Affective Traits
RVSi connectivity was positively correlated with BAS-RR, in regions including the precentral gyrus (R), inferior occipital gyrus (L), lingual gyrus (L), postcentral gyrus (R), paracentral gyrus (R), precuneus (R), superior parietal gyrus (L), fusiform gyrus (R), middle temporal gyrus (L), inferior temporal gyrus (R), pyramis (R), and uvula/declive (R). RVSi connectivity to the left middle temporal gyrus was negatively correlated with BIS. RVSi connectivity to the left inferior parietal gyrus was negatively correlated with BAS-D.
Diagnosis
HCs had greater connectivity from RVSi to the right inferior temporal and fusiform gyri relative to individuals with rMDD.
VSs Results Summary
BAS-D was correlated with VSs connectivity to several frontal, temporal, and parietal regions, including the middle frontal, cingulate, precuneus, fusiform, parahippocampal, and inferior temporal gyri (Figure 3, Panels A1 and A2). BIS was negatively correlated with connectivity from the VSs to the ACC, superior temporal gyrus, and insula (Figure 3, Panels B1 and B2). Groups differed in connectivity from the VSs seeds to temporal and subcortical regions such as the inferior and superior temporal gyri, putamen, and amygdala (Figure 3, Panels C1 and C2).
Figure 3.
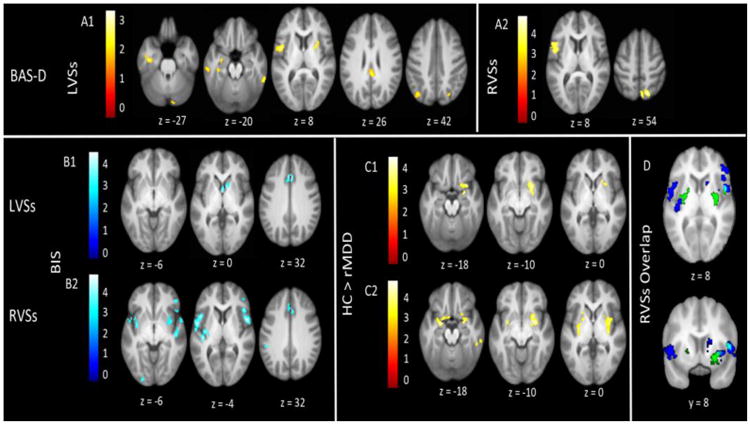
VSs connectivity relating to affective traits and diagnostic group. Several regions of connectivity with the LVSs (Panel A1) and RVSs (Panel A2) were positively correlated with BAS-D. Several regions of connectivity with the LVSs (Panel B1) and RVSs (Panel B2) were negatively correlated with BIS. HCs had greater connectivity than rMDDs from the LVSs (Panel C1) and RVSs (Panel C2). Panel D displays the overlap (light blue) between connectivity regions that negatively related to BIS (dark blue) and were greater in HCs than rMDDs (green). All images display using a threshold of p < .005 and k > 55.
Left Ventral Striatum – Superior (LVSs)
Table 3 reports regions of connectivity from the LVSs seed in relation to BIS/BAS scales and diagnosis.
Affective Traits
LVSs connectivity to the right dorsal ACC and right caudate head was negatively correlated with BIS. Positive LVSs connectivity correlations included BAS-RR with the pons (R) and parahippocampal gyrus (L), and BAS-D with the precentral gyrus (L), cingulate (R), inferior (L) and superior (R) parietal gyri, declive (R), fusiform and parahippocampal gyri (L), and inferior temporal gyrus (B).
Diagnosis
Compared to rMDDs, HCs exhibited greater LVSs connectivity to the putamen (R), amygdala (R), and inferior frontal gyrus (R).
Right Ventral Striatum – Superior (RVSs)
Table 3 reports regions of connectivity from the RVSs seed in relation to BIS/BAS scales and diagnosis.
Affective Traits
RVSs connectivity to the inferior frontal gyrus (R), ACC (R), frontal inferior operculum/precentral gyrus (R), lingual gyrus (L), supramarginal gyrus (L), superior temporal gyrus (B), and insula (L) was negatively correlated with BIS. RVSs connectivity to the ACC (B), pons (R), and pulvinar (R) was positively correlated with BAS-RR. BAS-D was positively correlated with RVSs connectivity to the DLPFC (L), middle frontal gyrus (L), and precuneus (R). BAS-D was negatively correlated with RVSs connectivity to the right superior temporal gyrus and insula.
Diagnosis
HCs had greater connectivity than rMDDs from RVSs to, the parahippocampal gyrus (B), lentiform nucleus (B), amygdala (B), and inferior and superior temporal gyri (R). HCs showed less connectivity than rMDDs from RVSs to the right superior frontal gyrus and left lingual gyrus.
For all four seeds, effects relating to sex differences and number of depressive episodes are presented in Supplemental Table 1 and the Supplemental Results section.
Discussion
The present study investigated affective personality correlates of reward network connectivity and differences in reward network connectivity between rMDD and healthy individuals. BAS-RR was positively correlated with connectivity between the VSi and bilateral posterior visual and dorsal somatosensory regions, areas primarily involved in perception of (Zeki et al., 1991) and response to (Nii et al., 1996) the environment. These results indirectly corroborate previous findings that striatal dopamine facilitates sensory-motor interaction and responsivity to stimuli (Salamone, 1992). In rMDD individuals, VSi connectivity might confer higher trait reward-responsiveness, enabling more intact reward responding. With the exception of connectivity observed between the LVSi and mid/posterior cingulate, our findings mostly contrasted previous research suggesting that the VSi is highly connected with emotional processing regions (Di Martino et al., 2008). This difference could be due to our examination of VSi connectivity specifically in relation to BAS-RR.
Decreased integration of the VSi, visual cortex, and somatomotor regions may be related to lower reward-responsiveness and poorer performance on reward tasks. Lack of VSi-visual-somatomotor integration could lessen an individual's interest or willingness to interact with the environment, resulting in lower reward-responsiveness, decreased performance on reward-seeking tasks (e.g. less money earned; DelDonno et al., 2015), and worse depressive symptoms. VSi-visual-somatomotor connectivity may deteriorate over the course of illness and could partially explain why depressed individuals have significantly lower BAS-RR scores (DelDonno et al., 2015) than early-course rMDD individuals. It is possible that VSi-visual-somatomotor network connectivity could predict MDD diagnosis, illness severity, or likelihood of relapse, just as BAS scores are able to do (Kasch et al., 2002; Shankman & Klein, 2003; McFarland et al., 2006). For example, disease status in a sample of individuals with and without MDD was predicted at 95% accuracy using the VSi and 14 other MDD-relevant ROIs extracted from rsFC data (Craddock et al., 2009). Furthermore, although BAS-RR scores did not differ between rMDD individuals and HCs in the present study, the clinically relevant predictive power of BAS scores (Kasch et al., 2002; McFarland et al., 2006) suggests that these traits are vulnerability factors for MDD course and that the present rsFC results perhaps reflect a mechanism of this effect.
Additionally, we found that BAS-D was related to connectivity from the VSs to the precuneus and precentral regions. BAS-D has been associated with behavior that maximizes the likelihood and amount of reward (Scheres & Sanfey, 2006) and with brain activation to pictures of appetizing food (Beaver et al., 2006). These associations demonstrate that trait drive is important for pursuing and “wanting” reward, which are frequently disrupted in depression (Treadway & Zald, 2011). The VS, although not VSs specifically, has been extensively linked to drive and motivation (e.g. Nestler & Carlezon, 2006;). Previous research suggests that the VSi/NAcc is not required for goal-directed behavior or sensitivity to response-contingent rewards (Cardinal et al., 2002). Instead, the VSs, not often differentiated from VSi in the literature, may be responsible for goal-directed behavior and motivation. This potential VSs function may be why BAS-D related to VSs but not VSi connectivity, and may also explain a directional link to more frontal regions. The VSs may interact with the precuneus, which is important for self-referential processes such as the experience of agency (Cavanna & Trimble), to evaluate or generate desires. Then, desires may be translated into action via connections between the VSs and precentral gyrus, which is responsible for motor performance (Porro et al., 1996) such as pressing a response button during a task.
BIS negatively correlated with connectivity between the LVSs and dorsal ACC (dACC), a region that integrates negative affect and cognitive control (Shackman et al., 2011). Connectivity between the VSs and dACC may be part of the neural basis of behavioral inhibition and negative affectivity, especially in those with rMDD. Having less connectivity between reward and salience regions may help individuals suppress negative affect. Voluntary inhibition of negative affect has previously been associated with the activation of the dACC and the ventrolateral PFC (BA 44) and the deactivation of the NAcc (Phan et al., 2005). Our observation that decreasing connectivity from the VS to the dACC and BA 44 correlated with trait BIS suggests that less VSs-SEN connectivity may contribute to reduced distress sensitivity, fear, and anxious arousal (McNaughton & Gray, 2000).
Although groups did not differ in VSs-DMN connectivity, the VSs was hyperconnected to such SEN regions as the amygdala, putamen, and parahippocampal gyrus in HCs compared to individuals with rMDD. Although this finding ran contrary to our hypothesis, a recent meta-analysis noted that there is mixed evidence as to whether individuals with MDD exhibit greater or less connectivity from the SEN to other regions (Kaiser et al., 2015). Kaiser and colleagues suggested that connectivity between salience, attention, and emotion processing regions might be modulated by the presence of external cues that correspond with internal mentation (2015). In late-life depression, decreased rsFC was observed between the VSi and amygdala, caudate, putamen, globus pallidus, and thalamus (Alexopolous et al., 2013), a pattern of results that mirrors the present group-level VSs-SEN findings with the caveat that Alexopolous and colleagues seeded from the VSi. Somewhat consistent with our findings, a previous study found that VSs activity in HCs was correlated with the superior and lateral OFC, regions in the SEN (Di Martino et al., 2008). Although we observed hyperconnectivity between the VSs and SEN in HCs relative to individuals with rMDD, the OFC was not included. Lack of VSs connectivity to the OFC could be due to our inclusion of rMDD individuals in the sample as opposed to an entirely healthy sample. Additionally, our results contrast previous reports that VSs activity predicts activation in executive function regions such as the DLPFC (Di Martino et al., 2008). Overall, this collection of mixed findings highlights the need to further clarify the role of the SEN in MDD.
We observed a few regions of overlap where HCs showed greater connectivity between the VSs and SEN than in individuals with rMDD and where the BIS related to decreasing connectivity between the RVSs and SEN (Figure 3, Panel D). This overlap could represent a neural resistance against negative affect via greater connectivity between the VSs and SEN. Put another way, it is possible that the degradation of VSs-SEN connectivity could represent a vulnerability or scar from illness. A version of the scar hypothesis of depression (Lewinsohn, 1981) has been put forth that suggests scars develop proportionally before and after MDD episodes as a result of subthreshold or residual symptoms (Wichers et al., 2013). Whereas repetitive scar effects would be minimal because participants with rMDD were recruited early in their course of illness and had experienced only a few episodes, subthreshold symptoms, high trait negative affect, or neural vulnerability could account for rsFC differences compared to HCs.
There are several limitations of the present study. First, the study involved scanning at two sites. Although the presence of significant effects across sites indicate generalizability to multiple geographical regions and scanners, a number of site-specific effects emerged (Supplemental Figure 2) because the scanning protocols were not prospectively synchronized, contributing additional error and measurement variance. On the other hand, this renders effects across sites more conservative. Second, although each regression was corrected for whole-brain significance and FWE was reduced with cluster extent thresholding (Cox et al., 2016; Eklund et al., 2016), there is still a possibility that performing 16 group-level analyses may have resulted in false positives. Third, we did not find a difference in BIS/BAS scores between groups, weakening the argument that is evident within the literature that these would be trait risk factors for MDD. The high-functioning nature of our sample (young adults in remitted state with above-average IQs) may have obscured trait differences. As such, we utilized the RDoC dimensional framework in addition to group differences to better understand both disease and individual difference features related to VS connectivity.
Future research could examine associations between VS networks and performance-based measures of reward responsiveness, such as a monetary incentive delay task. Additionally, examining changes in VS connectivity over time in relation to affective personality traits and reward task performance could help disentangle whether these phenomena are reliable and state- or trait-like. Continuing to distinguish between the VSs and VSi might further elucidate functional specificity of the two halves of the VS. Differences in their functions could also illuminate mechanisms of and targets for existing or future treatments.
Overall, the present findings suggest that VSs and VSi networks are related to affective personality traits that have previously been demonstrated to differentiate disease status (DelDonno et al., 2015) and predict MDD risk (Kasch et al., 2002). Previously, response to rewarding stimuli has been linked to BAS-RR (Kasch et al., 2002) and VSi activation in active MDD (Epstein et al., 2006). In this study, we found a relationship between BAS-RR and the VSi across rMDD and HC groups. In contrast, group differences emerged from VSs connectivity to subcortical SEN regions. Together these findings suggest that VSi functioning may be relevant to reward deficits in active MDD whereas decreased VSs-SEN connectivity may be a marker of remission. VS connectivity may constitute an intermediate phenotype of MDD, perhaps underlying risk for onset or relapse. These neural networks may represent reliable markers that could fit within the positive valence system of the NIMH Research Domain Criteria matrix. In sum, history of MDD, BIS, and BAS-RR each contribute specific and meaningful information about how VS connectivity and other networks may relate to MDD risk or expression.
Supplemental Results
Sex Differences
Several sex differences emerged across seeds (Supplemental Table 1). Females showed greater LVSi connectivity to the inferior frontal (L), middle frontal (R), and postcentral gyri (B) but less connectivity from LVSi to the middle frontal gyrus (L), middle occipital gyrus (L), and precuneus (L) than males. Females showed greater connectivity from RVSi than males to several right subcortical regions, including the uvula, caudate, lentiform nucleus, and insula.
Females had less LVSs connectivity than males to the inferior frontal (L), middle occipital (B), middle temporal (R), and superior temporal (R) gyri. Females had greater connectivity than males from RVSs to the left uncus.
Single vs. Multiple Depressive Episodes
Compared to individuals with more than one previous depressive episode, those with a single previous depressive episode had higher connectivity between the RVSs and the left lingual gyrus, which was negatively correlated with BIS, F(1, 38) = 4.44, p < .05. No other regions of connectivity or connectivity correlations with the BIS/BAS scales were related to number of episodes.
Supplementary Material
Supplemental Figure 1. Framewise displacement in each group. Histograms display the distribution of framewise displacement values in the HC and rMDD groups separately.
Supplemental Figure 2. Post-hoc analyses of effects related to BIS, BAS-RR, and BAS-D, illustrated by site and diagnosis. For all four seeds, z values were extracted from each cluster related to BIS, BAS-RR, and BAS-D and then plotted by diagnostic group and site. Panel A shows clusters seeded from the VSs and Panel B shows clusters seeded from the VSi. Bars represent standard error.
Highlights.
History of depression related to altered ventral striatum connectivity.
Trait positive and negative affect related to connectivity.
Superior and inferior ventral striatum showed different connectivity patterns.
Acknowledgments
None.
Funding: This work was supported by the National Institute of Mental Health (T32MH067631, SRD; R01 MH091811, SAL).
Footnotes
Author Disclosures: The authors have no financial conflicts of interest to disclose.
Contributors: All authors have approved the final manuscript.
Sophie DelDonno: Literature search, selection of statistical tests/analyses, performing statistical analyses, interpretation of statistical analyses, all aspects of manuscript writing
Lisanne Jenkins: Selection of statistical analyses and performing analyses and data processing, Natania Crane: Refining research idea, selection of statistical analyses
Robin Nusslock: Manuscript editing, conceptualizing research idea, Kelly Ryan: Conceptualizing research idea, creating research design, selecting instruments/measures
Stewart A. Shankman: Manuscript editing, conceptualizing research idea
K. Luan Phan: Manuscript editing, conceptualizing research idea
Scott A. Langenecker: Conceptualizing research idea, creating research design, selecting instruments/measures, interpretation of statistical analyses, manuscript writing
Conflicts of interest: None.
Publisher's Disclaimer: This is a PDF file of an unedited manuscript that has been accepted for publication. As a service to our customers we are providing this early version of the manuscript. The manuscript will undergo copyediting, typesetting, and review of the resulting proof before it is published in its final citable form. Please note that during the production process errors may be discovered which could affect the content, and all legal disclaimers that apply to the journal pertain.
References
- Admon R, Holsen LM, Aizley H, Remington A, Whitfield-Gabrieli S, Goldstein JM, Pizzagalli DA. Striatal hypersensitivity during stress in remitted individuals with recurrent depression. Biological Psychiatry. 2015;78:67–76. doi: 10.1016/j.biopsych.2014.09.019. [DOI] [PMC free article] [PubMed] [Google Scholar]
- Alexopoulos GS, Hoptman MJ, Yuen G, Kanellopoulos D, Seirup JK, Lim KO, Gunning FM. Functional connectivity in apathy of late-life depression: a preliminary study. Journal of Affective Disorders. 2013;149:398–405. doi: 10.1016/j.jad.2012.11.023. [DOI] [PMC free article] [PubMed] [Google Scholar]
- Beaver JD, Lawrence AD, van Ditzhuijzen J, Davis MH, Woods A, Calder AJ. Individual differences in reward drive predict neural responses to images of food. The Journal of Neuroscience. 2006;26:5160–5166. doi: 10.1523/JNEUROSCI.0350-06.2006. [DOI] [PMC free article] [PubMed] [Google Scholar]
- Behzadi Y, Restom K, Liau J, Liu TT. A component based noise correction method (CompCor) for BOLD and perfusion based fMRI. Neuroimage. 2007;37:90–101. doi: 10.1016/j.neuroimage.2007.04.042. [DOI] [PMC free article] [PubMed] [Google Scholar]
- Bhaumik R, Jenkins LM, Gowins JR, Jacobs RH, Barba A, Bhaumik DK, Langenecker SA. Multivariate pattern analysis strategies in detection of remitted major depressive disorder using resting state functional connectivity. NeuroImage: Clinical. 2016 doi: 10.1016/j.nicl.2016.02.018. [DOI] [PMC free article] [PubMed] [Google Scholar]
- Brett M, Anton JL, Valabregue R, Poline JB. Region of interest analysis using the MarsBar toolbox for SPM 99. Neuroimage. 2002;16:S497. [Google Scholar]
- Cardinal RN, Parkinson JA, Hall J, Everitt BJ. Emotion and motivation: the role of the amygdala, ventral striatum, and prefrontal cortex. Neuroscience & Biobehavioral Reviews. 2002;26:321–352. doi: 10.1016/s0149-7634(02)00007-6. [DOI] [PubMed] [Google Scholar]
- Carver CS, White TL. Behavioral inhibition, behavioral activation, and affective responses to impending reward and punishment: The BIS/BAS scales. Journal of Personality and Social Psychology. 1994;67:319–333. [Google Scholar]
- Cavanna AE, Trimble MR. The precuneus: a review of its functional anatomy and behavioural correlates. Brain. 2006;129:564–583. doi: 10.1093/brain/awl004. [DOI] [PubMed] [Google Scholar]
- Craddock RC, Holtzheimer PE, Hu XP, Mayberg HS. Disease state prediction from resting state functional connectivity. Magnetic Resonance in Medicine. 2009;62:1619–1628. doi: 10.1002/mrm.22159. [DOI] [PMC free article] [PubMed] [Google Scholar]
- Cox RW, Reynolds RC, Taylor PA. AFNI and clustering: false positive rates redux. bioRxiv. 2016:065862. doi: 10.1089/brain.2016.0475. [DOI] [PMC free article] [PubMed] [Google Scholar]
- DelDonno SR, Weldon AL, Crane NA, Passarotti AM, Pruitt PJ, Gabriel LB, et al. Langenecker SA. Affective personality predictors of disrupted reward learning and pursuit in major depressive disorder. Psychiatry Research. 2015;230:56–64. doi: 10.1016/j.psychres.2015.08.011. [DOI] [PMC free article] [PubMed] [Google Scholar]
- Di Martino A, Scheres A, Margulies DS, Kelly AMC, Uddin LQ, Shehzad Z, et al. Milham MP. Functional connectivity of human striatum: a resting state FMRI study. Cerebral Cortex. 2008;18:2735–2747. doi: 10.1093/cercor/bhn041. [DOI] [PubMed] [Google Scholar]
- Dichter GS, Kozink RV, McClernon FJ, Smoski MJ. Remitted major depression is characterized by reward network hyperactivation during reward anticipation and hypoactivation during reward outcomes. Journal of Affective Disorders. 2012;136:1126–1134. doi: 10.1016/j.jad.2011.09.048. [DOI] [PMC free article] [PubMed] [Google Scholar]
- Eklund A, Nichols TE, Knutsson H. Cluster failure: why fMRI inferences for spatialextent have inflated false-positive rates. Proceedings of the National Academy of Sciences. 2016:201602413. doi: 10.1073/pnas.1602413113. [DOI] [PMC free article] [PubMed] [Google Scholar]
- Epstein J, Pan H, Kocsis JH, Yang Y, Butler T, Chusid J, et al. Silbersweig DA. Lack of ventral striatal response to positive stimuli in depressed versus normal subjects. American Journal of Psychiatry. 2006 doi: 10.1176/ajp.2006.163.10.1784. [DOI] [PubMed] [Google Scholar]
- Fox MD, Snyder AZ, Vincent JL, Corbetta M, Van Essen DC, Raichle ME. The human brain is intrinsically organized into dynamic, anticorrelated functional networks. Proceedings of the National Academy of Sciences of the United States of America. 2005;102:9673–9678. doi: 10.1073/pnas.0504136102. [DOI] [PMC free article] [PubMed] [Google Scholar]
- Hamilton M. The assessment of anxiety states by rating. British Journal of Medical Psychology. 1959;32:50–55. doi: 10.1111/j.2044-8341.1959.tb00467.x. [DOI] [PubMed] [Google Scholar]
- Hamilton M. A rating scale for depression. Journal of Neurology, Neurosurgery & Psychiatry. 1960;23:56–62. doi: 10.1136/jnnp.23.1.56. [DOI] [PMC free article] [PubMed] [Google Scholar]
- Jacobs RH, Jenkins LM, Gabriel LB, Barba A, Ryan KA, Weisenbach SL, et al. Welsh RC. Increased coupling of intrinsic networks in remitted depressed youth predicts rumination and cognitive control. PLOS ONE. 2014;9:1–11. doi: 10.1371/journal.pone.0104366. [DOI] [PMC free article] [PubMed] [Google Scholar]
- Jenkins LM, Kassel MT, Gabriel LB, Gowins JR, Hymen EA, Vergés A, et al. Welsh RC. Amygdala and dorsomedial hyperactivity to emotional faces in youth with remitted Major Depression. Social Cognitive and Affective Neuroscience. 2015;152 doi: 10.1093/scan/nsv152. [DOI] [PMC free article] [PubMed] [Google Scholar]
- Jo HJ, Gotts SJ, Reynolds RC, Bandettini PA, Martin A, Cox RW, Saad ZS. Effective preprocessing procedures virtually eliminate distance-dependent motion artifacts in resting state FMRI. Journal of Applied Mathematics. 2013;2013:1–9. doi: 10.1155/2013/935154. [DOI] [PMC free article] [PubMed] [Google Scholar]
- Kasch KL, Rottenberg J, Arnow BA, Gotlib IH. Behavioral activation and inhibition systems and the severity and course of depression. Journal of Abnormal Psychology. 2002;111:589–597. doi: 10.1037//0021-843x.111.4.589. [DOI] [PubMed] [Google Scholar]
- Kaiser RH, Andrews-Hanna JR, Wager TD, Pizzagalli DA. Large-scale network dysfunction in major depressive disorder: a meta-analysis of resting-state functional connectivity. JAMA Psychiatry. 2015;72:603–611. doi: 10.1001/jamapsychiatry.2015.0071. [DOI] [PMC free article] [PubMed] [Google Scholar]
- Lewinsohn PM, Steinmetz JL, Larson DW, Franklin J. Depression-related cognitions: Antecedent or consequence? Journal of Abnormal Psychology. 1981;90:213. doi: 10.1037//0021-843x.90.3.213. [DOI] [PubMed] [Google Scholar]
- McFarland BR, Shankman SA, Tenke CE, Bruder GE, Klein DN. Behavioral activation system deficits predict the six-month course of depression. Journal of Affective Disorders. 2006;91:229–234. doi: 10.1016/j.jad.2006.01.012. [DOI] [PubMed] [Google Scholar]
- McNaughton N, Gray JA. Anxiolytic action on the behavioural inhibition system implies multiple types of arousal contribute to anxiety. Journal of Affective Disorders. 2000;61:161–176. doi: 10.1016/s0165-0327(00)00344-x. [DOI] [PubMed] [Google Scholar]
- Morgan JK, Shaw DS, Olino TM, Musselman SC, Kurapati NT, Forbes EE. History of depression and frontostriatal connectivity during reward processing in late adolescent boys. Journal of Clinical Child & Adolescent Psychology. 2015;45:59–68. doi: 10.1080/15374416.2015.1030753. [DOI] [PMC free article] [PubMed] [Google Scholar]
- Nestler EJ, Carlezon WA. The mesolimbic dopamine reward circuit in depression. Biological Psychiatry. 2006;59:1151–1159. doi: 10.1016/j.biopsych.2005.09.018. [DOI] [PubMed] [Google Scholar]
- Nii Y, Uematsu S, Lesser RP, Gordon B. Does the central sulcus divide motor and sensory functions Cortical mapping of human hand areas as revealed by electrical stimulation through subdural grid electrodes. Neurology. 1996;46:360–367. doi: 10.1212/wnl.46.2.360. [DOI] [PubMed] [Google Scholar]
- Nurnberger JI, Jr, Blehar MC, Kaufmann CA, York-Cooler C, Simpson SG, Harkavy-Friedman J, Severe JB, Malaspina D, Reich T. Diagnostic interview for genetic studies. Rationale, unique features, and training. NIMH Genetics Initiative Arch Gen Psychiatry. 1994;51:849–859. doi: 10.1001/archpsyc.1994.03950110009002. [DOI] [PubMed] [Google Scholar]
- Pechtel P, Dutra SJ, Goetz EL, Pizzagalli DA. Blunted reward responsiveness in remitted depression. Journal of Psychiatric Research. 2013;47:1864–1869. doi: 10.1016/j.jpsychires.2013.08.011. [DOI] [PMC free article] [PubMed] [Google Scholar]
- Phan KL, Fitzgerald DA, Nathan PJ, Moore GJ, Uhde TW, Tancer ME. Neural substrates for voluntary suppression of negative affect: a functional magnetic resonance imaging study. Biological Psychiatry. 2005;57:210–219. doi: 10.1016/j.biopsych.2004.10.030. [DOI] [PubMed] [Google Scholar]
- Pizzagalli D, Holmes A, Dillon D, Goetz E, Birk J, Bogdan R, et al. Fava M. Reduced caudate and nucleus accumbens response to rewards in unmedicated individuals with major depressive disorder. American Journal of Psychiatry. 2009;166:702–710. doi: 10.1176/appi.ajp.2008.08081201. [DOI] [PMC free article] [PubMed] [Google Scholar]
- Pizzagalli DA, Iosifescu D, Hallett LA, Ratner KG, Fava M. Reduced hedonic capacity in major depressive disorder: evidence from a probabilistic reward task. Journal of psychiatric research. 2008;43:76–87. doi: 10.1016/j.jpsychires.2008.03.001. [DOI] [PMC free article] [PubMed] [Google Scholar]
- Porro CA, Francescato MP, Cettolo V, Diamond ME, Baraldi P, Zuiani C, et al. Di Prampero PE. Primary motor and sensory cortex activation during motor performance and motor imagery: a functional magnetic resonance imaging study. The Journal of Neuroscience. 1996;16:7688–7698. doi: 10.1523/JNEUROSCI.16-23-07688.1996. [DOI] [PMC free article] [PubMed] [Google Scholar]
- Power JD, Barnes KA, Snyder AZ, Schlaggar BL, Petersen SE. Spurious but systematic correlations in functional connectivity MRI networks arise from subject motion. Neuroimage. 2012;59(3):2142–2154. doi: 10.1016/j.neuroimage.2011.10.018. [DOI] [PMC free article] [PubMed] [Google Scholar]
- Salamone JD. Complex motor and sensorimotor functions of striatal and accumbens dopamine: involvement in instrumental behavior processes. Psychopharmacology. 1992;107:160–174. doi: 10.1007/BF02245133. [DOI] [PubMed] [Google Scholar]
- Scheres A, Sanfey AG. Individual differences in decision making: Drive and reward responsiveness affect strategic bargaining in economic games. Behavioral and Brain Functions. 2006;2:1. doi: 10.1186/1744-9081-2-35. [DOI] [PMC free article] [PubMed] [Google Scholar]
- Seeley WW, Menon V, Schatzberg AF, Keller J, Glover GH, Kenna H, et al. Greicius MD. Dissociable intrinsic connectivity networks for salience processing and executive control. The Journal of Neuroscience. 2007;27:2349–2356. doi: 10.1523/JNEUROSCI.5587-06.2007. [DOI] [PMC free article] [PubMed] [Google Scholar]
- Shackman AJ, Salomons TV, Slagter HA, Fox AS, Winter JJ, Davidson RJ. The integration of negative affect, pain and cognitive control in the cingulate cortex. Nature Reviews Neuroscience. 2011;12:154–167. doi: 10.1038/nrn2994. [DOI] [PMC free article] [PubMed] [Google Scholar]
- Shankman SA, Klein DN. The relation between depression and anxiety: an evaluation of the tripartite, approach-withdrawal and valence-arousal models. Clinical Psychology Review. 2003;23:605–637. doi: 10.1016/s0272-7358(03)00038-2. [DOI] [PubMed] [Google Scholar]
- Sheline YI, Price JL, Yan Z, Mintun MA. Resting-state functional MRI in depression unmasks increased connectivity between networks via the dorsal nexus. Proceedings of the National Academy of Sciences. 2010;107:11020–11025. doi: 10.1073/pnas.1000446107. [DOI] [PMC free article] [PubMed] [Google Scholar]
- Shipley WC, Gruber CP, Martin TA, Klein AM. Shipley-2 Western Psychological Services. Los Angeles, CA: 2009. [Google Scholar]
- Smoski MJ, Felder J, Bizzell J, Green SR, Ernst M, Lynch TR, Dichter GS. fMRI of alterations in reward selection, anticipation, and feedback in major depressive disorder. Journal of affective disorders. 2009;118:69–78. doi: 10.1016/j.jad.2009.01.034. [DOI] [PMC free article] [PubMed] [Google Scholar]
- Taubitz LE, Pedersen WS, Larson CL. BAS reward responsiveness: A unique predictor of positive psychological functioning. Personality and Individual Differences. 2015;80:107–112. doi: 10.1016/j.paid.2015.02.029. [DOI] [PMC free article] [PubMed] [Google Scholar]
- Treadway MT, Zald DH. Reconsidering anhedonia in depression: lessons from translational neuroscience. Neuroscience & Biobehavioral Reviews. 2011;35:537–555. doi: 10.1016/j.neubiorev.2010.06.006. [DOI] [PMC free article] [PubMed] [Google Scholar]
- Wang L, Hermens DF, Hickie IB, Lagopoulos J. A systematic review of resting-state functional-MRI studies in major depression. Journal of affective disorders. 2012;142:6–12. doi: 10.1016/j.jad.2012.04.013. [DOI] [PubMed] [Google Scholar]
- Whitton AE, Kakani P, Foti D, Van't Veer A, Haile A, Crowley DJ, Pizzagalli DA. Blunted neural responses to reward in remitted major depression: a high-density event-related potential study. Biological Psychiatry: Cognitive Neuroscience and Neuroimaging. 2016;1:87–95. doi: 10.1016/j.bpsc.2015.09.007. [DOI] [PMC free article] [PubMed] [Google Scholar]
- Wichers M, Geschwind N, van Os J, Peeters F. Scars in depression: is a conceptual shift necessary to solve the puzzle? Psychological Medicine. 2010;40:359–365. doi: 10.1017/s0033291709990420. [DOI] [PubMed] [Google Scholar]
- Yeo BT, Krienen FM, Sepulcre J, Sabuncu MR, Lashkari D, Hollinshead M, et al. Fischl B. The organization of the human cerebral cortex estimated by intrinsic functional connectivity. Journal of neurophysiology. 2011;106:1125–1165. doi: 10.1152/jn.00338.2011. [DOI] [PMC free article] [PubMed] [Google Scholar]
- Zeki S, Watson JD, Lueck CJ, Friston KJ, Kennard C, Frackowiak RS. A direct demonstration of functional specialization in human visual cortex. The Journal of Neuroscience. 1991;11:641–649. doi: 10.1523/JNEUROSCI.11-03-00641.1991. [DOI] [PMC free article] [PubMed] [Google Scholar]
Associated Data
This section collects any data citations, data availability statements, or supplementary materials included in this article.
Supplementary Materials
Supplemental Figure 1. Framewise displacement in each group. Histograms display the distribution of framewise displacement values in the HC and rMDD groups separately.
Supplemental Figure 2. Post-hoc analyses of effects related to BIS, BAS-RR, and BAS-D, illustrated by site and diagnosis. For all four seeds, z values were extracted from each cluster related to BIS, BAS-RR, and BAS-D and then plotted by diagnostic group and site. Panel A shows clusters seeded from the VSs and Panel B shows clusters seeded from the VSi. Bars represent standard error.