Abstract
Purpose
[18F]Sodium fluoride (NaF) positron emission tomography (PET)/computed tomography (CT) is a promising radiotracer for quantitative assessment of bone metastases. This study assesses changes in early NaF PET/CT response measures in metastatic prostate cancer for correlation to clinical outcomes.
Patients and Methods
Fifty-six patients with metastatic castration-resistant prostate cancer (mCRPC) with osseous metastases had NaF PET/CT scans performed at baseline and after three cycles of chemotherapy (n = 16) or androgen receptor pathway inhibitors (n = 40). A novel technology, Quantitative Total Bone Imaging, was used for analysis. Global imaging metrics, including maximum standardized uptake value (SUVmax) and total functional burden (SUVtotal), were extracted from composite lesion–level statistics for each patient and tracked throughout treatment. Progression-free survival (PFS) was calculated as a composite end point of progressive events using conventional imaging and/or physician discretion of clinical benefit; NaF imaging was not used for clinical evaluation. Cox proportional hazards regression analyses were conducted between imaging metrics and PFS.
Results
Functional burden (SUVtotal) assessed midtreatment was the strongest univariable PFS predictor (hazard ratio, 1.97; 95% CI, 1.44 to 2.71; P < .001). Classification of patients based on changes in functional burden showed stronger correlation to PFS than did the change in number of lesions. Various global imaging metrics outperformed baseline clinical markers in predicting outcome, including SUVtotal and SUVmean. No differences in imaging response or PFS correlates were found for different treatment cohorts.
Conclusion
Quantitative total bone imaging enables comprehensive disease quantification on NaF PET/CT imaging, showing strong correlation to clinical outcomes. Total functional burden assessed after three cycles of hormonal therapy or chemotherapy was predictive of PFS for men with mCRPC. This supports ongoing development of NaF PET/CT–based imaging biomarkers in mCRPC to bone.
INTRODUCTION
Currently, there is no established tool to reliably and quantitatively measure changes in bone metastases in response to therapy.1 Post-treatment serum prostate-specific antigen (PSA) alterations have historically been used to monitor patients with prostate cancer; however, PSA does not provide any spatial context to treatment response.
Planar 99mTc-methylene disphosphonate bone scintigraphy used clinically to assess osteoblastic metastases is limited to semiquantitative response assessment based on counting and confirming lesions during treatment.2 This method benefits from a standardized definition of radiographic progression (ie, new lesions), which is associated with overall survival in specific contexts in metastatic castration-resistant prostate cancer (mCRPC).3 However, it does not assess post-treatment changes in existing lesions or changes in overall disease burden.4 Limitations in bone imaging and lack of reliable methods for quantitatively assessing disease result in prostate cancer trials focusing on time-to-event end points such as overall survival and radiographic progression-free survival (PFS) rather than response to therapy.
With rapid bone uptake and blood clearance, [18F]sodium fluoride(NaF) positron emission tomography (PET)/computed tomography (CT) has ideal characteristics for imaging osteoblastic activity.5,6 Multiple studies have evaluated the diagnostic utility of NaF PET/CT, reporting higher specificity and sensitivity in detecting skeletal metastases compared with 99mTc-methylene disphosphonate bone scan and planar single-photon emission CT imaging.7-10 Additionally, NaF PET/CT has demonstrated potential for quantitatively evaluating metastatic bone disease, in terms of both quantitative accuracy11,12 and efficacy in monitoring functional changes throughout treatment.13,14
Recently, the clinical utility of quantitative NaF PET/CT response assessment was explored. The number of lesions and corresponding uptake on NaF PET/CT scans at 6 and 12 months of treatment were associated with overall survival.15 In a small cohort of patients receiving dasatinib, changes in NaF PET/CT uptake showed modest correlation with PFS at 12 weeks.14 However, quantitative changes were only assessed in five bone metastases, an undersampling of the total burden of bony disease.
Clinical use of NaF PET/CT often lacks the ability to quantitatively measure full disease dynamics because of high lesion numbers in metastatic settings. This study uses novel semiautomatic extraction of various imaging measures, allowing for quantitative assessment of total disease burden throughout treatment. The primary objective of this multicenter trial was to determine the repeatability of NaF PET/CT imaging for evaluating osseous metastases in patients with mCRPC to bone.12 Here we report the secondary objectives: evaluation and correlation of changes on NaF PET/CT in response to docetaxel-based chemotherapy or androgen receptor (AR) signaling pathway inhibitors with clinical outcomes.
PATIENTS AND METHODS
Patient Population
This prospective, two-arm, multi-institutional study enrolled 58 patients from February 2012 to September 2014 at the University of Wisconsin Carbone Cancer Center, Memorial Sloan Kettering Cancer Center, and National Cancer Institute. Before enrollment, patients needed to demonstrate histologically proven adenocarcinoma of the prostate with osseous metastases. Exclusion criteria included concurrent treatment with any other agent for prostate cancer, palliative radiotherapy within 4 weeks of registration, or any prior radioisotope treatment. Patients were treated according to different protocols or standard-of-care per local practice. All patients received either a docetaxel-based chemotherapy regimen (cohort A) or AR-directed inhibitor treatment (cohort B), throughout which they were evaluated with up to three NaF PET/CT scans.
Baseline [18F]NaF PET/CT whole-body scans were performed within 7 days before treatment initiation. A second pretreatment (test-retest) scan was performed 1 to 4 days after the first. Midtreatment imaging was performed after three treatment cycles, 8 weeks (cohort A) or 12 weeks (cohort B). Patients receiving AR-directed therapy additionally received an early NaF PET/CT scan at 6 weeks to assess flare response.
PSA was collected at the onset of each drug cycle, and standard-of-care imaging was collected. PSA change (∆PSA) was recorded as the percentage of decrease from baseline throughout the first three cycles of treatment. The primary study was designed to assess repeatability of NaF PET/CT, with a planned sample size of 60 patients (20 patients per site).12 The protocol was approved by the corresponding institutional review board and radiation safety committee of each institution. All patients provided written informed consent to participate.
Imaging Acquisition
Patients received bolus intravenous injection of [18F]NaF 111 to 185 MBq (3 to 5 mCi) and underwent imaging 60 minutes postinjection. Scans at the University of Wisconsin Carbone Cancer Center and Memorial Sloan Kettering Cancer Center were acquired on the Discovery VCT (GE Healthcare, Waukesha, WI) PET/CT scanner, and scans at the National Cancer Institute were acquired on the Gemini (Philips Healthcare, Amsterdam, the Netherlands) PET/CT scanner. The acquisition time for whole-body scans was 3 minutes per bed position.
Low-dose CT scans were acquired for attenuation correction. Quantitative harmonization of scanner systems was achieved by applying reconstruction parameters that provided similar image quality, as described previously.12 This resulted in unique reconstruction sets for the Gemini (three iterations; 33 subsets; voxel size, 4 × 4 × 4 mm3) and Discovery VCT scanners (two iterations; 14 subsets; voxel size, 2.73 × 2.73 × 3.27 mm3).
Image Analysis
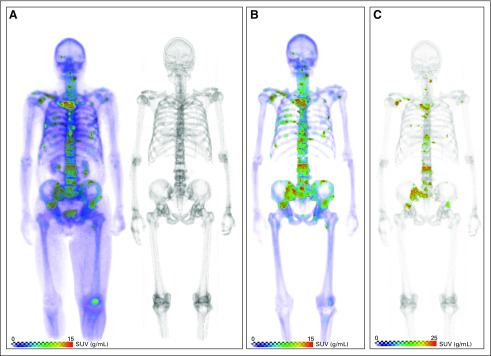
Quantitative Total Bone Imaging (QTBI) was used for NaF PET/CT analysis (Fig 1). Metastatic lesions were segmented from PET uptake, assisted with an anatomic CT mask to exclude soft tissue uptake followed by a threshold of standardized uptake value (SUV) greater than 15 g/mL.12 Lesion contours were verified by an experienced nuclear medicine physician to confirm all benign uptake was excluded. After segmentation of the individual-lesion region of interest (ROI), SUV metrics were extracted considering all voxels in an ROI, including maximum uptake (SUVmax), mean uptake (SUVmean; mean SUV in ROI), and total uptake (SUVtotal; summed SUV in ROI normalized to voxel volume). Next, patient-level SUVmax was defined as maximum uptake value of all individual-lesion SUVmax values, SUVmean as the average of all individual-level SUVmean values, and SUVtotal as the sum of all individual-level SUVtotal values. For each SUV metric, response was calculated as percent change from baseline to midtreatment scans. SUV metrics from each time point and response between time points were reported.
Fig 1.
Semiautomatic quantitative assessment of sodium fluoride (NaF) positron emission tomography (PET)/computed tomography (CT) imaging. For each scan, piecewise skeletal registration allowed for localization of osseous uptake. Individual lesions were identified (standardized uptake value [SUV] > 15 g/mL), and nonmalignant uptake was removed before extraction of global metrics. (A) [18F]NaF PET (left)/CT (right) acquisition. (B) Isolation of skeletal uptake. (C) Segmentation and uptake quantification.
Outcome Measures
Within this imaging protocol, formal response and progression criteria were not defined, because patients were treated according to either a therapeutic clinical trial protocol or standard clinical practice. Therefore, there were no mandated standard imaging studies or fixed schedules of standard-of-care imaging. NaF PET/CT imaging was collected for research purposes and was not used to guide treatment decisions. Investigator-reported clinical and radiographic progression were captured when available, but for the purposes of this analysis, a composite end point of PFS was used for correlation with NaF PET/CT measures.
Radiographic imaging (CT chest/abdomen/pelvis and bone scan) and PSA assessments were obtained per therapeutic study protocol or standard of care. Confirmatory CT scans were obtained 4 to 6 weeks after initial documentation of objective response whenever possible. For patients with progression of disease on the first reassessment bone scan, a minimum of two new lesions had to be observed, with confirmatory bone scan ≥ 6 weeks later showing additional new lesions.
Progression included events relating to ∆PSA, clinical symptoms, and/or physician discretion. ∆PSA was recorded per PSA Working Group Criteria.16 PSA progression was confirmed by a second value at least 3 weeks later whenever possible.2
PFS was defined as the number of days from treatment initiation to the day the patient experienced an event of disease progression (radiographic, biochemical, or clinical) or death, whichever came first. Radiographic PFS was defined as the number of days from treatment initiation to the day the patient first experienced a specifically radiographic event of disease progression (not determined by NaF PET/CT imaging) or death, whichever came first. Patients not experiencing any progression-related events by the end of the follow-up period were censored to the last appropriate examination date (clinical or radiographic).
Statistical Analysis
The association between PSA and SUV metrics was evaluated using nonparametric Spearman rank correlation. Cox proportional hazards regression analyses were conducted to evaluate associations between NaF imaging metrics and progression based on the composite definition of PFS or radiographic PFS. In multivariable analysis, forward and backward selection methods were used to identify a parsimonious model. Univariable predictors with significance P < .2 were considered for inclusion in the initial nonparsimonious model. Backward selection was performed using Bayesian information criteria. Kaplan-Meier analysis was completed for categorical variables, and the log-rank test was used for comparison between groups. All reported P values are two sided, and P < .05 was used to determine statistical significance. Statistical analyses were conducted using R software (version 3.2.3; http://www.r-project.org/).
RESULTS
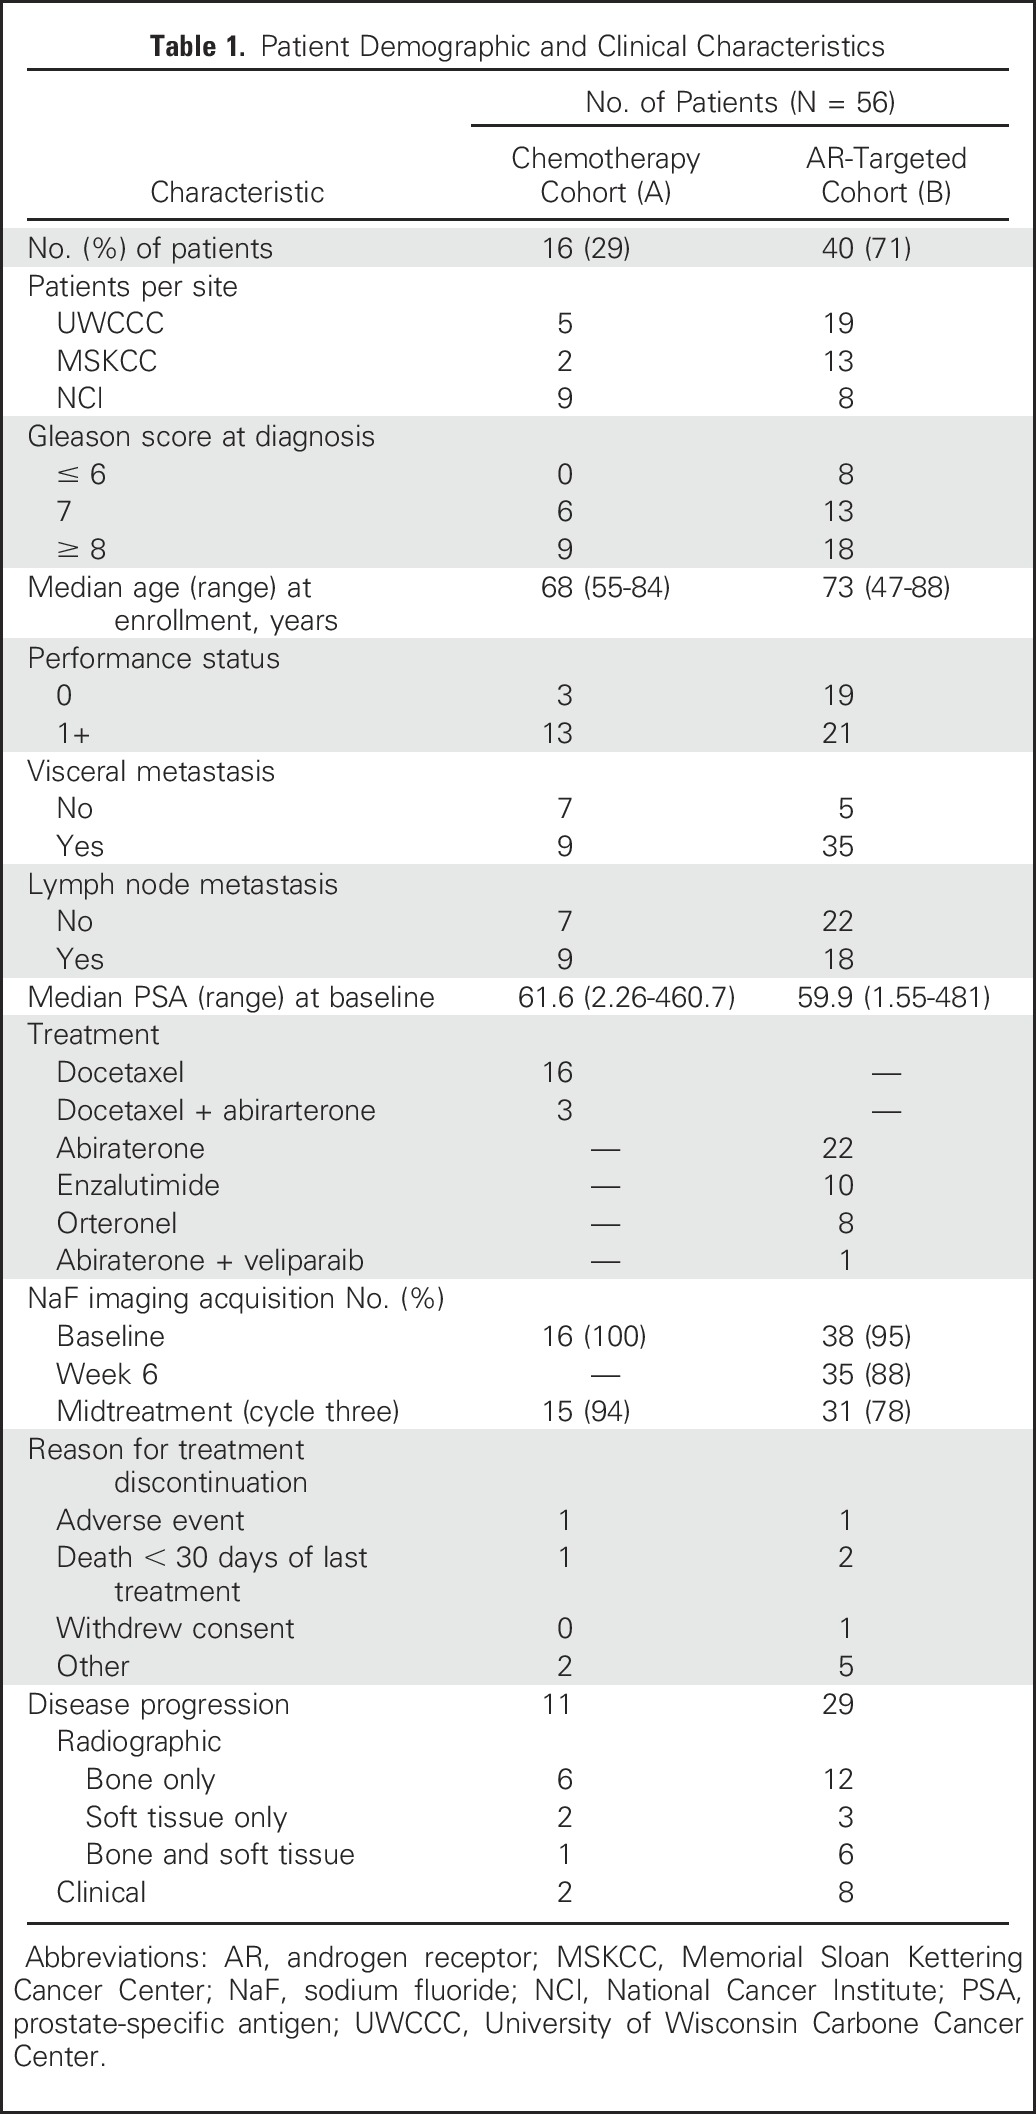
Of 58 patients enrolled, 56 received at least one scan evaluable for analysis. Fifty-four patients received baseline NaF PET/CT scans, and 46 received midtreatment NaF PET/CT scans (Table 1). At the time of data collection, 40 patients had progressive disease, three had died within the window of clinical evaluation, three had no evidence of progression and were continuing clinical follow-up, and 10 had gone off study for other reasons. Thirty patients experienced radiographic progression. Median SUVmax at baseline was 75.5 g/mL (range, 28.8 to 225.3 g/mL). Using the automated QTBI process, median number of lesions identified on baseline NaF PET/CT was 34 (range, one to 277 lesions). Benign disease was removed from analysis (average, 2.1 ROIs per patient; range, zero to 16 ROIs). Total functional burden (SUVtotal) at baseline varied markedly across patients, with median burden of 3.9 × 10³ and range of 0.02 × 10³ to 5.5 × 10³ [g/mL × cm3].
Table 1.
Patient Demographic and Clinical Characteristics
PFS
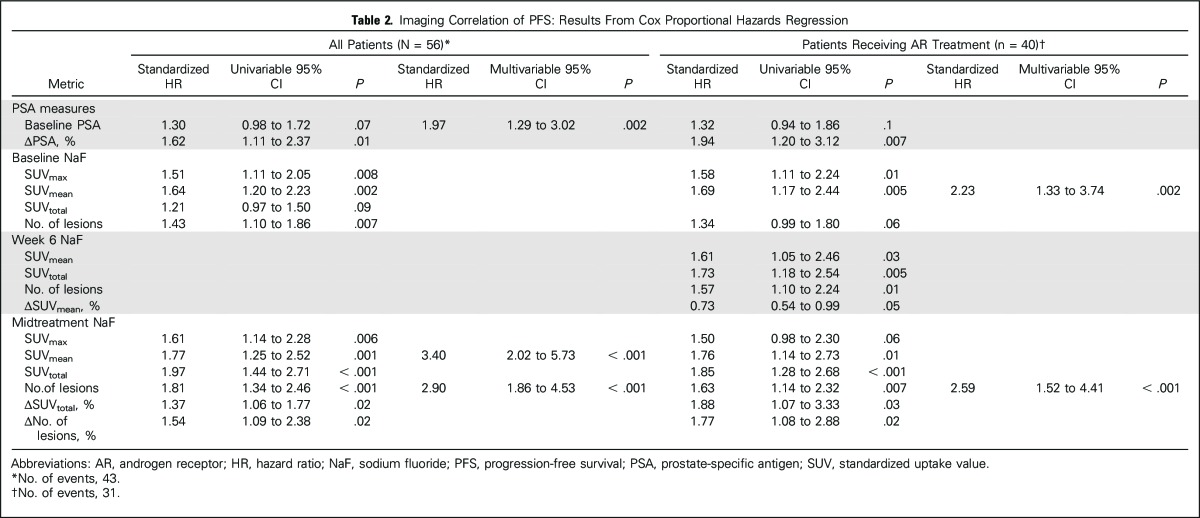
Median time from treatment initiation to progression was 7.6 months (range, 1.2 to ≥ 29.4), with no significant differences between treatment groups (P = .34). Correlation of NaF PET/CT to the composite definition of PFS is summarized in Table 2. Baseline imaging metrics significantly correlated with PFS included SUVmax, SUVmean, and number of lesions. Midtreatment SUVtotal was the strongest univariable predictor of PFS for all patients (hazard ratio [HR], 1.97; 95% CI, 1.44 to 2.71; P < .001) and patients receiving AR-directed treatment (HR, 1.8; 95% CI, 1.28 to 2.68; P < .001). Two NaF PET/CT metrics assessing imaging change from baseline to midtreatment were found to correlate with PFS: ΔSUVtotal and change in number of lesions.
Table 2.
Imaging Correlation of PFS: Results From Cox Proportional Hazards Regression
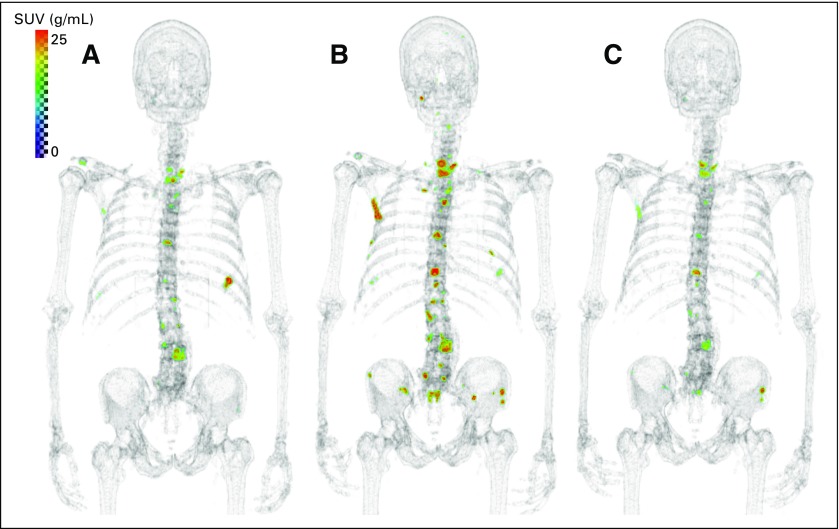
In the AR cohort (n = 40), week-6 NaF PET/CT metrics were also significant correlates of PFS (Table 3), including early imaging response measure ΔSUVmean (%) showing moderately favorable relation to outcome (HR, 0.73; 95% CI, 0.54 to 0.99; P = .05). Thirty-three patients had paired baseline and week-6 scans available for quantitative assessment; 16 patients showed increasing SUVmean median ΔSUVmean, 4.3%). Of these 16 patients, 13 exhibited declining PSA (indicating imaging of metabolic bone flare; Appendix Fig A1, online only).
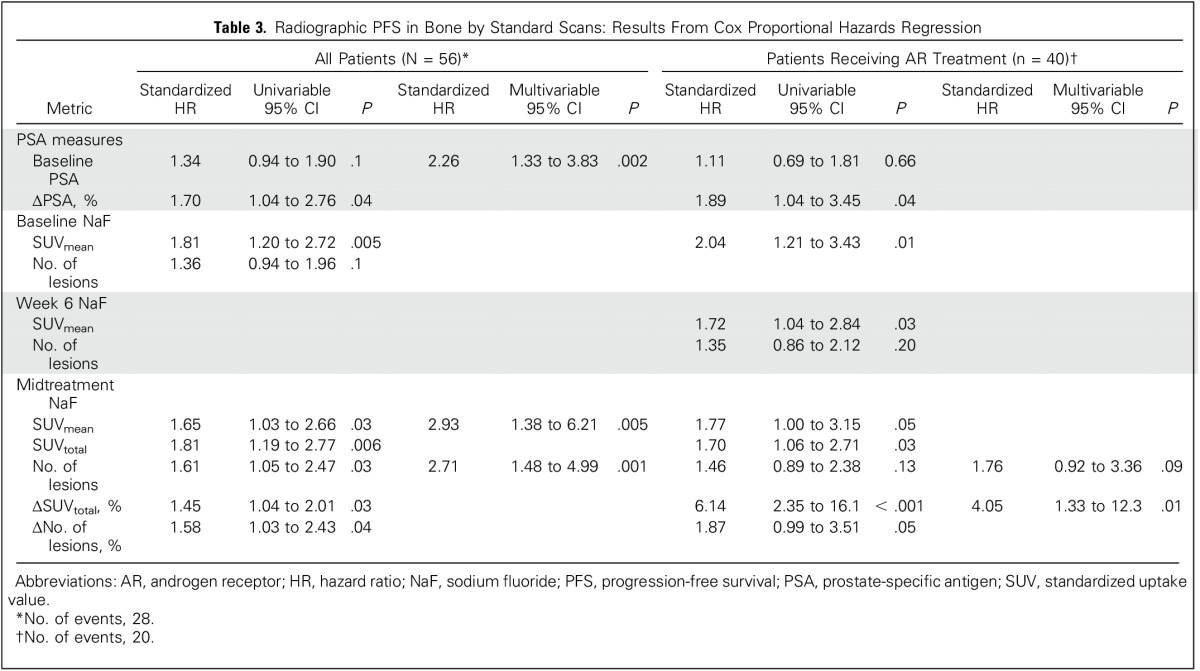
Table 3.
Radiographic PFS in Bone by Standard Scans: Results From Cox Proportional Hazards Regression
Radiographic PFS
Median time to radiographic progression by standard scans was 8.1 months (range, 1.5 to ≥ 28.5 months), with no differences between cohorts (P = .61). Of 30 patients experiencing radiographic progression, 25 had bone-related progression and five had soft tissue–only progression (Table 1). Baseline SUVmean and midtreatment SUVtotal were the strongest univariable NaF PET/CT correlates of bone-related radiographic progression determined by standard imaging for all patients (HR, 1.81; 95% CI, 1.20 to 2.72; P = .005 and HR, 1.81; 95% CI, 1.19 to 2.77; P = .006, respectively). In the AR cohort, ΔSUVtotal (%) at midtreatment was the NaF PET/CT metric most strongly associated with bone-related radiographic PFS (HR, 6.14; 95% CI, 2.35 to 16.1; P < .001). SUVmean was the only baseline NaF PET/CT metric associated with bone-related radiographic PFS for patients in the AR group (HR, 2.04; 95% CI, 1.21 to 3.43; P = .01) and a moderate correlate at week 6 (HR, 1.72; 95% CI, 1.04 to 2.84; P = .03).
Correlation to PSA
Baseline SUVtotal and number of lesions showed moderate correlation to baseline PSA (ρ = 0.35; P = .01; 95% CI, 0.09 to 0.56 and ρ = 0.33; P = .01; 95% CI, 0.07 to 0.55, respectively). Imaging correlations to baseline PSA strengthened at the week-6 time point for the AR cohort (SUVtotal: ρ = 0.58; P = .004; 95% CI, 0.30 to 0.77 and number of lesions: ρ = 0.43; P = .01; 95% CI, 0.11 to 0.67). Correlation between midtreatment ∆SUVmean and change in PSA (∆PSA), each assessed after three cycles of therapy, was moderate (ρ = 0.37; P = .02; 95% CI, 0.07 to 0.61). A similar trend was noted for ∆SUVtotal and ∆PSA (ρ = 0.31; P = .05; 95% CI, 0.00 to 0.57).
Assessment of Early Quantitative Changes
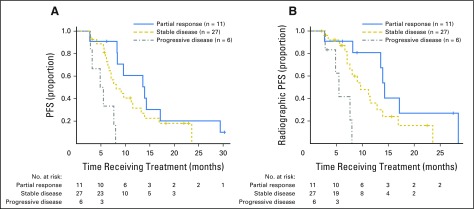
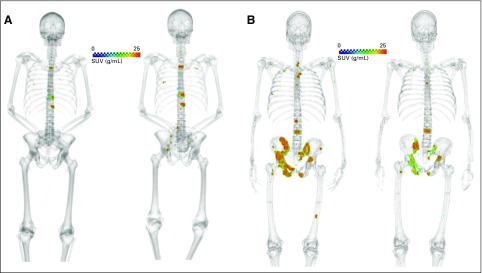
NaF treatment–related imaging alterations were categorized according to SUVtotal test-retest limits reported by Lin et al,12 classified as progressive disease (ΔSUVtotal > 44%), stable disease (−30% < ΔSUVtotal < 44%), or partial response (ΔSUVtotal < −30%; Fig 2). Six patients were found to have progressive ΔSUVtotal, 27 to have stable SUVtotal, and 11 to have favorable ΔSUVtotal (median PFS, 5.2, 7.1, and 13.6 months, respectively). Patients with progressive change on NaF PET/CT response after three cycles of treatment had significantly shorter PFS and radiographic PFS (both P < .001). Examples of patients with progressive and favorable early NaF PET/CT responses are shown in Figure 3.
Fig 2.
Classification based on quantitative standardized uptake value for total functional burden (SUVtotal) changes during first 12 weeks of therapy for (A) Progression-free survival (PFS) and (B) radiographic PFS. Patients classified as having progressive disease using quantitative thresholds of change in SUVtotal had poorer progression-free interval. Log-rank tests showed significant differences in progression-free intervals across response groups (P < .001 for both PFS and radiographic PFS).
Fig 3.
(A) Example of patient with progressive disease; 75-year-old man with time to radiographic progression of 87 days. (B) Example of patient with partial response; 52-year-old man with time to unequivocal clinical progression of 255 days. Sodium fluoride positron emission tomography/computed tomography shown at baseline (left) and midtreatment (right) in both panels. SUV, standardized uptake value.
DISCUSSION
Unlike radiographic criteria (eg, Response Evaluation Criteria in Solid Tumors [RECIST]) for anatomic imaging in patients with soft tissue disease, there is no established method to quantitatively monitor treatment response in bone metastases.17 Tools to determine treatment response in bone would be useful in evaluating promising new therapeutic agents.4 Given the number of treatment options available, treatment morbidity, and costs associated with therapy, an early response tool would also be of great benefit in clinical decision making. Imaging is ideally suited to fit this need; thus, this study aimed to assess the correlation of early NaF PET/CT changes with clinical outcomes.
We previously conducted a small trial showing early response assessment with NaF PET/CT is feasible.13 The study reported here is the first to our knowledge to use the novel technology QTBI to identify and monitor changes in bone disease on [18F]NaF PET/CT in patients with mCRPC receiving standard chemotherapy or AR-targeted inhibitors. QTBI allowed for uniform analysis of 56 patients despite variable disease burdens (median, 34 lesions per patient per scan; range, one to 277 lesions per patient per scan).
NaF PET/CT imaging metrics assessed in this study were evaluated within 12 weeks of treatment initiation and were strongly associated with radiographic bone progression as assessed by standard imaging, indicating early quantitative changes on NaF PET/CT precede radiographic changes later in treatment. We have demonstrated midtreatment total functional disease burden (SUVtotal) and change in disease burden during treatment (ΔSUVtotal [%]) are strong indicators of both a composite-definition PFS and radiographic PFS in this patient population.
Statistical intervals from test-retest analysis of the same population were used to characterize response in this study.12 Here we confirmed increasing functional burden on NaF PET/CT correlates with treatment failure (n = 6; PFS, 5.3 months), whereas decreasing burden correlates with prolonged treatment success (n = 11; PFS, 13.6 months). Previous studies support our findings, including a recent study evaluating patients with metastatic prostate cancer using NaF PET/CT at 6 and 12 months after treatment initiation.15 Similarly, ΔSUVmax on [18F]fluoride PET was predictive of PFS by standard scans in a small cohort of patients.14 The higher degree of quantitative analysis in our study allowed for fair comparison between SUV metrics and lesion burden. Use of SUVtotal for an indicator of early response must be validated by future studies correlating to imaging at the time of treatment failure.
Bone flare has been qualitatively described for patients receiving the AR-directed agent abiraterone. Previously observed within the first 8 weeks of treatment on bone scans, bone flare appears as worsening disease on imaging accompanied by decreasing PSA levels.18 Patients in our study receiving AR-directed treatments underwent an additional scan 6 weeks after starting treatment, where increasing average lesion uptake (ΔSUVmean) resulted in modest prolonged PFS (HR, 0.74; P = .06). ΔSUVmean was not shown to correlate with radiographic PFS. This contradicting pattern likely represents a flare phenomenon, appealing to visual indication on NaF PET/CT evaluations in this study (Appendix Fig A1).
Metastatic prostate cancer to bone is often characterized by widespread disease throughout the skeleton.19 Patients with ≥ 50 lesions on imaging are often regarded as having superscans (clinically nonevaluable disease) on bone scans. NaF PET/CT quantification has been handled variably in literature, limiting evaluation to one lesion per anatomic site in superscans15 or selection of up to five lesions per patient.14 An automatic technique for lesion quantification is desirable to ease time constraints of clinical physicians. Evaluation of disease was uniform in all patients for this study as a result of the use of the semiautomatic analysis tool QTBI. Because total functional burden (SUVtotal) was the strongest predictor of treatment efficacy, the importance of methodologies adopting total disease evaluation in mCRPC seems essential.
Several studies have addressed potential confounding factors in NaF PET/CT quantification, including frequency of benign uptake.15 All ROIs were identified using the SUV threshold of greater than 15 g/mL within bony regions, showing favorable repeatability in previous work.12 This threshold-based segmentation was selected to avoid incident inclusion of nonmalignant uptake.20-22 In this study, uptake thought to be caused by benign bone changes was removed by an experienced nuclear medicine physician. Degenerative uptake was found to encompass an average of 6.9% of ROIs per patient and is not considered a significant confounding factor for a majority of patients.
The results presented here show that QTBI is a promising tool to assess early treatment response in bone. Multiple PET radiotracers are currently being investigated for use in advanced-stage, metastatic prostate cancer with a higher specificity of detection for malignant lesions outside of the bone.23-25 Additional work needs to investigate the utility of these radiotracers for the use of response assessment in bone-dominant disease. Limitations of this study include lack of long-term imaging follow-up with NaF PET/CT and a study population representing different levels of prior therapy exposure and treatments during the study. Imaging assessment was completed within the first three cycles of therapy, when not all patients would have achieved maximum PSA decline; thus, the reported changes in PSA do not represent best response. Additionally, small sample size was a limitation, which did not allow for the evaluation of complex interactions between imaging response and other clinicopathologic variables.
It should be noted that because patients were treated according to separate therapeutic protocols or standard-of-care therapies, no uniform criteria for clinical benefit were used. Clinical end points reported in this study should be considered exploratory and largely reflect time patients spent receiving treatment. The composite definition of PFS in this context thus reflects the timing at which the physician determined the patient was no longer clinically benefiting, as described by Scher et al.26 Nevertheless, when correlated with protocol or clinical decision making, QTBI showed great promise in predicting duration of treatment. This supports future biomarker qualification studies.
In noncurative situations, overall clinical benefit is dependent on the burden of resistance (eg, new or progressing lesions). Recent changes in PCWG3 disease monitoring recommend recording whether disease progression represents growth of pre-existing lesions, development of new lesions, or both.26 However, there is discordance in clinical and radiographic progression, because lesions in inopportune locations can result in clinical deterioration despite no significant alterations in total anatomic disease burden. It would be ideal to have both an early marker for treatment response and spatial context of which lesions are developing resistance. QTBI provides this spatial context, allowing for more informative decision making to better determine when the patient is no longer clinically benefitting from therapy.
In conclusion, multiple [18F]NaF PET/CT uptake metrics acquired early in treatment were correlated with clinical and radiographic PFS. Increasing SUVtotal in the first 12 weeks of treatment was associated with progressive disease. Our analysis demonstrates that [18F]NaF PET/CT may be a useful tool in early follow-up of patients with mCRPC with bone metastases. Additional studies are warranted to assess the therapy-specific ability of [18F]NaF PET/CT to accurately identify response to treatment. This work supports ongoing development of [18F]NaF PET/CT–based imaging biomarkers in mCRPC.
Appendix
Fig A1.
Patient receiving abiraterone exhibiting signs of metabolic bone flare on sodium fluoride (NaF) positron emission tomography/computed tomography from (A) baseline to (B) week 6 (increasing NaF uptake) before subsiding at (C) week 12.
Footnotes
Supported in part by a Prostate Cancer Foundation Creativity Award, a Prostate Cancer Foundation Mazzone Challenge Award, Grant No. W81-XWH-14-2- 0155 through the Department of Defense Prostate Cancer Research Program Clinical Consortium, Award No. T32CA009206 from the National Cancer Institute (NCI), the University of Wisconsin (UW) Carbone Cancer Center Paul P. Carbone MD Memorial Foundation, and a UW Comprehensive Cancer Center Support Grant through NCI Grant No. P30 CA014520.
Presented in part at the American Society of Clinical Oncology Genitourinary Cancers Symposium, San Francisco, CA, January 7-9, 2016.
The content is solely the responsibility of the authors and does not necessarily represent the official views of the National Institutes of Health.
Clinical trial information: NCT01516866.
AUTHOR CONTRIBUTIONS
Conception and design: William L. Dahut, Andrea B. Apolo, Steven M. Larson, Glenn Liu, Robert Jeraj
Financial support: Glenn Liu, Robert Jeraj
Administrative support: Glenn Liu
Provision of study materials or patients: Michael J. Morris, Glenn Liu
Collection and assembly of data: Stephanie A. Harmon, Christie Lin, Peter L. Choyke, Andrea B. Apolo, John L. Humm, Glenn Liu, Robert Jeraj
Data analysis and interpretation: Stephanie A. Harmon, Timothy Perk, Christie Lin, Jens Eickhoff, Andrea B. Apolo, Michael J. Morris, Glenn Liu, Robert Jeraj
Manuscript writing: All authors
Final approval of manuscript: All authors
Accountable for all aspects of the work: All authors
AUTHORS' DISCLOSURES OF POTENTIAL CONFLICTS OF INTEREST
Quantitative Assessment of Early [18F]Sodium Fluoride Positron Emission Tomography/Computed Tomography Response to Treatment in Men With Metastatic Prostate Cancer to Bone
The following represents disclosure information provided by authors of this manuscript. All relationships are considered compensated. Relationships are self-held unless noted. I = Immediate Family Member, Inst = My Institution. Relationships may not relate to the subject matter of this manuscript. For more information about ASCO's conflict of interest policy, please refer to www.asco.org/rwc or ascopubs.org/jco/site/ifc.
Stephanie A. Harmon
No relationship to disclose
Timothy Perk
No relationship to disclose
Christie Lin
No relationship to disclose
Jens Eickhoff
Research Funding: Sanofi Pasteur (Inst)
Peter L. Choyke
Patents, Royalties, Other Intellectual Property: Patent for magnetic resonance imaging–ultrasound fusion technology licensed to InVivo, which markets it as UroNav (no financial benefit)
William L. Dahut
No relationship to disclose
Andrea B. Apolo
No relationship to disclose
John L. Humm
No relationship to disclose
Steven M. Larson
Stock or Other Ownership: ImaginAb
Consulting or Advisory Role: Prescient Therapeutics
Research Funding: Wilex, Regeneron
Patents, Royalties, Other Intellectual Property: Synthesis and utilization of 17-methyl and 17-cyclo-propylmethyl-3, 14-di-hydroxy-4, 5-epoxy 6 b-fluoromorphines (foxy and cyclofoxy) as (18F)-labeled opiate ligands for positron emission transaxial tomography (PET), Rice KC, Pert CB, Burke TR Jr, Larson SM, Eckelman WC, Channing MA, October 4, 1988, US Patent No. 4,775,759; Antigen-specific composition and in vivo methods for detecting and localizing an antigenic site and for radiotherapy, Larson SM, Finn R, Carrasquillo JA, Reynolds JC, Neumann RD, Graham MC, Pentlow KS, February 9, 1993, US Patent No. 5,185,142; Non-invasive imaging and quantification of specific antigen and uses thereof, Smith-Jones P, Larson SM, January 6, 2003, provisional patent application, Registration No. 28,325; Single chain Fv polynucleotide or peptide construct of anti-ganglioside GD2 antibodies, cells expressing same and related methods, Cheung NK, Larson SM, Guo HF, Rivlin K, Sadelain M, US Patent No. 6,451,995; Small-molecule HSP90 inhibitors, Chiosis G, Huazhong H, Llauger-Bufi L, Kim J, Larson S, Smith-Jones P, November 16, 2010, US Patent No. 7,834,181; Multi-specific antibodies with affinity for human A33 antigen and DOTA metal complex and uses thereof, Cheal S, Hong X, Larson SM, Cheung NK, February 9, 2015, US Patent No. 62,113,988; Systems and methods for determining optimum patient-specific antibody dose for tumor targeting, Zanzonico P, Cheal SM, Larson SM, Osborne J, Fung EK, May 22, 2015, US Patent No. 62,165699
Travel, Accommodations, Expenses: Voreyda Theranostics
Michael J. Morris
Consulting or Advisory Role: Astellas Pharma, Bayer HealthCare Pharmaceuticals, Endocyte
Research Funding: Bayer HealthCare Pharmaceuticals (Inst), Sanofi (Inst), Endocyte (Inst), Progenics (Inst)
Travel, Accommodations, Expenses: Bayer HealthCare Pharmaceuticals, Endocyte
Glenn Liu
Stock or Other Ownership: AIQ Solutions
Consulting or Advisory Role: Sanofi
Research Funding: Novartis, Medivation, Pfizer, AstraZeneca
Patents, Royalties, Other Intellectual Property: AIQ Solutions
Robert Jeraj
Stock or Other Ownership: AIQ Solutions
Research Funding: GE Health Care
Patents, Royalties, Other Intellectual Property: Several Wisconsin Alumni Research Foundation patents
REFERENCES
- 1.Costelloe CM, Chuang HH, Madewell JE, et al. : Cancer response criteria and bone metastases: RECIST 1.1, MDA and PERCIST. J Cancer 1:80-92, 2010 [DOI] [PMC free article] [PubMed] [Google Scholar]
- 2.Scher HI, Halabi S, Tannock I, et al. : Design and end points of clinical trials for patients with progressive prostate cancer and castrate levels of testosterone: Recommendations of the Prostate Cancer Clinical Trials Working Group. J Clin Oncol 26:1148-1159, 2008 [DOI] [PMC free article] [PubMed] [Google Scholar]
- 3.Morris MJ, Molina A, Small EJ, et al. : Radiographic progression-free survival as a response biomarker in metastatic castration-resistant prostate cancer: COU-AA-302 results. J Clin Oncol 33:1356-1363, 2015 [DOI] [PMC free article] [PubMed] [Google Scholar]
- 4.Stewart SB, Moul JW, Polascik TJ, et al. : Does the multidisciplinary approach improve oncological outcomes in men undergoing surgical treatment for prostate cancer? Int J Urol 21:1215-1219, 2014 [DOI] [PubMed] [Google Scholar]
- 5.Mick CG, James T, Hill JD, et al. : Molecular imaging in oncology: (18)F- sodium fluoride PET imaging of osseous metastatic disease. AJR Am J Roentgenol 203:263-271, 2014 [DOI] [PubMed] [Google Scholar]
- 6.Grant FD, Fahey FH, Packard AB, et al. : Skeletal PET with 18F-fluoride: Applying new technology to an old tracer. J Nucl Med 49:68-78, 2007 [DOI] [PubMed] [Google Scholar]
- 7.Iagaru A, Mittra E, Dick DW, et al. : Prospective evaluation of Tc-99m MDP scintigraphy, F-18 NaF PET/CT, and F-18 FDG PET/CT for detection of skeletal metastases. Mol Imaging Biol 14:252-259, 2011 [DOI] [PubMed] [Google Scholar]
- 8.Schirrmeister H, Glatting G, Hetzel J, et al. : Prospective evaluation of the clinical value of planar bone scans, SPECT, and (18)F-labeled NaF PET in newly diagnosed lung cancer. J Nucl Med 42:1800-1804, 2001 [PubMed] [Google Scholar]
- 9.Even-Sapir E, Metser U, Mishani E, et al. : The detection of bone metastases in patients with high-risk prostate cancer: 99mTc-MDP planar bone scintigraphy, single- and multi-field-of-view SPECT, 18F-fluoride PET, and 18F-fluoride PET/CT. J Nucl Med 47:287-297, 2006 [PubMed] [Google Scholar]
- 10.Wondergem M, van der Zant FM, van der Ploeg T, et al. : A literature review of 18F-fluoride PET/CT and 18F-choline or 11C-choline PET/CT for detection of bone metastases in patients with prostate cancer. Nucl Med Commun 34:935-945, 2013 [DOI] [PubMed] [Google Scholar]
- 11.Kurdziel KA, Shih JH, Apolo AB, et al. : The kinetics and reproducibility of 18F-sodium fluoride for oncology using current PET camera technology. J Nucl Med 53:1175-1184, 2012 [DOI] [PMC free article] [PubMed] [Google Scholar]
- 12.Lin C, Bradshaw T, Perk T, et al. : Repeatability of quantitative 18F-NaF PET: A multicenter study. J Nucl Med 57:1872-1879, 2016 [DOI] [PMC free article] [PubMed] [Google Scholar]
- 13.Simoncic U, Perlman S, Liu G, et al. : Comparison of NaF and FDG PET/CT for assessment of treatment response in castration-resistant prostate cancers with osseous metastases. Clin Genitourin Cancer 13:e7-e17, 2015 [DOI] [PMC free article] [PubMed] [Google Scholar]
- 14.Yu EY, Duan F, Muzi M, et al. : Castration-resistant prostate cancer bone metastasis response measured by 18F-fluoride PET after treatment with dasatinib and correlation with progression-free survival: Results from American College of Radiology Imaging Network 6687. J Nucl Med 56:354-360, 2015 [DOI] [PMC free article] [PubMed] [Google Scholar]
- 15.Apolo AB, Lindenberg L, Shih JH, et al. : Prospective study evaluating Na18F PET/CT in predicting clinical outcomes and survival in advanced prostate cancer. J Nucl Med 57:886-892, 2016 [DOI] [PMC free article] [PubMed] [Google Scholar]
- 16.Bubley GJ, Carducci M, Dahut W, et al. : Eligibility and response guidelines for phase II clinical trials in androgen-independent prostate cancer: Recommendations from the Prostate-Specific Antigen Working Group. J Clin Oncol 17:3461-3467, 1999 [DOI] [PubMed] [Google Scholar]
- 17.Therasse P, Arbuck SG, Eisenhauer EA, et al. : New guidelines to evaluate the response to treatment in solid tumors: European Organization for Research and Treatment of Cancer, National Cancer Institute of the United States, National Cancer Institute of Canada. J Natl Cancer Inst 92:205-216, 2000 [DOI] [PubMed] [Google Scholar]
- 18.Ryan CJ, Shah S, Efstathiou E, et al. : Phase II study of abiraterone acetate in chemotherapy-naive metastatic castration-resistant prostate cancer displaying bone flare discordant with serologic response. Clin Cancer Res 17:4854-4861, 2011 [DOI] [PMC free article] [PubMed] [Google Scholar]
- 19.Wang C, Shen Y: Study on the distribution features of bone metastases in prostate cancer. Nucl Med Commun 33:379-383, 2012 [DOI] [PubMed] [Google Scholar]
- 20.Rohren EM, Etchebehere EC, Araujo JC, et al. : Determination of skeletal tumor burden on F-18-fluoride PET/CT. J Nucl Med 56:1507-1512, 2015 [DOI] [PMC free article] [PubMed] [Google Scholar]
- 21.Oldan JD, Hawkins AS, Chin BB: (18)F sodium fluoride PET/CT in patients with prostate cancer: Quantification of normal tissues, benign degenerative lesions, and malignant lesions. World J Nucl Med 15:102-108, 2016 [DOI] [PMC free article] [PubMed] [Google Scholar]
- 22.Muzahir S, Jeraj R, Liu G, et al. : Differentiation of metastatic vs degenerative joint disease using semi-quantitative analysis with (18)F-NaF PET/CT in castrate resistant prostate cancer patients. Am J Nucl Med Mol Imaging 5:162-168, 2015 [PMC free article] [PubMed] [Google Scholar]
- 23.Evangelista L, Bertoldo F, Boccardo F, et al. : Diagnostic imaging to detect and evaluate response to therapy in bone metastases from prostate cancer: Current modalities and new horizons. Eur J Nucl Med Mol Imaging 43:1546-1562, 2016 [DOI] [PubMed] [Google Scholar]
- 24.Rowe SP, Macura KJ, Mena E, et al. : PSMA-based [(18)F]DCFPyL PET/CT is superior to conventional imaging for lesion detection in patients with metastatic prostate cancer. Mol Imaging Biol 18:411-419, 2016 [DOI] [PMC free article] [PubMed] [Google Scholar]
- 25.Beheshti M, Rezaee A, Geinitz H, et al. : Evaluation of prostate cancer bone metastases with 18F-NaF and 18F-fluorocholine PET/CT. J Nucl Med 57:55S-60S, 2016 [DOI] [PubMed] [Google Scholar]
- 26.Scher HI, Morris MJ, Stadler WM, et al: Trial design and objectives for castration-resistant prostate cancer: Updated recommendations from the Prostate Cancer Clinical Trials Working Group 3. J Clin Oncol 34:1402-1418, 2016 [DOI] [PMC free article] [PubMed] [Google Scholar]


