

Abstract
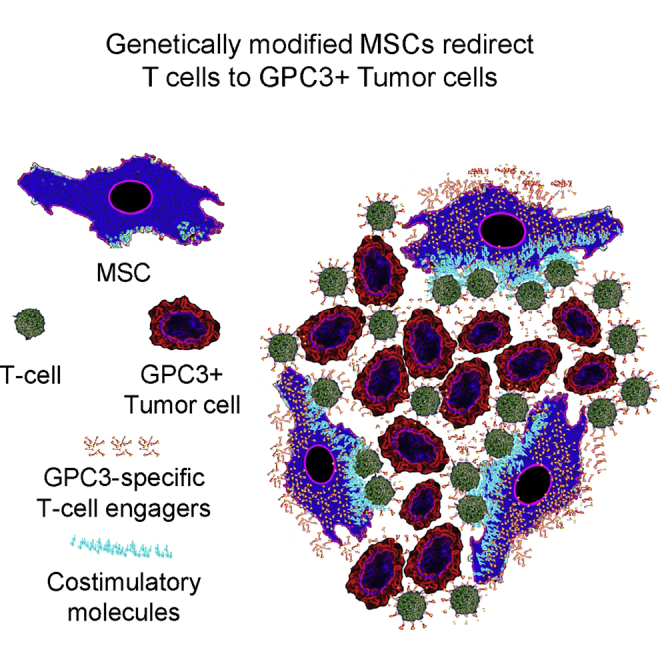
The outcome for advanced stage hepatocellular carcinoma (HCC) remains poor, highlighting the need for novel therapies. Genetically modified mesenchymal stem cells (MSCs) are actively being explored as cancer therapeutics due to their inherent ability to migrate to tumor sites. We reasoned that MSCs can be genetically modified to redirect T cells to Glypican-3 (GPC3)+ HCC, and genetically modified these with viral vectors encoding a GPC3/CD3 bispecific T cell engager (GPC3-ENG), a bispecifc T cell engager specific for an irrelevant antigen (EGFRvIII), and/or costimulatory molecules (CD80 and 41BBL). Coculture of GPC3+ cells, GPC3-ENG MSCs, and T cells resulted in T cell activation, as judged by interferon γ (IFNγ) production and killing of tumor cells by T cells. Modification of GPC3-ENG MSCs with CD80 and 41BBL was required for antigen-dependent interleukin-2 (IL-2) production by T cells and resulted in faster tumor cell killing by redirected T cells. In vivo, GPC3-ENG MSCs ± costimulatory molecules had antitumor activity in the HUH7 HCC xenograft model, resulting in a survival advantage. In conclusion, MSCs genetically modified to express GPC3-ENG ± costimulatory molecules redirect T cells to GPC3+ tumor cells and have potent antitumor activity. Thus, further preclinical exploration of our modified approach to GPC3-targeted immunotherapy for HCC is warranted.
Keywords: hepatocellular carcinoma, GPC3, bispecific antibody, immunotherapy
Graphical Abstract
Introduction
Hepatocellular carcinoma (HCC) is the third leading cause of cancer deaths worldwide, with over 500,000 people affected. The majority of patients are diagnosed with aggressive advanced disease, which has an overall 5-year survival rate of less than 15%.1 Activating the immune system for therapeutic benefit holds the promise to improve outcomes for HCC because it does not rely on the cytotoxic mechanisms of conventional therapies.
Glypican 3 (GPC3),2 a glycophosphatidylinositiol-linked membrane-associated protein, is a promising immunotherapeutic target for HCC. It plays an important role in growth and dedifferentiation of HCC,3, 4 and is expressed in 67%–90% of tumors, but not in healthy, adult normal tissues.2, 5 The GPC3-specific monoclonal antibody (mAb) GC33 has been evaluated in early phase clinical studies. Infusion of GC33 was safe; however, only limited antitumor activity was observed that correlated with the intensity of GPC3 expression.6 One strategy to improve the antitumor activity of GPC3-targeted immunotherapies is to express GPC3-specific chimeric antigen receptors (GPC3-CARs) or T cell receptors on T cells. Indeed, GPC3-specific T cells had potent antitumor activity in preclinical HCC models,7, 8, 9 and clinical phase I testing in humans is in progress. However, the broader application of autologous cell products, such as CAR T cells, may ultimately be limited because these cell products are not readily available and require a significant “on site” infrastructure to produce.
Allogeneic “off-the-shelf” cell products, including mesenchymal stem cells (MSCs), have the potential to overcome these limitations. Human MSCs avoid allorecognition and, due to their inherent ability to traffic to tumor sites, are actively being explored to deliver cytotoxic payloads to cancer cells.10, 11, 12, 13, 14, 15 For example, for HCC, it has been shown that production of the chemokines chemokine (C-C motif) ligand 2 (CCL2) and chemokine (C-X-C motif) ligand 8 (CXCL8) by HCC promotes MSC migration to tumor sites.16
Here, we report the generation of MSCs that are genetically modified to express bispecific T cell engagers that consist of one single chain variable fragment (scFv) specific for GPC3 and a second scFv specific for CD3 (GPC3-ENG). MSCs expressing GPC3-ENG (GPC3-ENG MSCs) redirected T cells to GPC3+ tumor cells, as judged by cytokine production and cytolytic activity. GPC3-specific T cell activation by GPC3-ENG MSCs was further enhanced by the provision of CD80 and 41BBL costimulation. In addition, GPC3-ENG MSCs induced tumor regression in an HCC xenograft mouse model, which was associated with a significant survival advantage.
Results
GPC3-ENG MSCs Redirect T Cells to GPC3+ Tumor Cells
We genetically modified human MSCs with VSVG-pseudotyped lentiviral vector encoding GPC3-ENG and GFP (Figure 1A). Mean transduction efficiency was 93.3% (range: 86.1%–97.8%; n = 6), as judged by fluorescence-activated cell sorting (FACS) analysis (Figures 1B and 1C). To quantify GPC-ENG molecules in cell culture media, we developed an ELISA using recombinant GPC3-ENG protein as a standard. Although individual GPC3-ENG MSCs secreted a mean of 81 pg (range: 60.4–94.33) of GPC3-ENG protein per cell in 24 hr, no GPC3-ENG protein was detected in the media of non-transduced (NT) MSCs (Figure 1D). Phenotypic analysis of GPC3-ENG MSCs revealed no significant change in phenotype to NT MSCs, as judged by cell adherence, fibroblast morphology, and expression of MSC surface markers (CD90 ≥95%; CD105 ≥95%; CD45 ≤1%; Figure S1).
Figure 1.

Generation of GPC3-ENG MSCs
(A) Scheme of lentiviral vector encoding GPC3-ENG and GFP. (B and C) Representative FACS diagram and summary data (GPC3-ENG MSCs [n = 6] and NT MSCs [n = 6]) of GFP expression post-transduction. (D) Detection of GPC3-ENG protein in media of GPC3-ENG and NT MSCs after 24 hr of culture (n = 6, performed in duplicates).
To demonstrate that GPC3-ENG MSCs redirect T cells to tumor cells expressing the target antigen, we used GPC3+ (HUH7 and G401) and GPC3− (A549) cell lines (Figure S2). To show that GPC3-ENG bind GPC3+ tumor cells as well as T cells, we incubated cells with conditioned media from GPC3-ENG expressing MSCs or NT MSCs. Cells were then washed and incubated with recombinant GPC3-Fc (for T cells) or CD3e-Fc (for tumor cells) protein. Bound recombinant protein was detected with an Fc antibody. The Fc antibody readily bound to T cells and tumor cells that had been initially incubated with media GPC3-ENG-expressing MSCs. In contrast, no binding was detected for cells that had been incubated with media from NT MSCs, indicating that GPC3-ENGs readily bind to T cells with their CD3-specific scFv and to tumor cells with their GPC3-specific scFv (Figure S3). For co-culture assays, we generated NT MSCs, GPC3-ENG MSCs, or MSCs genetically modified with an ENG molecule recognizing an irrelevant antigen (EGFRvIII-ENG MSCs). These were mixed with tumor cells at MSC to tumor cell ratios of 1:3 and 1:10 in the presence of human T cells. After 24 hr, media was collected and the presence of interferon γ (IFNγ) and interleukin-2 (IL-2) was determined by ELISA. GPC3-ENG MSCs induced T cells to produce significant amounts of IFNγ (p < 0.05) only in the presence of GPC3+ tumor cells in contrast to EGFRvIII-ENG MSCs (Figure 2A). However, GPC3-ENG MSCs did not induce T cells to produce IL-2 (Figure 2B). To assess the ability of GPC3-MSCs to induce T cell killing of tumor cells, we cocultured MSCs in the presence of T cells and tumor cells that were genetically modified to express enhanced GFP (eGFP) firefly luciferase fusion gene (eGFP.ffLuc). Although GPC3-ENG MSCs induced T cell killing of GPC3+ target cells, no T cell killing of GPC3− target cells was observed (p < 0.001; Figure 2C). Media, NT MSCs, or EGFRvIII-ENG MSCs did not induce killing of any target cells, confirming specificity. Thus, GPC3-ENG MSCs activate human T cells in an antigen-dependent manner and induce antigen-dependent tumor cell killing.
Figure 2.

GPC3-ENG MSCs Induce T Cells to Recognize and Kill GPC3+ Tumor Cells
(A and B) GPC3-ENG, EGFRvIII-ENG, or NT MSCs were cocultured with GPC3+ (G401; HUH7) or GPC3− (A549) cell lines at 1:10 (left panel) or 1:3 (right panel) MSC to tumor cell ratios in the presence of human T cells (10:1 T cell to tumor cell ratio). After 24 hr, IFNγ (A) or IL-2 (B) was determined by ELISA (n = 6, assay performed in duplicates; GPC3-ENG versus NT and CD19-ENG MSCs: *p < 0.05, **p < 0.01, ***p < 0.001). (C) Luciferase-based cytotoxicity assays using GPC3-ENG, EGFRvIII, or NT MSCs and GPC3+ (G401.eGFP.ffLuc; HUH7.eGFP.ffLuc) or GPC3− (A549.eGFP.ffLuc) cell lines as targets at an MSC to tumor cell ratio of 1:10 in the presence of human T cells (10:1 T cell to tumor cell ratio; n = 6; assay was performed in triplicates; box graph; whiskers: min, max; ***p < 0.001).
GPC3-ENG MSCs Expressing CD80 and 41BBL Induce T Cells to Produce IL-2 in an Antigen-Dependent Manner
Because we did not observe antigen-dependent IL-2 production, we next generated GPC3-ENG MSCs that also expressed costimulatory molecules (CD80, 41BBL, or CD80 and 41BBL) on their cell surface (Figures S4A and S4B). There was no significant difference in regards to GPC3-ENG protein production between different MSC populations (Figure S4C). We performed co-culture assay as described above with GPC3-ENG MSC.CD80, GPC3-ENG MSC.41BBL, or GPC3-ENG MSC.CD80+41BBL at an MSC to tumor cell ratio of 1:10 in the presence of T cells. All MSC populations induced significant production of IFNγ by T cells in the presence of GPC3+ (HUH7 and G401) tumor cells in comparison to GPC3− (A549) tumor cells (p < 0.01; Figure 3A). GPC3-ENG MSC.CD80+41BBL not only induced the highest IFNγ production by T cells (p < 0.05), but also induced IL-2 production in a GPC3-dependent manner in contrast to all other MSC populations (Figure 3B). To further investigate which ratio of MSCs to tumor cells is needed to induce IFNγ and IL-2 production, we performed a titration experiment. Significant IFNγ production was observed at an MSC to tumor cell ratio of 1:30 in contrast to IL-2 production (Figure S5). Specificity of GPC3-ENG MSC expressing costimulatory molecules was further confirmed in 24-hr cytotoxicity assays, with antigen-specific target cell killing of up to 60% (Figure 3C). Killing increased to greater than 99% in a 48-hr cytotoxicity assay (Figure S6).
Figure 3.

GPC3-ENG MSCs Expressing CD80 and 41BBL Induce T Cells to Produce IL-2
(A and B) GPC3-ENG, GPC3-ENG.CD80, GPC3-ENG.41BBL, or GPC3-ENG.CD80+41BBL MSCs were cocultured with GPC3+ (G401; HUH7) or GPC3− (A549) cell lines in 1:10 MSC to tumor cell ratios in the presence of human T cells (10:1 T cell to tumor cell ratio). After 24 hr, IFNγ (A) or IL-2 (B) was determined by ELISA (n = 6, assay performed in duplicates; GPC3-ENG.CD80+41BBL versus GPC3-ENG MSCs: *p < 0.05, **p < 0.01, ***p < 0.001). (C) Luciferase-based cytotoxicity assays using GPC3-ENG, GPC3-ENG.CD80, GPC3-ENG.41BBL, or GPC3-ENG.CD80+41BBL MSCs and GPC3+ (G401.ffLuc; HUH7.ffLuc) or GPC3− (A549.ffLuc) cell lines as targets at a MSC:tumor ratio of 1:10 in the presence of human T cells (10:1 T cell to tumor cell ratio; n = 6; performed in triplicates; box graph; whiskers: min, max; ***p < 0.001).
GPC3-ENG MSCs Induce Antigen-Dependent T Cell Proliferation
We next evaluated whether GPC3-ENG MSCs could induce antigen-specific T cell proliferation. GPC3-ENG MSCs ± costimulatory molecules, NT MSCs, or EGFRvIII-ENG MSCs were cocultured with tumor cell lines at an MSC to tumor cell ratio of 1:10 in the presence of human T cells. After 7 days, non-adherent cells were harvested and the absolute numbers of CD3+ T cells were determined by FACS analysis. All GPC3-ENG MSC populations induced T cell proliferation in the presence of GPC3+ (HUH7 and G401) tumor cells in contrast to media, NT MSCs, or EGFRvIII-ENG MSCs. In the presence of GPC3− tumors, no T cell proliferation was observed, confirming specificity (Figure 4A). Phenotypic analysis revealed predominance of CD8+ T cells (Figure 4B), and expanded T cells had a central memory phenotype (CCR7+ CD45RA−; Figures 4C and 4D). To confirm that GPC3-ENGs by themselves do not induce T cell proliferation, T cells were incubated with supernatants of GPC3-ENG or NT MSCs. Absolute numbers of T cells were enumerated after 72 hr, and no significant difference was observed between both groups (Figure S7).
Figure 4.

GPC3-ENG MSCs Induce Antigen-Dependent T Cell Proliferation
(A–D) GPC3-ENG, GPC3-ENG.CD80, GPC3-ENG.41BBL, or GPC3-ENG.CD80+41BBL MSCs were cocultured with GPC3+ (G401; HUH7) or GPC3− (A549) cell lines at a 1:10 MSC to tumor cell ratio in the presence of human T cells (10:1 T cell to tumor cell ratio). After 7 days, absolute number of CD3+ cells (A), CD8/CD4 T cell ratio (B), and presence of naive (CD45A+,CCR7+), central memory (CM; CD45A−,CCR7+), effector memory (EM; CD45A−,CCR7−), or effector memory RA (EMRA; CD45A+,CCR7−) T cells (C and D) was determined by FACS analysis (n = 4; performed in duplicates; GPC3-ENG.CD80+41BBL versus GPC3-ENG MSCs: *p < 0.05, **p < 0.01).
GPC3-ENG MSCs.CD80+41BBL Induce Faster T Cell Killing of GPC3+ Tumor Cells
Having established that GPC3-ENG MSCs.CD80+41BBL induce more potent T cell activation, as judged by IL-2 production, we wanted to determine if this results in faster tumor cell killing by T cells. To study the kinetics of tumor cell killing, we used a spinning disc confocal microscopy assay, in which the incorporation of propidium iodide (PI) into dying cells is measured in real time. To quantify cell death, the area-corrected intensity of PI fluorescence was calculated. GPC3-ENG MSCs.CD80+41BBL induced faster T cell killing of GPC3+ tumor cells in comparison to GPC3-ENG MSCs (p < 0.001). Neither MSC population induced T cell killing of GPC3− A549 cells, confirming specificity (Figures 5A and 5B; Movies S1 and S2).
Figure 5.

Time-Lapse Confocal Microscopic Imaging of GPC3-ENG MSCs Induced Killing of GPC3+ Tumor Cells
(A) Representative images (at 0 hr and 12 hr) for real-time detection of cytolytic activity of T cells in the presence of GPC3+ (HUH7) or GPC3− (A549) cell lines and GPC3-ENG.CD80+41BBL MSCs (green; 1:10 MSC to tumor cell ratio; 10:1 T cell to tumor cell ratio). Cell death was visualized by incorporation of PI (red). (B) Tumor cell killing at various time points was determined as an area of corrected mean pixel intensity (PI channel; intensity × area × 106 pixel). The solid lines in the graph represent the “best-fit” linear regression analysis (HUH7 coculture with GPC3-ENG [blue] or GPC-ENG.CD80+41BBL MSCs [red]; A549 cells coculture with GPC3-ENG [green] or GPC-ENG.CD80+41BBL MSCs [yellow]. The dots show individual experimental values (n = 5; experiments = 2; ***p < 0.001).
GPC3-ENG MSCs Have Antitumor Activity In Vivo
We finally compared the antitumor activity of GPC3-ENG MSCs in vivo. In the first set of experiments, HUH7.eGFP.ffLuc cells were coinjected subcutaneously (s.c.) at a ratio of 10:1 with GPC3-ENG MSCs, GPC3-ENG MSC.CD80, GPC3-ENG MSC.41BBL, or GPC3-ENG MSC.CD80+41BBL. On day 7, mice received an intravenous (i.v.) dose of 1 × 10⁷ T cells. HUH7.eGFP.ffLuc coinjected with EGFRv3-ENG MSC or EGFRvIII-ENG MSC.CD80+41BBL served as controls. After T cell infusion, there was a significant decrease in tumor growth, as judged by bioluminescence imaging, in mice that received GPC3-ENG MSCs ± costimulatory molecules in comparison to control mice (Figures 6A and 6B). This resulted in a significant survival advantage of GPC3-ENG MSCs ± costimulatory molecule treated mice (p < 0.01; Figure 6C). However, provision of costimulation did not improve survival in comparison to unmodified GPC3-ENG MSCs. Next, we determined the antitumor activity of GPC3-ENG MSCs in established tumors. Mice were injected s.c. with HUH7.eGFP.ffLuc cells. On day 7, mice received a peritumoral injection of GPC3-ENG MSC.CD80+41BBL or EGFRvIII-ENG MSC.CD80+41BBL, followed by an i.v. dose of T cells on day 10. Controls included tumor-bearing mice that only received T cells or GPC3-ENG MSC.CD80+41BBL. Only GPC3-ENG MSC.CD80+41BBL plus T cells induced a regression of established tumors, as judged by bioluminescence imaging (Figures 7A and 7B). This resulted in a significant increase in survival in comparison to mice that only received T cells (Figure 7C).
Figure 6.

GPC3-ENG MSCs Redirect T Cells In Vivo to Kill HCC
Antitumor activity of GPC3-ENG MSCs in an HCC xenograft model. Mice were s.c. coinjected with 5 × 10⁶ HUH7.eGFP.ffLuc cells and 5 × 10⁵ GPC3-ENG (n = 5), GPC3-ENG.CD80 (n = 4), GPC3-ENG.41BBL (n = 5), GPC3-ENG.CD80+41BBL (n = 5), EGFRvIII-ENG (n = 5), or EGFRvIII-ENG.CD80+41BBL (n = 5) MSCs on their left lower flank. On day 7, mice received an i.v. dose of 1 × 10⁷ T cells. Tumor growth was followed by bioluminescence imaging. (A) Representative images of animals (red arrow: T cell injection). (B) Quantitative bioluminescence imaging results (solid lines: individual mice; radiance = photons/s/cm2/sr). (C) Kaplan-Meier survival curve (control versus treatment groups; *p < 0.05, **p < 0.01, ***p < 0.001).
Figure 7.

GPC3-ENG MSCs Have Anti-tumor Activity in Established Tumors
Mice were s.c. injected with 1 × 10⁶ HUH7.eGFP.ffLuc cells on their left lower flank (n = 10). On day 7, mice received a peritumoral injection of 1 × 10⁶ GPC3-ENG.MSC.CD80+41BBL. On day 10, five mice received an i.v. dose of 1 × 10⁷ T cells. Tumor-bearing mice injected with EGFRvIII-ENG MSC.CD80+41BBL (n = 5) or T cells (n = 5) served as controls. Tumor growth was followed by bioluminescence imaging. (A) Representative images of animals (green arrow: MSC injection; red arrow: T cell injection). (B) Quantitative bioluminescence imaging results (solid lines: individual mice; radiance = photons/s/cm2/sr). (C) Kaplan-Meier survival curve (control versus treatment groups; *p < 0.05).
Discussion
In this study, we describe the generation of GPC3-ENG MSCs and demonstrate that these cells redirect T cells to GPC3+ HCC (Figure S8). Modifying GPC3-ENG MSCs to express CD80 and 41BBL induced robust IL-2 production, T cell proliferation, and faster T cell killing of tumor cells in comparison to unmodified GPC3-ENG MSCs. In vivo GPC3-ENG MSCs ± costimulatory molecules had potent anti-tumor activity in an HCC xenograft model.
Several chemo- and irradiation-based therapies have been explored to improve outcomes for patients with advanced stage HCC in the last decade.17 Most of them have limited anti-tumor activity, best exemplified by sorafenib, the only Food and Drug Administration (FDA)-approved drug for the treatment of advanced stage HCC, which improves overall survival by only 2 months.18 Among different forms of cell therapies, the infusion of autologous, cytokine-activated killer (CIK) cells has been explored in numerous clinical studies for HCC.19 Although CIK cells prolong progression free and overall survival in the adjuvant setting, their antitumor activity as therapy has been limited.20 In addition, CIK cells have to be prepared for individual patients, potentially limiting their broader clinical use. The same limitations also apply to HCC-specific cell products, including GPC3-CAR T cells.
Bispecific antibodies, T cell ENG or BiTEs, that recognize a tumor associated antigen (TAA) and CD3 are attractive off-the-shelf products to redirect resident T cells to tumor cells.21 Targeting CD19+ hematological malignancies with CD19-specific BiTEs has been very successful in humans, leading to their FDA approval in 2014.22 In contrast, infusion of T cell ENG or BiTEs for solid tumors has been less effective. Lack of efficacy is most likely due to several factors, including limited tissue distribution and short half-life of the infused recombinant protein.23 Expressing T cell ENGs or BiTEs at tumor sites should potentially overcome this limitation.24 To accomplish this, we and others have expressed T cell ENGs or diabodies in autologous T cells (ENG T cells) that migrate to tumor sites post infusion.24, 25, 26, 27, 28 Although ENG T cells have potent antitumor activity in preclinical models, these cells still have to be prepared for individual patients.29 To overcome this limitation, we here now have explored the use of off-the-shelf MSCs to deliver GPC3-ENGs to HCC.
MSCs were readily transduced by lentiviral vectors encoding ENG molecules and GFP or retroviral vectors encoding costimulatory molecules, as judged by FACS analysis. Secretion of ENG molecules was confirmed by ELISA. Although GPC3-ENG MSCs redirected T cells to GPC3+ tumor cells (HUH7 and G401), as judged by IFNγ production, no IL-2 production was observed. This finding was consistent with our previous study, in which IL-2 production of CD19-ENG T cells was dependent on the presence of co-stimulatory molecules on the cell surface of tumor cells.26 Because HUH7 and G401 do not express co-stimulatory molecules, such as CD80 and 41BBL (data not shown), we expressed CD80 and/or 41BBL on the cell surface of GPC3-ENG MSCs. Expression of CD80 and 41BBL was required to induce IL-2 production by T cells in the presence of GPC3+ tumors. Thus, future studies are needed to understand the requirement of CD80 and 41BBL costimulation in our system because, in general, costimulation through CD80 alone is sufficient.30 Provision of costimulation has been shown to improve the killing capacity of T cells redirected with ENG molecules to tumor cells.31 Although G401 and HUH7 cells induced a similar amount of IFNγ and IL-2 production, HUH7 induced greater T cell proliferation than G401 cells; in addition, there were slight differences in the phenotype of expanded T cells. Cytokine production is one critical factor that determines T cell proliferation and phenotype. However, other factors also play a role, including the absence or presence of inhibitory molecules expressed (e.g., PD-L1) or secreted (e.g., transforming growth factor β [TGF-β]) by tumor cells. Further studies are needed to decipher differences between G401 and HUH7 cells.
Here, we show that costimulation also improves the killing kinetics of redirected T cells, highlighting another advantage of providing costimulation. However, after 24 and 48 hr, no significant killing difference in conditions ± costimulation was observed. This most likely is explained by assay differences (fluorescence microscopy versus luciferase based). In addition, after 48 hr, greater than 99% of target cells were killed for all GPC3-ENG MSC conditions tested. In our study, we expressed CD80 and 41BBL on the cell surface of MSCs. It might be advantageous to genetically modify MSCs to secrete fusion molecules that consist of a tumor-specific scFv and the extracellular domain costimulatory ligands32 so that T cells receive costimulation directly at the tumor cells. Future studies are planned to explore this approach.
In vivo, coinjection of tumor cells and GPC3-ENG MSCs followed by T cell injection on day 7 resulted in robust antitumor activity of GPC3-ENG MSCs. However, tumors eventually progressed. To understand the mechanisms of tumor progression, we determined the persistence of eGFP.ffLuc-expressing MSCs in vivo. MSCs persisted for less than 28 days (Figure S9), highlighting the need to administer multiple doses of MSCs. Although, in this “proof of concept” study, we did not explore multiple dosing schedules of MSCs, this is the goal of future studies. Provision of costimulation did not improve the anti-tumor activity of GPC3-ENG MSCs; indeed, expression of 41BBL decreased the antitumor activity of GPC3-ENG MSCs. Several factors have to be considered, including MSC and T cell dose, and experiments are in progress to address this. In addition, mechanistic studies in regards to the role of 41BBL in our system are needed. This should include studying the T cell infiltrate within tumors.
In our second in vivo model, we focused on the peritumoral injection of MSCs, because, as reported by others,33 systemic i.v. administration of human MSCs resulted in the trapping of MSCs in the lung of mice (Figure S10). Although we injected MSCs peritumoral, there could be an “abscopal effect” to distant tumor sites. We plan to explore this in future studies, in which mice will bear a second flank tumor that is not treated. Intra-arterial administration has been shown to significantly improve the systemic distribution of human MSCs in xenograft models34 and could be explored in future studies. However, at present, it is unclear if the observed biodistribution of human MSCs in mice closely mimics their biodistribution in humans.35 Moreover, the preferred route of GPC3-ENG MSC administration for HCC patients will most likely depend on the clinical scenario. For example, although i.v. administration would be ideal for the therapy of lung disease, the commonest site of HCC metastases,36 intra-arterial administration would be the route of choice for locally advanced stage disease, akin to trans-arterial chemo embolization (TACE), which is commonly used to deliver chemotherapeutic agents directly into locally advanced HCC.37
Our study significantly extends studies by others. Compte et al.38 genetically modified MSCs to express a CEA bispecific diabody, a bispecific mAb format that requires the expression of two genes. CEA bispecific diabody-secreting MSCs activated T cells, as evidenced by antigen-specific T cell proliferation. In vivo, implanted, MSC-seeded scaffolds supported diabody production and had antitumor activity in a colon cancer xenograft model. Aliperta et al.39 genetically modified the immortalized MSC line SCP-1 to express CD133-specific T cell ENG and 41BBL. CD133-ENG MSCs redirected T cells to CD133+ acute myeloid leukemia (AML) cells, and 41BBL expression enhanced cytokine production and T cell proliferation in vitro. Ex vivo treatment of AML cells with CD133-ENG MSC.41BBL and T cells prevented engraftment of AML cells in NSG mice.39 Like the two previous studies, our study is limited by relying on a xenograft model. Although these do not recapitulate the immunosuppressive microenvironment created by tumors, including HCC,40 they are ideal to study the interactions of human tumor cells, human MSCs, and human T cells, which is critical for future clinical development.
In summary, our study demonstrates that MSCs genetically modified to express GPC3-ENG ± costimulatory molecules redirect T cells to GPC3+ tumor cells and have potent antitumor activity. Thus, GPC3-ENG MSCs may be a promising “off-the-shelf cell therapy alternative” to current GPC3-targeted immunotherapy approaches that either rely on the passive infusion of antibodies or the adoptive transfer of autologous CAR T cells.
Materials and Methods
Cell Lines and Culture Conditions
G401 (rhabdoid tumor, ATCC) and HUH7 (hepatocellular carcinoma, a gift from Dr. Xiao-Tong Song, Baylor College of Medicine) were used as GPC3+ targets. The identity of HUH7 was confirmed by the Characterized Cell Line Core Facility at MD Anderson Cancer Center. A549 (lung carcinoma, ATCC) cells were used as negative controls. 293T cells (ATCC) were used for packaging viral vectors. HUH7, A549, and 293T cell lines were grown in DMEM (Thermo Scientific), G401 in alpha-MEM (Thermo Scientific) media supplemented with 10%–20% fetal bovine serum (FBS) (Thermo Scientific), and 2 mmol/L GlutaMAX-I (Invitrogen). The generation of eGFP.ffLuc-expressing HUH7, G401 and A549 cells has been previously described.8 Human MSCs from healthy donors were obtained under a Baylor College of Medicine institutional review board (IRB)-approved protocol after informed consent was obtained in accordance to the Declaration of Helsinki. MSCs were cultured in αMEM (Lonza) supplemented with 20% FBS (Thermo Scientific) and 2 mmol/L GlutaMAX-I (Invitrogen; complete αMEM).
Construction of Viral Vectors Encoding T Cell ENG and Costimulatory Molecules
To generate a GPC3-specific T cell ENG molecule, a mini gene encoding the immunoglobulin (Ig) heavy-chain leader peptide and the GPC3-specific scFv (GC33) was synthesized by Thermo Fisher Scientific.41 This mini gene was subcloned into an SFG retroviral vector containing a short serine-glycine linker and a CD3-specific scFV derived from OKT3.24 The GPC3-ENG was then subcloned into pCDH-CMV-MCS-EF1-GFP (System Biosciences). The lentiviral vector encoding the EGFRvIII-specific T cell ENG was generated in a similar fashion using the EGFRvIII-specific scFv 139.42 Lentiviral particles were generated in 293T cells using packaging plasmids (pPACK Lentivector Packaging System, System Biosciences) according to the manufacturer’s instructions. MSCV retroviral vectors encoding CD80, 41BBL, or 41BBL and CD80 were generated by subcloning CD80 from pORF.CD80 (InvivoGen) and/or 41BBL from pORF.41BBL (InvivoGen) into MSCV-I-GFP(M) (provided by the late Elio Vanin, Northwestern University Feinberg School of Medicine). VSV-G-pseudotyped retroviral particles were generated as previously described.43
Generation of Genetically Modified MSCs
MSCs were grown to 60%–70% confluency in T75 flasks and transduced with viral vectors at an MOI of 10 and 4 μg/mL polybrene (Sigma-Aldrich). After transduction, MSC were expanded for 3–5 days prior to use.
Flow Cytometric Analysis
20,000 cells per sample were analyzed by a FACSCalibur instrument (BD Biosciences) using Cell Quest Software (BD Biosciences) and a BD Canto II instrument (BD Biosciences) using FACSDiva software (BD Biosciences) and analyzed using Kaluza Analysis 1.3 (Beckman Coulter) and FlowJo v10 (FlowJo LLC). For phenotyping MSCs, the following MAbs were used: CD105-PE (Miltenyi Biotec), CD45-PerCP and CD90-APC (BD Biosciences), 41BBL-PE (BD Biosciences), and CD80-PerCP (eBioscience). For phenotyping T cells, the following MAbs were used: CD3-APC, CD4-PE, CD8-APC, CCR7-FITC, and CD45RA-APC (all BD Biosciences). GPC3 expression of tumor cell lines was detected with YP7 mAb, which was provided by Mitchell Ho (NIH).44 Isotype controls included IgG1-PE, IgG1-PerCP, and IgG1-APC (both from BD Biosciences). Absolute T cell numbers were calculated using CountBright Absolute Counting Beads (Thermo Fisher Scientific).
ELISA
NT and GPC3-ENG ± costimulatory molecules MSCs were plated in a 12-well plate at a concentration of 5 × 10⁴/well in 2 mL of complete αMEM and cultured for 24 hr. To determine the ENG concentration in conditioned media, we first coated 96-well non-tissue culture treated plates with human recombinant GPC3 protein (R&D Systems) at 10 ng/well. Media from ENG-MSCs was plated and allowed to incubate for 1 hr at room temperature (RT). Goat anti-mouse F(ab’) (Jackson ImmunoResearch) was added and incubated at RT for 1 hr. The plate was washed, and secondary anti-goat horseradish peroxidase (HRP) antibody (Jackson ImmunoResearch) was added. After 1 hr incubation at RT, the plate was washed and developing agent was added (tetramethylbenzidine [TMB] substrate, Sigma-Aldrich). Absorbance was read at 450 nm. A standard curve was generated using recombinant GPC3-ENG protein (custom synthesis; Thermo Fisher Scientific).
Coculture Assays
GPC3-ENG MSCs ± costimulatory molecules and EGFRvIII-ENG MSCs were plated at a 1:3 or 1:10 ratio with GPC3+ (HUH7 and G401) or GPC3− (A549) target cells. T cells, isolated from peripheral blood mononuclear cells (PBMCs) by CD3 selection (Miltenyi), were added at a 10:1 effector to target ratio. Coculture supernatant was collected after 48 hr and used for cytokine analysis. IFNγ and IL-2 concentrations were determined using ELISA kits (R&D Systems), according to the manufacturer’s instructions.
Cytotoxicity Assay
Cytotoxic activity of T cells against targets was determined by a luciferase-based cytotoxicity assay. HUH7, G401, and A549 cells expressing eGFP/ffLuc were plated in 96-well flat bottom plates at a concentration of 1 × 10⁴ cells/well in triplicates. GPC3-ENG MSCs ± costimulatory molecules and EGFRvIII-ENG MSCs were plated at a 1:10 MSC to tumor cell ratio, and T cells, isolated from PBMCs by CD3 selection (Miltenyi), were added at a 10:1 effector to target ratio. Wells without MSCs served as controls. After 24 hr, luciferase activity was determined using a luciferase assay kit according to the manufacturer’s instructions (Promega) and an Infinite M200 luminometer (Tecan Trading AG).
Time-Lapse Confocal Microscopic Imaging and Image Analysis
MSC-induced target cell killing was quantitatively analyzed by a spinning disk confocal microscope (Zeiss) equipped with a CSU-X1A 5000 spinning disk unit (Yokogowa Electric Corporation) multi-laser module with wavelengths of 458 nM, 488 nM, and 514 nM and an Axio Observer Z1 motorized inverted microscope equipped with a precision motorized XY stage (Carl Zeiss MicroImaging). Temperature was maintained at 37°C and 5% CO2 using an environmental control chamber. Zen 2012 software (Zeiss) was used to acquire images in time-lapse mode using a Zeiss Plan-Neofluar 20 × 0.4 NA objective on an Orca R2 CCD camera and to analyze average GFP and PI intensity. A quantitative digital image processing pipeline, created in ImageJ (W.S. Rasband, NIH [1997–2014]), was used to calculate specific PI incorporation of HUH7 and A549 cells. First, background intensities of PI channel were subtracted; then, raw images were thresholded based on their intensity histogram. The same threshold was used on all analyzed images. PI incorporation was determined as a multiplication of the mean pixel intensity and thresholded area.
In Vivo Experiments
Animal experiments were performed on a protocol approved by the Baylor College of Medicine Institutional Animal Care and Use Committee in accordance with the American Association for Laboratory Animal Science. Co-injection of tumor cells and MSCs: 8- to 10-week-old NSG mice (NOD.Cg-Prkdcscid/Il2rgtm1Wjl/SzJ; JAX Mice) were s.c. injected with 5 × 10⁶ HUH7.eGFP.ffLuc cells and 5 × 10⁵ gene-modified MSCs on their left lower flank. On day 7, mice were injected i.v. with 1 × 10⁷ T cells. Sequential injection of tumor cells and MSCs: 1 × 10⁶ HUH7.eGFP.ffLuc cells were injected s.c. on day 0, and 1 × 10⁶ gene-modified MSCs were injected peritumoral on day 7. On day 7, mice were injected i.v. with 1 × 10⁷ T cells. To generate sufficient T cells for in vivo experiments, T cells were activated from PBMCs with OKT3 (CRL-8001, ATCC) and CD28 (BD Biosciences) antibodies and expanded with recombinant human IL-7 and IL-15 (IL-7, 10 ng/mL; IL-15, 5 ng/mL; Proleukin; Chiron) for 7–10 days. Mice were imaged using the IVIS system (IVIS, Xenogen), as previously described,45 and euthanized at predefined endpoints or when they met euthanasia criteria in accordance with the Center for Comparative Medicine at Baylor College of Medicine.
Statistical Analysis
GraphPad Prism 5 software (GraphPad) was used for statistical analysis. Data were presented as mean ± SD or SEM. For comparison between two groups, a two-tailed t test was used. For comparisons of three or more groups, one-way ANOVA with Bonferroni’s post-test was used. For comparison of PI incorporation, linear regression analysis was performed. For the mouse experiments, survival, determined from the time of tumor cell injection, was analyzed by the Kaplan-Meier method and log-rank test.
Author Contributions
A.S. and S.G. designed the study. A.S., A.V., M.P.V., D.L.G., D.T., and A.H. performed experiments. Z.M. and A.G. provided reagents. All authors contributed to data analysis and manuscript preparation.
Conflicts of Interest
M.P.V., A.H., and S.G. have patent applications in the fields of T cell and/or gene therapy for cancer.
Acknowledgments
The authors would like to thank Dr. Malcolm Brenner (Center for Cell and Gene Therapy, Baylor College of Medicine, Houston, TX) for helpful discussions and advice. This work was supported by NIH grants P01CA094237 and 2 P30 CA125123-09. A.S. was supported by the Hungarian Talent Program (NTP-NFTÖ-16-0912).
Footnotes
Supplemental Information includes ten figures and two movies and can be found with this article online at http://dx.doi.org/10.1016/j.omto.2017.07.002.
Supplemental Information
Time-lapse confocal microscopy video (quantitative data is presented in Fig. 6B). GPC3-ENG MSCs.CD80+41BBL (green) redirect T cells to kill GPC3+ cancer cells (HUH7) as judged by PI incorporation. Images were acquired every 5 minutes; video length: 12 h.
Time-lapse confocal microscopy video (quantitative data is presented in Fig. 6B). GPC3-ENG MSCs.CD80+41BBL (green) do not redirect T cells to kill GPC3− cancer cells (A549) as judged by PI incorporation. Images were acquired every 5 minutes; video length: 12 h.
References
- 1.El-Serag H.B. Surveillance for hepatocellular carcinoma: long way to achieve effectiveness. Dig. Dis. Sci. 2012;57:3050–3051. doi: 10.1007/s10620-012-2413-z. [DOI] [PubMed] [Google Scholar]
- 2.Nakatsura T., Yoshitake Y., Senju S., Monji M., Komori H., Motomura Y., Hosaka S., Beppu T., Ishiko T., Kamohara H. Glypican-3, overexpressed specifically in human hepatocellular carcinoma, is a novel tumor marker. Biochem. Biophys. Res. Commun. 2003;306:16–25. doi: 10.1016/s0006-291x(03)00908-2. [DOI] [PubMed] [Google Scholar]
- 3.Filmus J. Glypicans in growth control and cancer. Glycobiology. 2001;11:19R–23R. doi: 10.1093/glycob/11.3.19r. [DOI] [PubMed] [Google Scholar]
- 4.Capurro M.I., Xiang Y.Y., Lobe C., Filmus J. Glypican-3 promotes the growth of hepatocellular carcinoma by stimulating canonical Wnt signaling. Cancer Res. 2005;65:6245–6254. doi: 10.1158/0008-5472.CAN-04-4244. [DOI] [PubMed] [Google Scholar]
- 5.Baumhoer D., Tornillo L., Stadlmann S., Roncalli M., Diamantis E.K., Terracciano L.M. Glypican 3 expression in human nonneoplastic, preneoplastic, and neoplastic tissues: a tissue microarray analysis of 4,387 tissue samples. Am. J. Clin. Pathol. 2008;129:899–906. doi: 10.1309/HCQWPWD50XHD2DW6. [DOI] [PubMed] [Google Scholar]
- 6.Zhu A.X., Gold P.J., El-Khoueiry A.B., Abrams T.A., Morikawa H., Ohishi N., Ohtomo T., Philip P.A. First-in-man phase I study of GC33, a novel recombinant humanized antibody against glypican-3, in patients with advanced hepatocellular carcinoma. Clin. Cancer Res. 2013;19:920–928. doi: 10.1158/1078-0432.CCR-12-2616. [DOI] [PubMed] [Google Scholar]
- 7.Dargel C., Bassani-Sternberg M., Hasreiter J., Zani F., Bockmann J.H., Thiele F., Bohne F., Wisskirchen K., Wilde S., Sprinzl M.F. T cells engineered to express a T-cell receptor specific for Glypican-3 to recognize and kill hepatoma cells in vitro and in mice. Gastroenterology. 2015;149:1042–1052. doi: 10.1053/j.gastro.2015.05.055. [DOI] [PubMed] [Google Scholar]
- 8.Li W., Guo L., Rathi P., Marinova E., Gao X., Wu M.F., Liu H., Dotti G., Gottschalk S., Metelitsa L.S. Redirecting T cells to Glypican-3 with 4-1BB.zeta CAR results in Th-1 polarization and potent anti-tumor activity. Hum. Gene Ther. 2016;28:437–448. doi: 10.1089/hum.2016.025. [DOI] [PMC free article] [PubMed] [Google Scholar]
- 9.Gao H., Li K., Tu H., Pan X., Jiang H., Shi B., Kong J., Wang H., Yang S., Gu J. Development of T cells redirected to glypican-3 for the treatment of hepatocellular carcinoma. Clin. Cancer Res. 2014;20:6418–6428. doi: 10.1158/1078-0432.CCR-14-1170. [DOI] [PubMed] [Google Scholar]
- 10.Ryan J.M., Barry F.P., Murphy J.M., Mahon B.P. Mesenchymal stem cells avoid allogeneic rejection. J. Inflamm. (Lond.) 2005;2:8. doi: 10.1186/1476-9255-2-8. [DOI] [PMC free article] [PubMed] [Google Scholar]
- 11.Kidd S., Spaeth E., Dembinski J.L., Dietrich M., Watson K., Klopp A., Battula V.L., Weil M., Andreeff M., Marini F.C. Direct evidence of mesenchymal stem cell tropism for tumor and wounding microenvironments using in vivo bioluminescent imaging. Stem Cells. 2009;27:2614–2623. doi: 10.1002/stem.187. [DOI] [PMC free article] [PubMed] [Google Scholar]
- 12.Studeny M., Marini F.C., Champlin R.E., Zompetta C., Fidler I.J., Andreeff M. Bone marrow-derived mesenchymal stem cells as vehicles for interferon-beta delivery into tumors. Cancer Res. 2002;62:3603–3608. [PubMed] [Google Scholar]
- 13.Studeny M., Marini F.C., Dembinski J.L., Zompetta C., Cabreira-Hansen M., Bekele B.N., Champlin R.E., Andreeff M. Mesenchymal stem cells: potential precursors for tumor stroma and targeted-delivery vehicles for anticancer agents. J. Natl. Cancer Inst. 2004;96:1593–1603. doi: 10.1093/jnci/djh299. [DOI] [PubMed] [Google Scholar]
- 14.Loebinger M.R., Eddaoudi A., Davies D., Janes S.M. Mesenchymal stem cell delivery of TRAIL can eliminate metastatic cancer. Cancer Res. 2009;69:4134–4142. doi: 10.1158/0008-5472.CAN-08-4698. [DOI] [PMC free article] [PubMed] [Google Scholar]
- 15.Attar R., Sajjad F., Qureshi M.Z., Tahir F., Hussain E., Fayyaz S., Farooqi A.A. TRAIL based therapy: overview of mesenchymal stem cell based delivery and miRNA controlled expression of TRAIL. Asian Pac. J. Cancer Prev. 2014;15:6495–6497. doi: 10.7314/apjcp.2014.15.16.6495. [DOI] [PubMed] [Google Scholar]
- 16.Bayo J., Real A., Fiore E.J., Malvicini M., Sganga L., Bolontrade M., Andriani O., Bizama C., Fresno C., Podhajcer O. IL-8, GRO and MCP-1 produced by hepatocellular carcinoma microenvironment determine the migratory capacity of human bone marrow-derived mesenchymal stromal cells without affecting tumor aggressiveness. Oncotarget. 2016 doi: 10.18632/oncotarget.10288. Published online June 25, 2016. [DOI] [PMC free article] [PubMed] [Google Scholar]
- 17.Qin S., Cheng Y., Liang J., Shen L., Bai Y., Li J., Fan J., Liang L., Zhang Y., Wu G. Efficacy and safety of the FOLFOX4 regimen versus doxorubicin in Chinese patients with advanced hepatocellular carcinoma: a subgroup analysis of the EACH study. Oncologist. 2014;19:1169–1178. doi: 10.1634/theoncologist.2014-0190. [DOI] [PMC free article] [PubMed] [Google Scholar]
- 18.Cheng A.L., Kang Y.K., Chen Z., Tsao C.J., Qin S., Kim J.S., Luo R., Feng J., Ye S., Yang T.S. Efficacy and safety of sorafenib in patients in the Asia-Pacific region with advanced hepatocellular carcinoma: a phase III randomised, double-blind, placebo-controlled trial. Lancet Oncol. 2009;10:25–34. doi: 10.1016/S1470-2045(08)70285-7. [DOI] [PubMed] [Google Scholar]
- 19.Wang H., Liu A., Bo W., Feng X., Hu Y., Tian L., Zhang H., Tang X. Adjuvant immunotherapy with autologous cytokine-induced killer cells for hepatocellular carcinoma patients after curative resection, a systematic review and meta-analysis. Dig. Liver Dis. 2016;48:1275–1282. doi: 10.1016/j.dld.2016.07.010. [DOI] [PubMed] [Google Scholar]
- 20.Lee J.H., Lee J.H., Lim Y.S., Yeon J.E., Song T.J., Yu S.J., Gwak G.Y., Kim K.M., Kim Y.J., Lee J.W. Adjuvant immunotherapy with autologous cytokine-induced killer cells for hepatocellular carcinoma. Gastroenterology. 2015;148:1383–1391.e6. doi: 10.1053/j.gastro.2015.02.055. [DOI] [PubMed] [Google Scholar]
- 21.Reichert J.M. Antibodies to watch in 2015. MAbs. 2015;7:1–8. doi: 10.4161/19420862.2015.988944. [DOI] [PMC free article] [PubMed] [Google Scholar]
- 22.Sanford M. Blinatumomab: first global approval. Drugs. 2015;75:321–327. doi: 10.1007/s40265-015-0356-3. [DOI] [PubMed] [Google Scholar]
- 23.Hemmerle T., Wulhfard S., Neri D. A critical evaluation of the tumor-targeting properties of bispecific antibodies based on quantitative biodistribution data. Protein Eng. Des. Sel. 2012;25:851–854. doi: 10.1093/protein/gzs061. [DOI] [PubMed] [Google Scholar]
- 24.Iwahori K., Kakarla S., Velasquez M.P., Yu F., Yi Z., Gerken C., Song X.T., Gottschalk S. Engager T cells: a new class of antigen-specific T cells that redirect bystander T cells. Mol. Ther. 2015;23:171–178. doi: 10.1038/mt.2014.156. [DOI] [PMC free article] [PubMed] [Google Scholar]
- 25.Compte M., Blanco B., Serrano F., Cuesta A.M., Sanz L., Bernad A., Holliger P., Alvarez-Vallina L. Inhibition of tumor growth in vivo by in situ secretion of bispecific anti-CEA x anti-CD3 diabodies from lentivirally transduced human lymphocytes. Cancer Gene Ther. 2007;14:380–388. doi: 10.1038/sj.cgt.7701021. [DOI] [PubMed] [Google Scholar]
- 26.Velasquez M.P., Torres D., Iwahori K., Kakarla S., Arber C., Rodriguez-Cruz T., Szoor A., Bonifant C.L., Gerken C., Cooper L.J. T cells expressing CD19-specific engager molecules for the immunotherapy of CD19-positive malignancies. Sci. Rep. 2016;6:27130. doi: 10.1038/srep27130. [DOI] [PMC free article] [PubMed] [Google Scholar]
- 27.Bonifant C.L., Szoor A., Torres D., Joseph N., Velasquez M.P., Iwahori K., Gaikwad A., Nguyen P., Arber C., Song X.T. CD123-engager T cells as a novel immunotherapeutic for acute myeloid leukemia. Mol. Ther. 2016;24:1615–1626. doi: 10.1038/mt.2016.116. [DOI] [PMC free article] [PubMed] [Google Scholar]
- 28.Liu X., Barrett D.M., Jiang S., Fang C., Kalos M., Grupp S.A., June C.H., Zhao Y. Improved anti-leukemia activities of adoptively transferred T cells expressing bispecific T-cell engager in mice. Blood Cancer J. 2016;6:e430. doi: 10.1038/bcj.2016.38. [DOI] [PMC free article] [PubMed] [Google Scholar]
- 29.Sharpe M., Mount N. Genetically modified T cells in cancer therapy: opportunities and challenges. Dis. Model. Mech. 2015;8:337–350. doi: 10.1242/dmm.018036. [DOI] [PMC free article] [PubMed] [Google Scholar]
- 30.Chen L., Ashe S., Brady W.A., Hellström I., Hellström K.E., Ledbetter J.A., McGowan P., Linsley P.S. Costimulation of antitumor immunity by the B7 counterreceptor for the T lymphocyte molecules CD28 and CTLA-4. Cell. 1992;71:1093–1102. doi: 10.1016/s0092-8674(05)80059-5. [DOI] [PubMed] [Google Scholar]
- 31.Arndt C., Feldmann A., von Bonin M., Cartellieri M., Ewen E.M., Koristka S., Michalk I., Stamova S., Berndt N., Gocht A. Costimulation improves the killing capability of T cells redirected to tumor cells expressing low levels of CD33: description of a novel modular targeting system. Leukemia. 2014;28:59–69. doi: 10.1038/leu.2013.243. [DOI] [PubMed] [Google Scholar]
- 32.Hornig N., Kermer V., Frey K., Diebolder P., Kontermann R.E., Müller D. Combination of a bispecific antibody and costimulatory antibody-ligand fusion proteins for targeted cancer immunotherapy. J. Immunother. 2012;35:418–429. doi: 10.1097/CJI.0b013e3182594387. [DOI] [PubMed] [Google Scholar]
- 33.Schrepfer S., Deuse T., Reichenspurner H., Fischbein M.P., Robbins R.C., Pelletier M.P. Stem cell transplantation: the lung barrier. Transplant. Proc. 2007;39:573–576. doi: 10.1016/j.transproceed.2006.12.019. [DOI] [PubMed] [Google Scholar]
- 34.Kean T.J., Lin P., Caplan A.I., Dennis J.E. MSCs: delivery routes and engraftment, cell-targeting strategies, and immune modulation. Stem Cells Int. 2013;2013:732742. doi: 10.1155/2013/732742. [DOI] [PMC free article] [PubMed] [Google Scholar]
- 35.Leibacher J., Henschler R. Biodistribution, migration and homing of systemically applied mesenchymal stem/stromal cells. Stem Cell Res. Ther. 2016;7:7. doi: 10.1186/s13287-015-0271-2. [DOI] [PMC free article] [PubMed] [Google Scholar]
- 36.Katyal S., Oliver J.H., 3rd, Peterson M.S., Ferris J.V., Carr B.S., Baron R.L. Extrahepatic metastases of hepatocellular carcinoma. Radiology. 2000;216:698–703. doi: 10.1148/radiology.216.3.r00se24698. [DOI] [PubMed] [Google Scholar]
- 37.Andreana L., Isgrò G., Marelli L., Davies N., Yu D., Navalkissoor S., Burroughs A.K. Treatment of hepatocellular carcinoma (HCC) by intra-arterial infusion of radio-emitter compounds: trans-arterial radio-embolisation of HCC. Cancer Treat. Rev. 2012;38:641–649. doi: 10.1016/j.ctrv.2011.11.004. [DOI] [PubMed] [Google Scholar]
- 38.Compte M., Cuesta A.M., Sánchez-Martín D., Alonso-Camino V., Vicario J.L., Sanz L., Alvarez-Vallina L. Tumor immunotherapy using gene-modified human mesenchymal stem cells loaded into synthetic extracellular matrix scaffolds. Stem Cells. 2009;27:753–760. doi: 10.1634/stemcells.2008-0831. [DOI] [PMC free article] [PubMed] [Google Scholar]
- 39.Aliperta R., Cartellieri M., Feldmann A., Arndt C., Koristka S., Michalk I., von Bonin M., Ehninger A., Bachmann J., Ehninger G. Bispecific antibody releasing-mesenchymal stromal cell machinery for retargeting T cells towards acute myeloid leukemia blasts. Blood Cancer J. 2015;5:e348. doi: 10.1038/bcj.2015.73. [DOI] [PMC free article] [PubMed] [Google Scholar]
- 40.Newell P., Villanueva A., Friedman S.L., Koike K., Llovet J.M. Experimental models of hepatocellular carcinoma. J. Hepatol. 2008;48:858–879. doi: 10.1016/j.jhep.2008.01.008. [DOI] [PMC free article] [PubMed] [Google Scholar]
- 41.Ishiguro T., Sugimoto M., Kinoshita Y., Miyazaki Y., Nakano K., Tsunoda H., Sugo I., Ohizumi I., Aburatani H., Hamakubo T. Anti-glypican 3 antibody as a potential antitumor agent for human liver cancer. Cancer Res. 2008;68:9832–9838. doi: 10.1158/0008-5472.CAN-08-1973. [DOI] [PubMed] [Google Scholar]
- 42.Weber, R., Feng, X. Foord, O., Green, L., Guda, J.M., Keyt, B., Liu, Y., Rathanaswami, P., Raya, R., Dong, X., et al. December 8, 2009. Antibodies directed to the deletion mutants of epidermal growth factor receptor and uses thereof. U.S. patent 7628986.
- 43.Chow K.K., Naik S., Kakarla S., Brawley V.S., Shaffer D.R., Yi Z., Rainusso N., Wu M.F., Liu H., Kew Y. T cells redirected to EphA2 for the immunotherapy of glioblastoma. Mol. Ther. 2013;21:629–637. doi: 10.1038/mt.2012.210. [DOI] [PMC free article] [PubMed] [Google Scholar]
- 44.Phung Y., Gao W., Man Y.G., Nagata S., Ho M. High-affinity monoclonal antibodies to cell surface tumor antigen glypican-3 generated through a combination of peptide immunization and flow cytometry screening. MAbs. 2012;4:592–599. doi: 10.4161/mabs.20933. [DOI] [PMC free article] [PubMed] [Google Scholar]
- 45.Shaffer D.R., Savoldo B., Yi Z., Chow K.K., Kakarla S., Spencer D.M., Dotti G., Wu M.F., Liu H., Kenney S. T cells redirected against CD70 for the immunotherapy of CD70-positive malignancies. Blood. 2011;117:4304–4314. doi: 10.1182/blood-2010-04-278218. [DOI] [PMC free article] [PubMed] [Google Scholar]
Associated Data
This section collects any data citations, data availability statements, or supplementary materials included in this article.
Supplementary Materials
Time-lapse confocal microscopy video (quantitative data is presented in Fig. 6B). GPC3-ENG MSCs.CD80+41BBL (green) redirect T cells to kill GPC3+ cancer cells (HUH7) as judged by PI incorporation. Images were acquired every 5 minutes; video length: 12 h.
Time-lapse confocal microscopy video (quantitative data is presented in Fig. 6B). GPC3-ENG MSCs.CD80+41BBL (green) do not redirect T cells to kill GPC3− cancer cells (A549) as judged by PI incorporation. Images were acquired every 5 minutes; video length: 12 h.