Abstract
Recent topography measurements of gypsum dissolution have not reported the absolute dissolution rates, but instead focus on the rates of formation and growth of etch pits. In this study, the in situ absolute retreat rates of gypsum (010) cleavage surfaces at etch pits, at cleavage steps, and at apparently defect-free portions of the surface are measured in flowing water by reflection digital holographic microscopy. Observations made on randomly sampled fields of view on seven different cleavage surfaces reveal a range of local dissolution rates, the local rate being determined by the topographical features at which material is removed. Four characteristic types of topographical activity are observed: 1) smooth regions, free of etch pits or other noticeable defects, where dissolution rates are relatively low; 2) shallow, wide etch pits bounded by faceted walls which grow gradually at rates somewhat greater than in smooth regions; 3) narrow, deep etch pits which form and grow throughout the observation period at rates that exceed those at the shallow etch pits; and 4) relatively few, submicrometer cleavage steps which move in a wave-like manner and yield local dissolution fluxes that are about five times greater than at etch pits. Molar dissolution rates at all topographical features except submicrometer steps can be aggregated into a continuous, mildly bimodal distribution with a mean of 3.0 µmolm−2 s−1 and a standard deviation of 0.7 µmolm−2 s−1.
Keywords: Gypsum, Digital holographic microscopy, Dissolution kinetics
1. Introduction
Mineral dissolution governs many geochemically- and environmen- tally-relevant processes, both in natural and man-made systems (Lüttge, 2006). Among the rock forming minerals, gypsum (CaSO4 2H2O) and related calcium sulfate minerals, such as bassanite (CaSO4·½H2O) and anhydrite (CaSO4), are abundant in nature, with extensive deposits underlying an estimated 25% of Earth's surface (Ford and William, 2007). Therefore, knowledge of water-gypsum interactions is important in many fields of inquiry, including geochemistry, materials science, soil science, and environmental science. A quantitative, mechanistic understanding of gypsum behavior in contact with aqueous solutions is also relevant for predicting the evolution of the wide areas of gypsum karsts, their instability, and their potential for collapse (Jeschke et al., 2001). In addition, the presence of calcium and sulfate ions in water influences the dissolution of other minerals that contain toxic metals (Kuechler et al., 2004), thereby potentially affecting the quality of drinking water (Raines and Dewers, 1997).
Traditional methods for measuring mineral dissolution rates focus on average bulk dissolution behavior, using batch and column experiments on particulate suspensions (Zhang and Nancollas, 1990; Singh and Bajwa, 1990), as well as techniques with controlled mass transport conditions, such as the rotating disk method and channel flow cells (Maclnnis and Brantley, 1993; Burns et al., 2003; Brown et al., 1993; Compton and Daly, 1987; Svensson and Dreybrodt, 1992; Liu and Nancollas, 1971). More recent techniques focus on characterizing microscopic kinetic processes at surfaces. Among these are atomic force microscopy (AFM) (e.g., Cama et al., 2010; Chow et al., 2012; Jordan and Rammensee, 1998; Ruiz-Agudo et al., 2011) scanning force microscopy (SFM) (e.g., Bosbach et al., 1995; Bosbach and Rammensee, 1994; Hall and Cullen, 1996) scanning electrochemical microscopy (SECM) (e.g., Macpherson and Unwin, 1995; McGeouch et al., 2012) vertical scanning interferometry (VSI) (e.g., Arvidson et al., 2003; Asta et al., 2008; Kumar et al., 2013; Lasaga and Lüttge, 2001; Lüttge, 2006; Lüttge et al., 1999) and, more recently, digital holographic microscopy (DHM) (Brand et al., 2017; Abbott et al., 2013).
All of these more recent techniques are able to resolve nanoscale differences in surface elevation from one image pixel to another, and can provide insights about dissolution mechanisms that would be inaccessible using traditional bulk techniques (Lüttge and Arvidson, 2010). Recent investigations with such techniques have revealed how intrinsic heterogeneity within a crystalline solid manifests itself as a distribution or spectrum of dissolution rates (Fischer et al., 2012; 2014, 2015; Lüttge et al., 2013; Emmanuel, 2014; Fischer and Lüttge, 2017; Brand et al., 2017; Saldi, 2017), thereby demonstrating that rate kinetics are poorly described by a single or average value.
Although microscopic methods have been used to observe topography changes at gypsum surfaces, absolute dissolution fluxes at gypsum surfaces by in situ topographic measurements have not been reported previously. Instead, the dissolution process has been characterized in terms of the formation of etch pits or the movement of stepwaves. Nearly all topographic studies of gypsum dissolution, including this one, are made on the (010) cleavage plane because it is easy to produce as a flat surface with relatively few visible surface features. Bosbach and Rammensee (1994) and Hall and Cullen (1996) observed by SFM that growth and dissolution on (010) gypsum surfaces is a layer-by-layer process. Later, Bosbach et al. (1995) used SFM observations to conclude that gypsum (010) dissolves primarily by movement of molecular-scale steps parallel to the cleaved surface (Process I) and formation of terrace vacancies (Process II). That study rarely observed deep etch pits (Process III), which the authors attributed to screw dislocations intersecting the surface. Shindo et al. (1996) reported AFM observations of layer-by-layer dissolution of (010) anhydrite by the nucleation, growth, and coalescence of rectangular terraces. Peruffo et al. (2013) used AFM to link direction-specific microscopic fluxes, local mass transport effects and global macroscopic rates from analysis of etch pits formed in gypsum surfaces within the first 100 s of contact with water. Fan and Teng (2007) reported in situ AFM observations, using a fluid cell, of anisotropy in step velocity and an absence of deep etch pits. A complementary in situ AFM study by Burgos-Cara et al. (2016) evaluated the effects of ions in solution on the dissolution of gypsum.
In contrast to VSI and AFM, DHM offers a unique opportunity to measure in situ changes in nanoscale surface topography in real time as a solid dissolves in an aqueous solution (Brand et al., 2017). Holographic interferometry has been recognized as a valuable tool in solution chemistry since 1967 (Knox et al., 1967). In particular, in transmission mode it has been used to monitor the changes in concentration field within a solution near a dissolving solid surface to characterize the dissolution rate (Colombani et al., 1998; Colombani and Bert, 2007; Colombani, 2008; Pachon-Rodriguez and Combani, 2013). Reflection DHM in the present study is used to monitor the topography of the dissolving surface itself in real time. DHM is an optical interferometric method that splits a monochromatic coherent light source into a reference beam and an object beam, similar to scanning interferometry except that a digital CCD camera records the interference patterns as a full image hologram (Kim, 2010). The holograms are then numerically reconstructed to produce images of amplitude and phase, the latter of which can be converted to height data with potentially sub-nanometer vertical resolution (Kühn et al., 2008). The advantage of DHM for rate spectra measurement is that it can collect full-frame in situ measurements with a rapid acquisition rate that is limited only by the shutter speed of the CCD camera that collects the holograms.
This paper describes measurements by DHM of absolute dissolution rates at (010) gypsum cleavage surfaces submerged in pure flowing water. The real-time observations enable the spectrum of observed rates to be linked directly to the evolution of different topographical features on the surface, including deep or shallow etch pits, defect-free regions, and migrating steps with heights of about 100 nm.
2. Materials and methods
2.1. Materials
Freshly cleaved (010) surfaces of optically clear, single crystal gypsum (selenite from Washington County, Utah, USA) were used for all the dissolution experiments. The dimensions of the specimens were on the order of several millimeters.
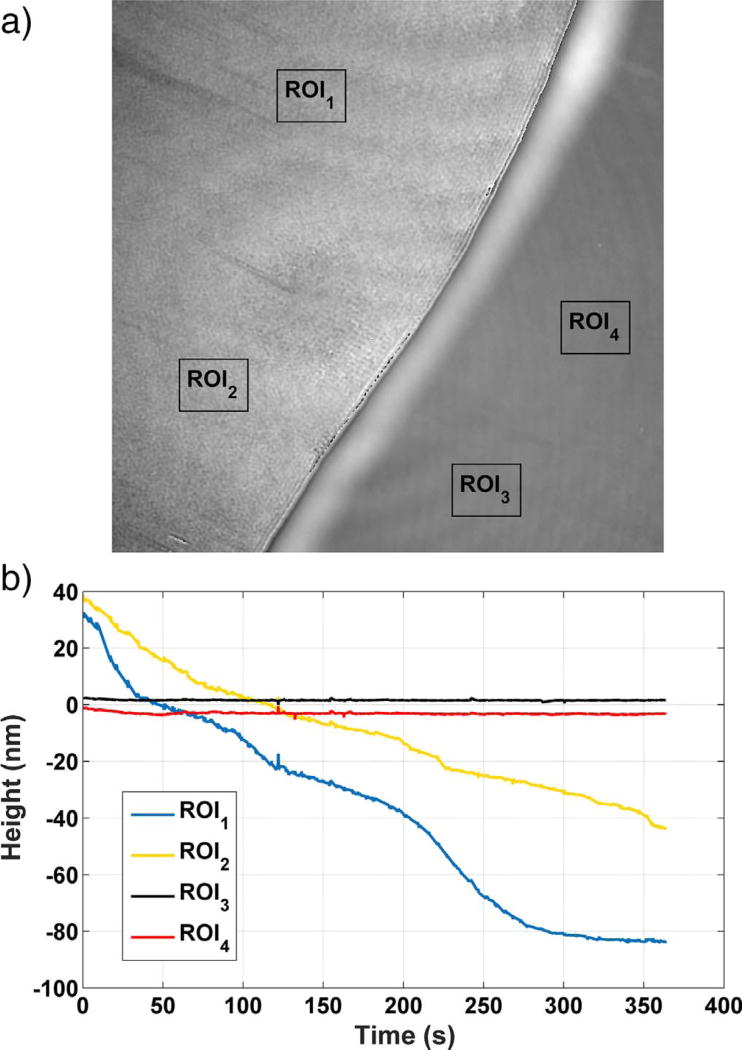
Measurements of absolute dissolution rate requires the availability of a reference plane that does not change in elevation during the experiment. This was accomplished by physical vapor deposition of 50 nm of chromium onto a portion of the surface. Chromium was used because it was observed to provide better adhesion to the gypsum surface than gold, platinum, Al2O3, SiO2, or any of several thin polymer coatings that were tried. The chromium provides an inert, nominally flat (a few nanometers roughness), and reflective reference plane from which the relative phase (height) differences of the uncoated surface can be computed (see Fig. 1 (a)).
Fig. 1.
(a) A phase map of a gypsum surface at the start of an experiment, showing the chromium mask on the right and the gypsum (010) surface on the left. (b) Time dependence of the height in two regions of interest (ROIs) marked on the gypsum surface as ROI1 and ROI2, and of two regions on the chromium mask marked as ROI3 and ROI4. Each of the ROIs has edge dimensions of 10 µm. Uncertainty in the individual height measurements along a profile is characterized by the temporal standard deviation of the measurement on a single pixel, 2 nm.
Deionized water with initial resistivity of 0.18 MΩ m was used in all experiments, and the water temperature was kept at a nominal temperature of 23 ° C, which did not vary by more than 2 ° C among all the experiments. A flow-through liquid cell was constructed for this study to provide a nearly constant solution flow rate across the gypsum surface. All components of the fluid cell are made of nonreactive polymer materials (e.g., polyether ether ketone and polytetrafluor- oethylene). The fluid cell cavity has an approximate volume of 14.5 mL without the specimen and approximately 12.0 mL with a specimen loaded. Most experiments were conducted by flowing the water into the cell at constant rate of (14.5 ± 0.5) mL min−1.1 This flow rate is much greater than the flow rates used in previous studies (1.4 mL min−1 in Burgos-Cara et al. (2016) and 0.5 mL min−1 in Fan and Teng (2007)), and was intended to prevent dissolution from being kinetically controlled by mass transport through the adjacent liquid by keeping the gypsum saturation index near the surface approximately constant and close to zero. Section 3.1 provides evidence that the measured dissolution fluxes are indeed approximately independent of liquid flow rate when the flow rate is at least 14.5 mL min−1.
The (010) cleavage surface of gypsum is terminated by water molecules and is therefore strongly hydrophilic. Consequently, despite the fact that chromium has better adhesion to gypsum than other coating materials, water flowing toward the chromium mask on the inlet side of the cell still tends to intrude along its interface with gypsum and reduces the adhesion there. To prevent this, or at least slow it down significantly, a portion of the crystal and mask near the water inlet was coated with a thin hydrophobic layer. The process for applying the coating is described in detail by Chen et al. (2009). Briefly, octafluorocyclobutane (C4F8) and Ar gases were used as raw materials in a standard inductively coupled plasma (ICP) etcher with a power source up to 2500 W at 2.4 MHz. The C4F8 monomers fragment in the plasma into CFx radicals that combine to form a fluorinated polymer coating on the surface. The coating thickness normally increases with the plasma exposure time. After several tests, an exposure time of 6 min was deemed to provide a sufficient coating to prevent delamination of the chromium mask.
2.2. Microscope configuration
The DHM (Model R-2203, Lyncée Tec, Lausanne, Switzerland)2 operates in reflection mode and can collect full-field holograms at a frame rate up to 12.5 s−1. It is equipped with three different primary source wavelengths (λ1 =665.5651 nm, λ2 = 793.2365 nm, λ3 = 681.0068 nm); λ1 was used exclusively in this study. Additional details on the microscope configuration can be found elsewhere (Brand et al., 2017; Brand, 2017).
Numerical reconstruction of each hologram produces an amplitude- contrast image (similar to a conventional optical microscope image in reflection mode) and a phase-contrast image that contains the surface height information (Cuche et al., 1999; Schnars and Jüptner, 2002). The phase-contrast data are confined to the interval [0,2π), known as “modulo 2π” or “wrapped” phase data, which can be unwrapped numerically and converted to a relative height value, based on the incident beam wavelength and refractive index along the beam path. With a known pixel size, a full 3D reconstruction of the surface can be generated, and with measurements over small time intervals, the 4D space-time history of the surface can be recorded. Additional details about the data collection and processing, as well as measurement variability, are described in detail elsewhere (Brand, 2017; Brand et al., 2017).
2.3. Methods
Gypsum dissolution was monitored using a 20 × immersion objective. The pixel size in the phase map at this magnification is 340 nm, with an image size of 650 pixels by 650 pixels. Gypsum dissolves rapidly, so the time lapse between introducing the water and collecting data needed to be minimized. All objective lenses on the DHM are parfocal, so the gypsum surface was first focused in air with another lens. Having the surface pre-focused and then switching back to the 20 × immersion objective enabled the data collection to begin within only a few seconds after introducing water and refocusing. Throughout this paper, time zero will refer to the time at which hologram collection began.
The transformation of interference data to height requires knowledge of the optical path length of the objective beam, which is influenced by the refractive index of the aqueous medium. The refractive index of pure water at 23 ° C is 1.33. The influence of solution composition on refractive index was estimated by comparing the value for pure water to that for a saturated solution of calcium sulfate, the latter solution being prepared by equilibrating an excess of gypsum powder in water for two weeks. The saturated calcium sulfate solution had by far the greatest ionic strength, and the greatest anticipated departure in refractive index from that of water, of any solution that could be encountered within the fluid cell, but its refractive index was also 1.33 ± 0.01. Based on that observation, the solution refractive index is assumed to be a constant value of 1.33 in all the experiments reported here.
Shot noise, a type of electronic noise that occurs in electronics and in photon counting devices, as well as noise from other sources, is inherent in interferometric measurement methods such as DHM (Charrière et al., 2006a,b, 2007; Pandey and Hennelly, 2011; Léon- Rodríguez et al., 2012; Pan et al., 2013; Brand, 2017) and can significantly compromise image quality. To reduce noise, temporal averaging of the phase maps (Kühn et al., 2008; Charrière et al., 2007) was used. Once during every time interval of approximately 2 s, a burst of ten holograms was collected at a frame rate of 12.5 s−1. Phase maps reconstructed from those ten holograms were averaged to generate a representative sample phase map for that time interval. The temporally- averaged phase data were then unwrapped using a spatiotemporal method described by Brand et al. (2017). The surface height at each pixel within the region of interest (ROI), relative to the mask reference height, was then determined from these unwrapped data as a function of time.
The (010) surface normal dissolution velocity, v(010), in units of m s−1, within an ROI is defined as the slope of a linear regression of mean height versus time. It is the rate at which the vertical position of the surface retreats as solid is removed. The (010) surface normal molar flux, J(010), in units of mol m−2 s−1 (Lüttge et al., 1999), is then computed from the dissolution velocity and the molar volume of gypsum, which is estimated as V m = (7.453 ± 0.006) × 10−5 m3 mol−1, based on the range of densities reported in the literature (Mindat, 2016; Castillo et al., 1982):
| (1) |
In the following sections, surface normal dissolution fluxes on a gypsum surface are computed either in localized regions or over the entire ROI. Dissolution rates averaged over the entire ROI at any time are called “grand” dissolution rates. The chromium-masked surface region was disregarded in all dissolution rate calculations.
As already mentioned, the strongly hydrophilic nature of (010) gypsum makes it challenging to obtain a fixed reference plane on the mask's upper surface because water intruding along the film-crystal interface destabilizes the elevation of the upper film surface. Therefore, as a precaution, the stability of the mask surface was continuously monitored by tracking the heights of several regions of that surface to check that they remained at a constant elevation relative to the reference plane during the experiment. Examples of four such mask regions are shown in Fig. 1 (a), and the area-averaged heights the four regions are plotted as a function of time in Fig. 1 (b). From the plot in Fig. 1 (b), the total height change for the two regions on the mask remains within 5 nm, whereas the corresponding height changes in the unmasked regions over the same time are about 100 nm. Therefore, although the mask does not necessarily maintain a constant height, its average height changes can be taken into account when computing the dissolution rate.
3. Results
3.1. Liquid flow rate effects
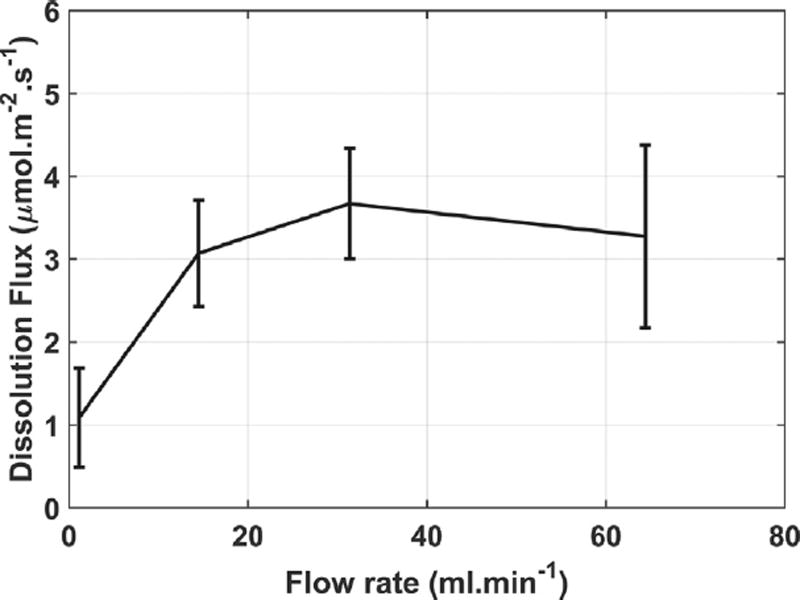
Fig. 2 shows the dependence on liquid flow rate of the average dissolution flux from surfaces which are free of cleavage steps. The plot confirms that, to within the sample-to-sample variability, a flow rate of (14.5 ± 0.5) mL min−1 is great enough to obtain measurements that are independent of the flow rate, at least when tall cleavage steps do not participate in the dissolution process. Up to about 14.5 mL min−1, the dissolution flux increases with increasing flow rate, indicating that ionic diffusion in the solution exerts some kinetic control on the dissolution flux in that lower flow regime. At higher flow rates, dissolution fluxes should not be controlled by mass transport through the solution. For this reason, the other flux measurements reported in this paper—other than the behavior of cleavage steps—were obtained using the 14.5 mL min−1 flow rate and are unlikely to be influenced by aqueous diffusion. The behavior of and origin of stepwaves does continue to change with increasing flow rate all the way up to 65.0 mL min−1, which will be described in a later section.
Fig. 2.
Average dissolution flux from surfaces free of stepwaves as a function of liquid flow rate. Error bars are one standard deviation of the average grand dissolution flux for at least three samples at each flow rate.
The hydrodynamics within a fluid cell are complex (Gasperino et al., 2006; Peruffo et al., 2016), and in the case of in situ AFM the presence of the physical probe can cause local changes in flow velocity. In at least one in situ AFM study of gypsum, the flow perturbation was severe enough that actively dissolving sites in neighboring regions affected the topography changes and dissolution flux in the field of view (Peruffo et al., 2016). But in situ DHM uses an optical probe, and any localized velocity effects should not be as prominent at the surface as in in situ AFM because the DHM 20 × immersion objective is several millimeters away from the sample surface. In a recent study, Brand et al. (2017) checked this expectation for DHM by tracking the trajectory of micrometer-size alumina particles suspended in water with the same configuration. The particle motion indicated a laminar flow velocity of (0.47 ± 0.05) mm s−1 across the sample surface when the inlet flow rate was 14.5 mL min−1. Although Fig. 2 indicates a surface-controlled dissolution reaction at flow rates of 14.5 mL min−1 and greater, the average concentration of dissolved calcium and sulfate ions very near the surface is unlikely to be zero. Finite element simulations of fluid flow near an AFM tip at a dissolving gypsum surface (Peruffo et al., 2016) indicate that the calcium and sulfate concentrations at the surface decrease by about 50%, to about 6 mmol L−1, when the fluid flow rate increases from zero to 0.1 mm s−1. This corresponds to a gypsum saturation index (i.e., ratio of the activity product to the gypsum solubility product) of about 0.5. However, the flow velocity of 0.47 mm s−1 measured in the current study is nearly five times greater than that simulated by Peruffo et al. (2016). In addition, the absence in this study of a physical obstruction near the surface likely makes the flowing fluid more effective at removing dissolved nearsurface components. Based on these considerations and on Fig. 2, one can conclude that dissolution in this study likely is reaction controlled and is being measured at a near-surface saturation index considerably lower than in previous studies.
3.2. Etch pit formation and growth
Qualitatively, the topographical features observed on the crystals can be grouped into one of four general categories. The first three, and their influence on dissolution rates, are discussed in this section. The fourth category, consisting of tall cleavage steps, are discussed in a separate section because they have a significantly different character, frequency, and corresponding local dissolution fluxes than the other three.
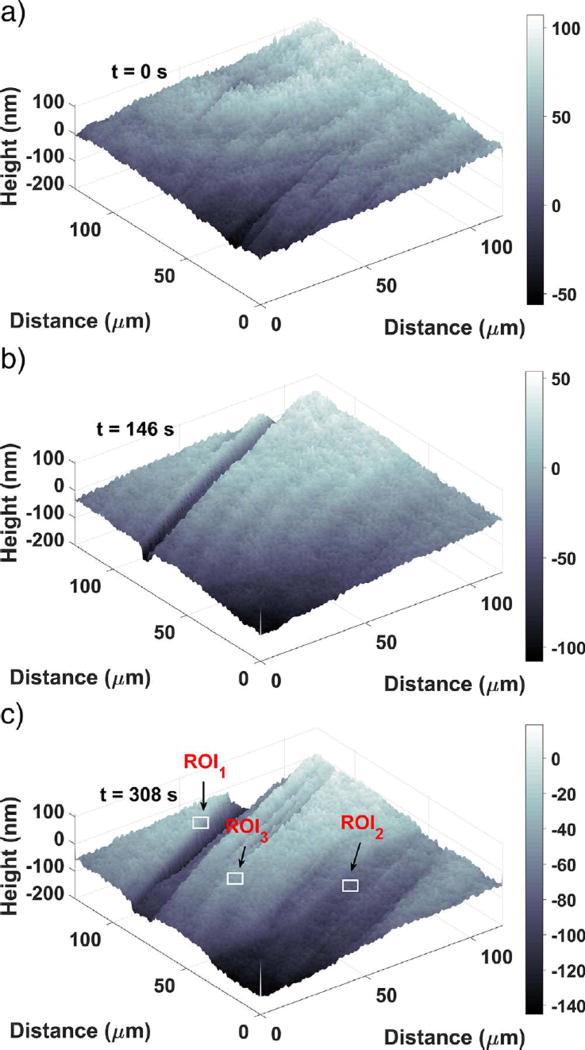
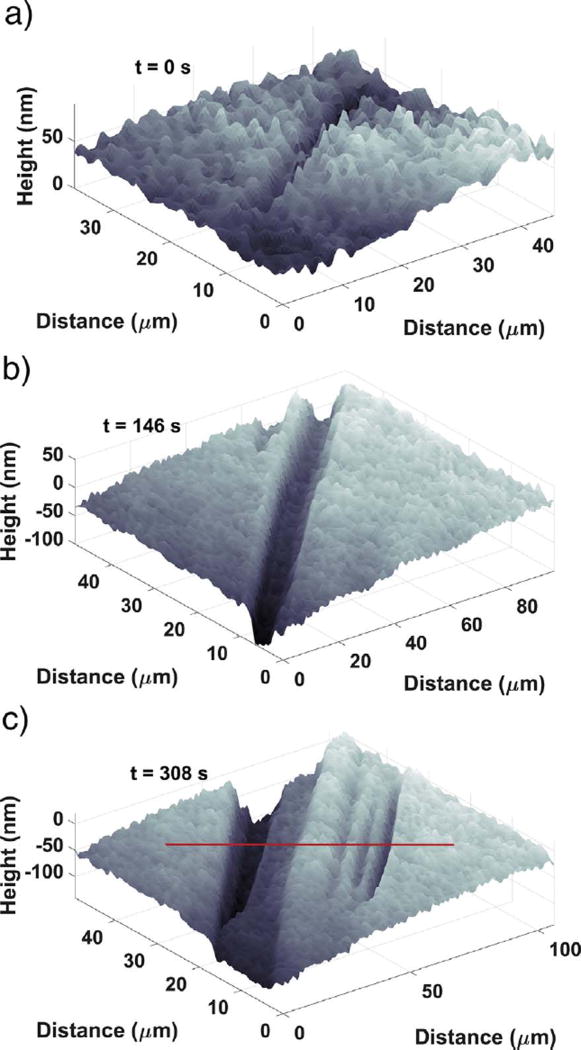
Examples of the first three kinds of topographical features can all be seen in Fig. 3, which shows a time sequence of the topography for one region. The initial topography (Fig. 3 (a)) consists of smooth, flat surface regions with some minor, nanoscale undulations and fissures. These flat regions later become confined between etch pits, as shown in Fig. 3 (c), but do not disappear entirely. They dissolve continuously throughout the experiments, so they almost certainly contain a significant number of monomolecular steps approximately 0.7 nm high with kink sites where detachment can readily occur (Bosbach et al., 1995). However, the combination of vertical and lateral resolution of the immersion objective is insufficient to observe these individual steps.
Fig. 3.
Surface topography development at (a) 0s, (b) 146s, and (c) 308s, showing the development of a deep, narrow etch pit (b, left side) and a shallower pit (c, right side). Note: the numbers on the gray scale bar are in nanometer units. Each ROI indicated in (c) is 10µm on a side.
The other two categories of surface features comprise different types of etch pits, which typically begin to form within 1 min of contact with water. One type of etch pit, first appearing at the left of Fig. 3 (b), appears as a deep, narrow “trench” that, for a time, deepens much more rapidly than it widens but then enters a period of slower evolution. These etch pits are highly anisometric, being much longer than they are wide and appearing as narrow slits when viewed from above. Similar morphologies for etch pits in gypsum have been reported by Peruffo et al. (2013).
A second etch pit type is characterized by shallower, sloping “valleys”, evident in the lower portion of Fig. 3 (c). These valleys have typical dimensions of tens of micrometers in width and length, and tens of nanometers in depth. They grow anisotropically, with the length increasing faster than the width, and both length and width increasing faster than the depth by orders of magnitude. Although both of the latter two categories are etch pits, this paper will occasionally use the terms “valley” and “trench” for convenience to make clear which type of etch pit is being discussed.
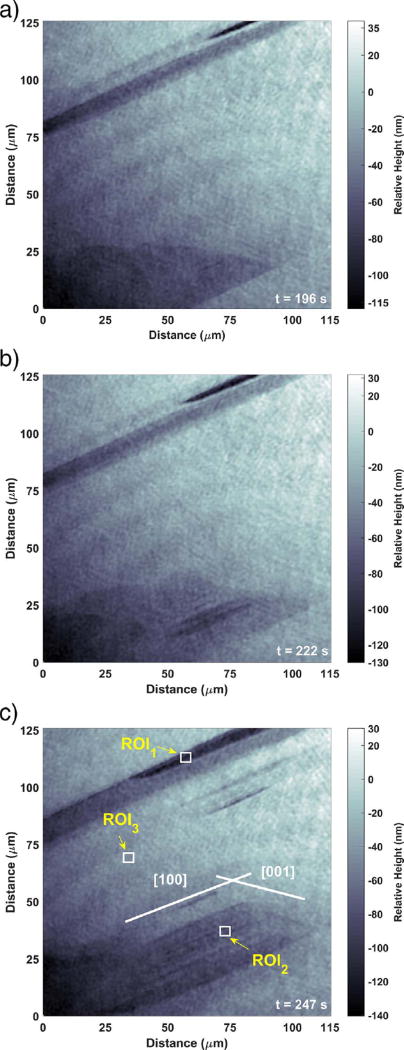
Fig. 4 shows a series of top views of the same area displayed in Fig. 3, which enables a more convenient examination of the lateral growth rates of the etch pit openings. Both types of etch pits have well- defined openings in the shape of a parallelogram. Hall and Cullen (1996) previously observed two types of etch pits on (010) gypsum faces. One is bounded by the (001) and (100) planes, and the other is bounded by the (001) and (101) planes. However, (101) steps are less stable (Weijnen et al., 1987), and etch pits bounded by (001) and (100) are typically observed in the present study, based on the angles between the intersecting walls. Similar etch pit morphologies in gypsum have been reported by Fan and Teng (2007) and Peruffo et al. (2013).
Fig. 4.
Top view of the surface features in Fig. 3 at times of (a) 196 s, (b) 222 s, and (c) 247 s. The ROIs shown in (c) are in the same location as those in Fig. 3 (c).
The appearance of well-defined preferred orientation of steps and etch channels supports the assumption made earlier that dissolution under these experimental conditions is controlled by a surface process and not by diffusion through the adjacent solution (Hall and Cullen, 1996; Burgos-Cara et al., 2016). By drawing 1D profiles (not shown) the “valley” etch pit is fairly flat and only about 10 nm deep at 196 s. Over the next 26 s, the edge marked [001] is displaced along the [100] direction at rate of about 1077 nm s−1, and a few narrow etch pits are observed to form (Fig. 4 (b)). Over that same time interval the depth of the flat part of this region increases to approximately (15 ± 2) nm and the narrow etch pits within that region have a depth of about (40 ± 2) nm, where the uncertainty expresses the measured temporal standard deviation in the elevation of a single pixel in the image (Brand et al., 2017). After another 25 s, more etch pits have formed and begun to coalesce, so that the average depth over the whole region increases to about 40 nm. However, these etch pits are much shallower than the “trench” etch pit observed in Figs. 3 and 4 (b).
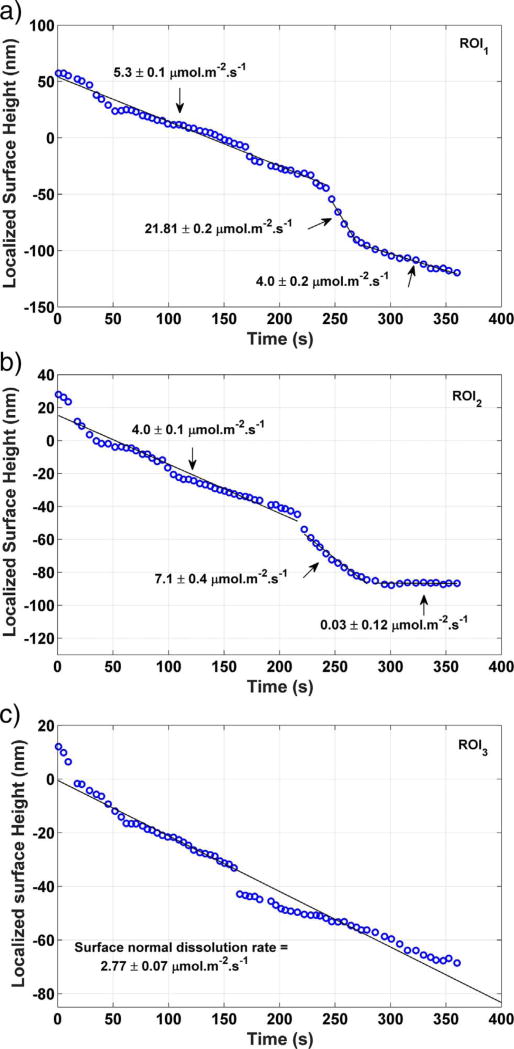
The dissolution rate associated with each of these three types of features was investigated in greater detail by defining three smaller ROIs, one in the vicinity of each feature as shown in Fig. 3 (c), with each ROI being 10 µm on a side. The area-averaged height in each of these smaller ROIs is plotted as a function of time in Fig. 5. Both ROI1 (trench) and ROI2 (valley) have an early period of approximately linear surface retreat; linear regression over this period implies molar dissolution fluxes of (5.29 ± 0.11) µmol m−2 s−1 and (3.98 ± 14) µmol m−2 s−1, respectively. After the linear period, more rapid surface retreat begins rather abruptly and lasts for a minute or less. This accelerated period happens between the images captured in Fig. 3 (b) and (c). The fluxes measured during this accelerated dissolution, obtained by linear regression as shown in Fig. 5, are (21 ± 2) pmol m−2 s−1 and (7.1 ± 4) µmol m−2 s−1. These values are somewhat lower than, yet still basically consistent with, the surface normal rates of (40 ± 5) µmol m−2 s−1, (50 ± 20) µmol m−2 s−1, and (57 ± 14) µmol m−2 s−1 reported by Peruffo et al. (2013), Colombani (2008), and Mbogoro et al. (2011), respectively. Both ROI1 and ROI2 return to a lower rate of dissolution after the brief acceleration. The new rates are lower than the rates prior to acceleration, and in ROI2 the new rate is zero within measurement uncertainty.
Fig. 5.
Time dependence of average height within the three ROIs defined in Fig. 3. (a) Within a deep, narrow etch pit, or trench (ROI1); (b) within a shallower etch pit, or valley (ROI2); and (c) on the flat regions between the etch pits (ROI3). Dissolution fluxes within each ROI are estimated by linear regression, and each reported uncertainty is the standard error of regression for the associated line segment. The uncertainty in the individual measurements is characterized as the temporal standard deviation of the measurement on a single pixel, 2 nm.
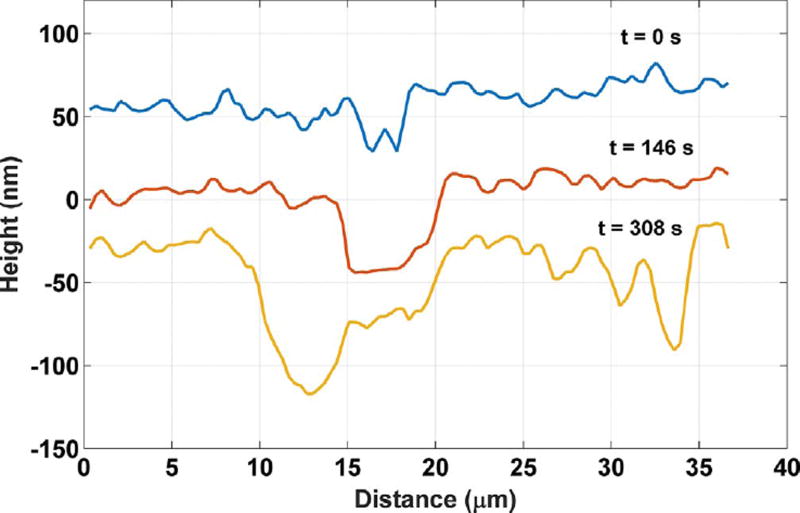
Fig. 6 provides a closer view of the trench forming with time. The cross section profile along the red line in Fig. 6 (c) is shown in Fig. 7, which more clearly shows the dimensional information for the pit. Both figures show that the trench depth changes within the first 146 s from (36 ± 4) nm to (56 ± 2) nm, and the width from 2.4 µm to 5.1 µm (width is defined here as the wall-to-wall distance at half the depth). The uncertainties reported for the depth are the standard deviation of three manual point-to-point measurements in Fig. 7. At 146 s, an even deeper trench begins to form on the left side of the existing pit. This secondary channel temporarily has a higher local dissolution rate and is responsible for the accelerated dissolution period indicated in Fig. 5 (a). The deeper channel merges with the first etch pit by 308 s, and its dissolution rate decreases significantly thereafter. The deceleration of the dissolution of the existing etch pit is consistent with the argument of Arvidson et al. (2003) that fast dissolution rates at etch pits can persist only until the termination point of the originating surface defect is reached. Additionally, three newly formed etch pits can also be seen to the right of the main trench in Fig. 6 (c); they also can be observed toward the right end of the line profile at 308 s in Fig. 7.
Fig. 6.
Magnified view of the development of the deep, narrow etch pit shown in Fig. 3 at (a) 0 s, (b) 146 s, and (c) 308 s. (For interpretation of the references to color in this figure, the reader is referred to the web version of this article.)
Fig. 7.
Etch pit cross section profile defined by the red line segment in Fig. 6. The uncertainty in the individual measurements along the profile is characterized as the temporal standard deviation of the measurement on a single pixel, 2 nm. (For interpretation of the references to color in this figure legend, the reader is referred to the web version of this article.)
Fig. 5 (c) shows that the dissolution behavior of the relatively flat area between the etch channels in Fig. 3 (ROI3) undergoes no significant period of acceleration, and the time dependence of the height remains approximately linear after the first few seconds of contact with water. Linear regression of the height data in Fig. 5 (c) indicates a molar dissolution flux of (2.77 ± 0.07) µmol m−2 s−1, less than half the rate observed at either type of etch pit. In an earlier study, Peruffo et al. (2013) reported that the height change of ostensibly defect-free areas on gypsum (010) surfaces is less than 10 nm over a period of about 180 s of submersion in 100 mL of still water. The corresponding time-averaged flux of approximately 0.7 µmol m−2 s−1 is only about 25% of the value measured in ROI3. The discrepancy may have material origins, including possibly different types and concentrations of impurities or vacancies at the surface, but is likely due in part to the fact that the current study uses flowing pure water and maintains the saturation index near zero. In the earlier study, dissolution in still water would cause an increase in the solution's saturation index with respect to gypsum, progressively lowering the driving force and rate of dissolution.
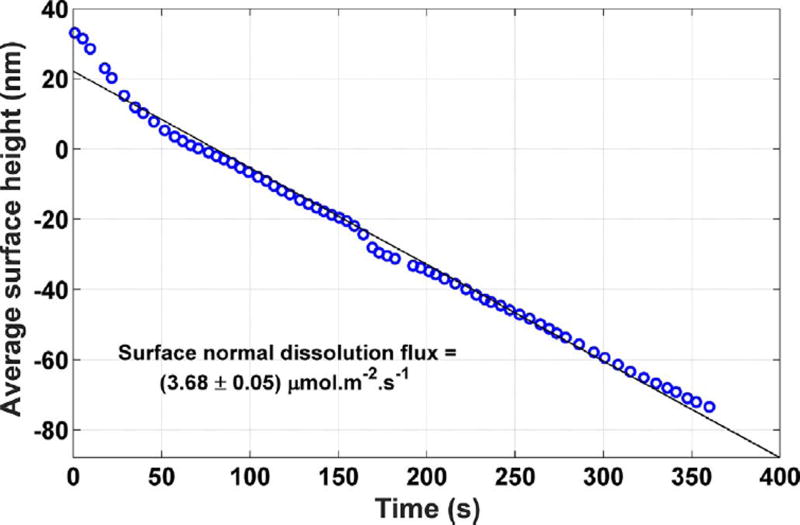
Despite the distribution of different surface features at different times in Fig. 3, each of which dissolves at different rates, the area- averaged height over the entire image is approximately a linear function of time, as shown in Fig. 8. As shown in the figure, linear regression of the data give an overall, or “grand”, dissolution flux of (3.68 ± 0.05) µ mol m−2 s−1.
Fig. 8.
Grand dissolution rate of the gypsum crystal shown in Fig. 3. The reported uncertainty in the slope is the standard error of regression. The uncertainty in the individual measurements is characterized as the temporal standard deviation of the measurement on a single pixel, 2 nm.
3.2.1. Dissolution rate spectra
The foregoing analysis demonstrates that local dissolution rates depend strongly on the type and number of dissolution sites on the crystal surface. The (010) cleavage surface on different crystal specimens from nominally the same source can therefore exhibit significantly different grand dissolution rates even under the same experimental flow conditions. A more detailed way of characterizing dissolution is to construct a frequency distribution of dissolution rates (Fischer et al., 2012, 2014, 2015; Lüttge et al., 2013; Emmanuel, 2014; Fischer and Lüttge, 2017) observed over multiple crystals specimens over randomly selected regions of interest (Brand et al., 2017).
A large number of square area patches were selected at random using a uniformly distributed random number generator. Analyses were performed using different patch sizes with approximate edge lengths3 of 1 µm, 5 µm, 10 µm, 15 µm, or 20 µm. Regardless of size, the number of patches was sufficient to guarantee complete coverage, with some patch overlap, of the total experimental area tested on each of seven crystal specimens.
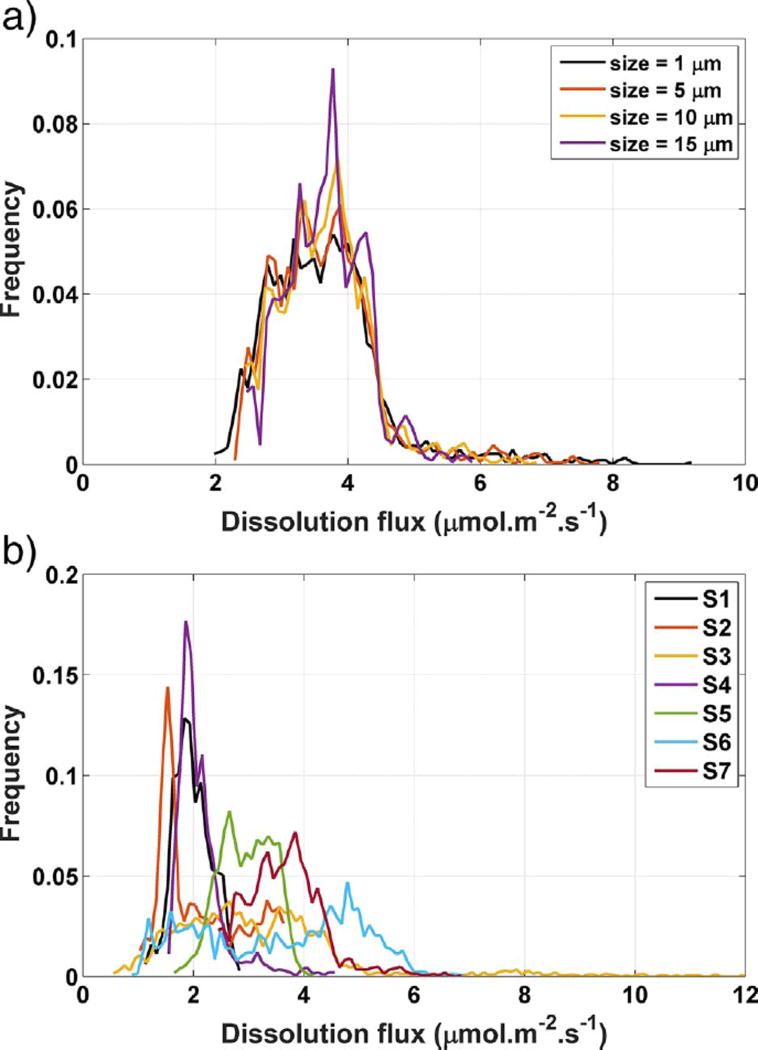
Fig. 9 (a) shows the dissolution spectra obtained for different patch sizes sampled within one image of one gypsum crystal. The great majority of measured fluxes fall between 2.5 µmol m−2 s−1 and 4.5 µmol m−2 s−1. No obvious length scale dependency is observed, although smaller sample size tends to extend the range slightly. A wider distribution for small patch size is reasonable because (i) the probability of a small patch not having any etch pits is greater than that of a larger patch, and (ii) an etch pit that does fall within a small patch will occupy a greater proportion of the surface area of that patch and will therefore tend to dominate the dissolution rate measured there.
Fig. 9.
(a) Influence of subarea size on dissolution flux spectra within one image of a single gypsum crystal without tall cleavage steps. (b) Dissolution flux spectra measured on 10 µm patches of the (010) cleavage surface of seven gypsum crystals without tall cleavage steps. The maximum uncertainty in the distribution at any point is about 0.45%, characterized as one standard deviation in Monte Carlo propagation of uncertainties in identical measurements made on calcite (104) cleavage surfaces (Brand et al., 2017). (For interpretation of the references to color in this figure, the reader is referred to the web version of this article.)
The inter-specimen variability of the measured rate distribution was studied by choosing seven different crystals, labeled S1 through S7, and observing regions on each that had similar surface appearance, without visible steps or other defects when observed at 20 × magnification. The patch size was arbitrarily selected to be 10 µm. The measured rate spectra are shown in Fig. 9 (b). The majority of fluxes are in the range between 1 µmol m−2 s−1 and 5 µmol m−2 s−1, with a minority, almost exclusively measured on sample S6, being higher.
The rate spectra of sample S1, S4, S5, and S7 have a single, well- defined peak, but samples S2, S3, and S6 have a wider rate distribution range with poorly defined peaks. Fischer et al. (2012) have suggested that the shapes of the rate distribution can provide information about the distribution of surface energy and the frequency of detachment from different distinct types of surface sites, giving rise to the peaks in the distribution. This problem is further explored in the next section by examining the relationship between the roughness of localized regions and their corresponding dissolution rate.
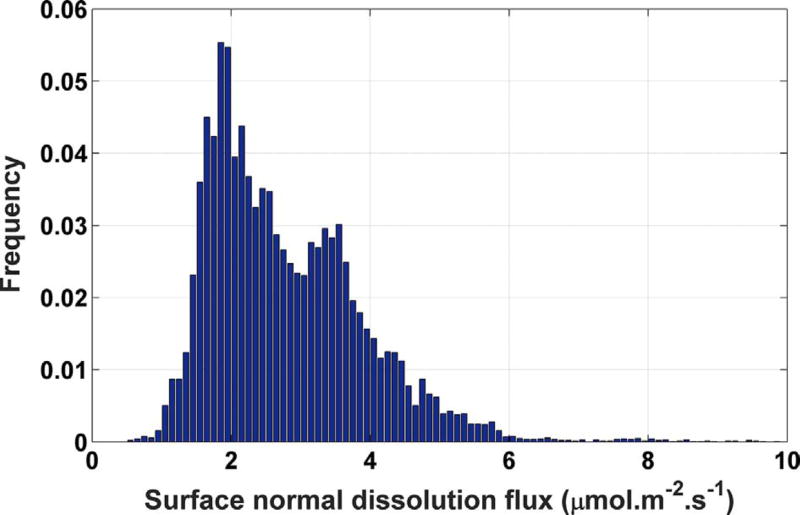
Aggregating the observed frequencies from all seven crystals, an asymmetric distribution is obtained, shown as the histogram in Fig. 10. The histogram has a longer tail extending to higher rates and a shorter tail at lower rates. Similar asymmetric distributions have been reported for calcite, dolostone, and micrite (Fischer et al., 2012; Emmanuel, 2014; Fischer and Lüttge, 2017; Brand et al., 2017). The distribution also appears to be bimodal, with mean and median values of 6.7 µmol m−2 s−1 and 2.8 µmol m−2 s −, respectively.
Fig. 10.
Histogram of dissolution fluxes collected from all seven crystals when no tall cleavage steps are observed during the experiment. The maximum uncertainty in the distribution at any point is about 0.45%, characterized as one standard deviation in Monte Carlo propagation of uncertainties in identical measurements made on calcite (104) cleavage surfaces (Brand et al., 2017).
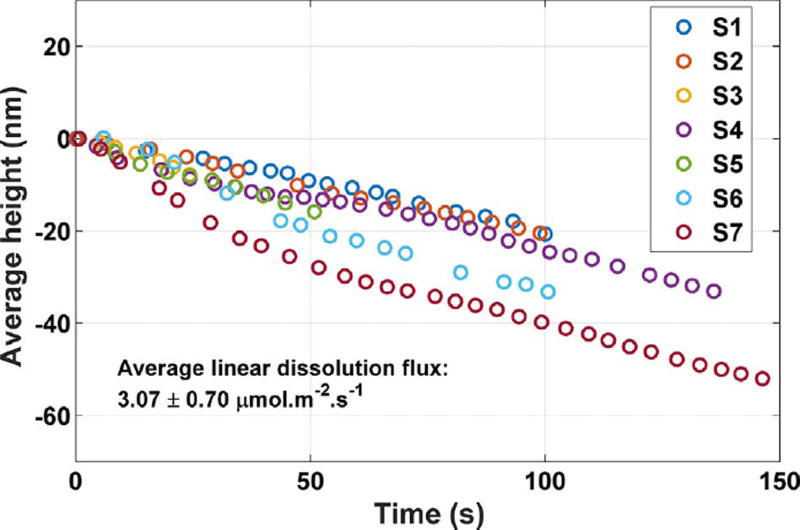
The grand dissolution rate over the total observed (010) surface area, as defined previously, provides an alternative way to assess the inter-specimen variability. Fig. 11 shows the mean height as a function of time over the total observed area of each crystal. The average height of each crystal surface is approximately a linear function of time, although some variation is observed at early times up to about 50 s. Nevertheless, linear regression over the entire experiment gives a time- averaged grand dissolution flux that is (3.07 ± 0.70) µmol m−2 s−1, where in this case the variability is characterized by the standard deviation of the mean slopes of the seven curves in Fig. 11.
Fig. 11.
Average (grand) height changes observed on seven gypsum crystals when no tall cleavage steps are observed during the experiment. The reported rate is the mean slope of the seven data sets obtained by linear regression, and the reported variability is the standard deviation of the mean slope. The uncertainty in the individual measurements is characterized as the temporal standard deviation of the measurement on a single pixel, 2nm. (For interpretation of the references to color in this figure, the reader is referred to the web version of this article.)
3.2.2. Surface roughness
Surface area normalization of dissolution rates can be problematic because surface area measurements are typically dependent on length scale. At the microscopic length scales accessible to DHM, VSI, and AFM, the projected area used to calculate surface normal dissolution fluxes is less than the “true” surface area that would be measured by, for example, nitrogen adsorption isotherms. The differences between the two are related to the surface roughness. In addition, the development of etch pits during dissolution would also tend to increase the surface roughness. One might therefore expect that, other factors being equal, increases in surface roughness should be correlated with higher values of the surface normal dissolution flux.
Areal roughness (in 2D) is quantified here as the root mean square (RMS) roughness, Sq, which measures the RMS surface height from a zero reference plane (ISO 25178-2:2012, 2012) according to
| (2) |
where z(i,j) is the height measured at the pixel located at coor- dinate(i, j), z̄ is the height of the best fitting plane through the surface, and M and N are the width and height of the ROI in pixel units.
Fischer and Lüttge (2007) emphasized that the distribution of roughness is a strong function of analytical length scale. They reported for calcite that Sq on a small length scale (l <15 µm) reflects the differences between shallow and deep etch pits, whereas Sq measured over larger areas loses most of that information (Fischer et al., 2012).
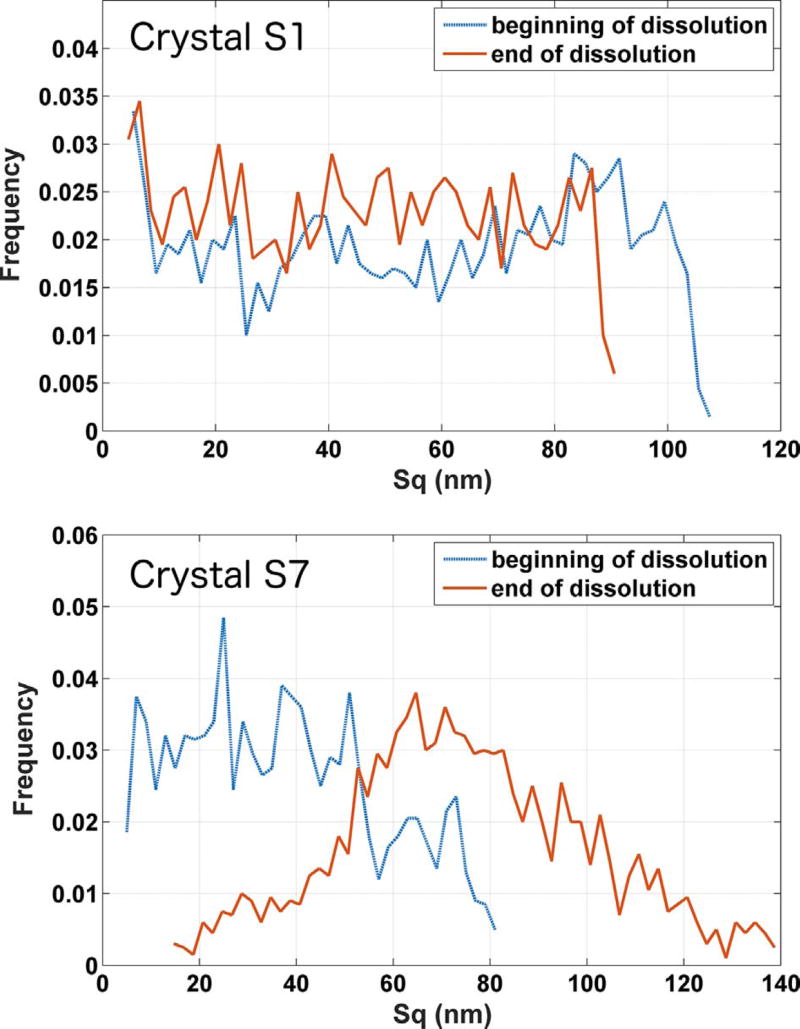
Five hundred square patches, each with 10 µm edges, were randomly placed on the (010) surface to calculate Sq at the beginning and at the end of dissolution for each specimen. The resulting frequency distribution of Sq is plotted in Fig. 12 (a) for crystal S1 at the beginning and end of the ten minute observation period. Crystal S1 had one of the lowest grand dissolution fluxes and a flux spectrum that is narrowly peaked at the lower end of the spectrum, as shown in Fig. 9 (b). 12 (a) indicates that Sq does not change significantly over the course of the observation period.
Fig. 12.
Distribution of local roughness Sq at the beginning and end of the observation period for crystal S1 (top), with one of the lower grand dissolution rates, and S7 (bottom), with the highest grand dissolution rate. The length scale used for roughness measurements is 10 µηι. The uncertainty in the individual measurements is characterized as the temporal standard deviation of the measurement on a single pixel, 2 nm. (For interpretation of the references to color in this figure, the reader is referred to the web version of this article.)
For comparison, Fig. 12 (b) shows the roughness distribution for crystal S7 over the same time period, from which it can be perceived that the spectrum undergoes a significant shift to higher Sq. Greater rates of increase in Sq, at these length scales, is caused primarily by (a) an increase in the area density of etch pits, and (b) a relatively greater rate of deepening of those etch pits. This increase implies that etch pit dissolution, which in these experiments happens with about double the flux of the flat surface regions, exerts a greater influence on the grand dissolution rate. Such an expectation is supported by the fact that crystal S7 had a considerably broader flux distribution than that of crystal S1, with higher local fluxes being observed relatively more frequently. Crystal S7 also had the highest grand dissolution rate of the seven gypsum specimens that were studied.
3.3. Stepwaves
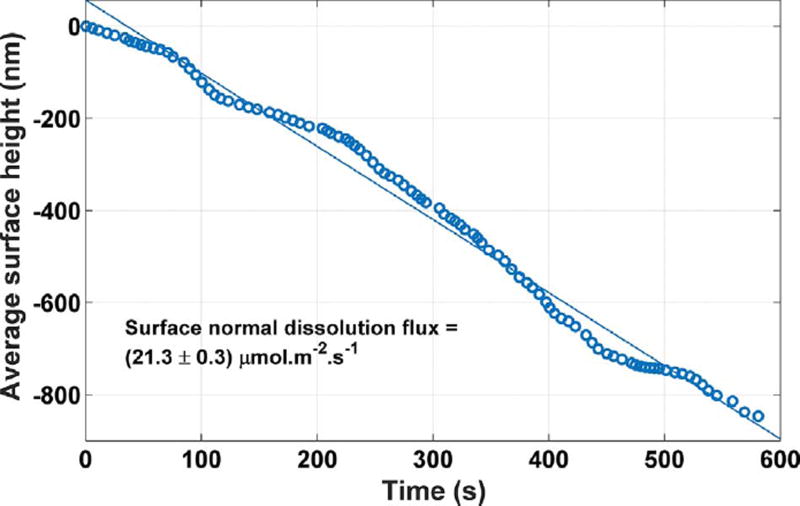
A fourth category of topographical features observed on these crystals consists of tall cleavage steps, usually about 100 nm high. They appear intermittently, and the relative number of such steps varies from crystal to crystal. When present, these steps move rapidly across the surface, usually in the [100] direction, and produce much higher local rates of dissolution than those reported in the previous sections. Fig. 13 shows the surface height, averaged over the entire field of view at 20 × magnification, as multiple stepwaves crossed through the image during the observation period. The trend is approximately linear, and linear regression indicates a grand surface normal dissolution flux of (21.3 ± 3) µmol m−2 s−1. Many etch pits observed on the surface are annihilated by stepwaves as well; relatively few observable surface features are left in their wake.
Fig. 13.
Time dependence of average surface height within a region having multiple tall cleavage steps crossing the image during the time of the experiment. The uncertainty in the individual measurements is characterized as the temporal standard deviation of the measurement on a single pixel, 2nm.
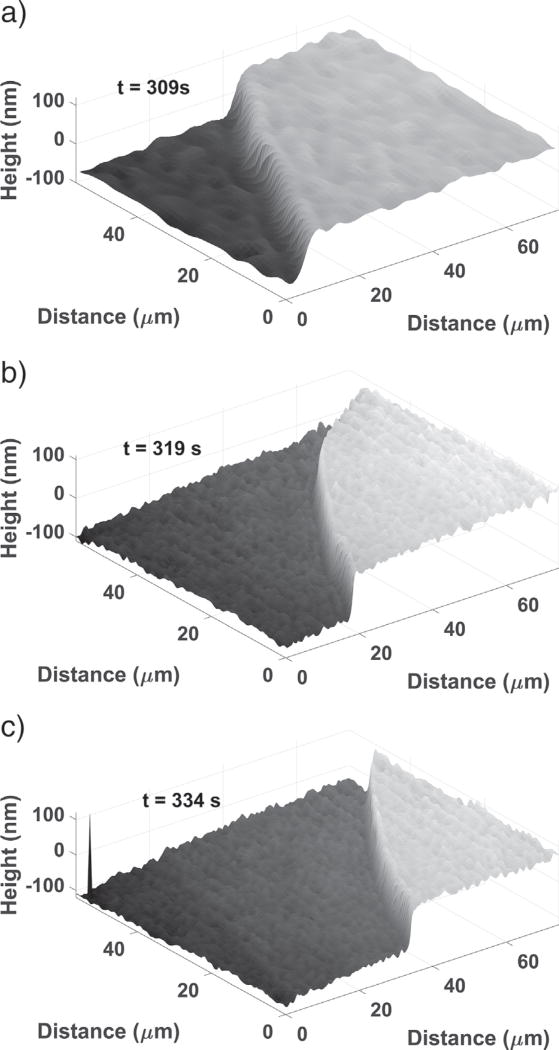
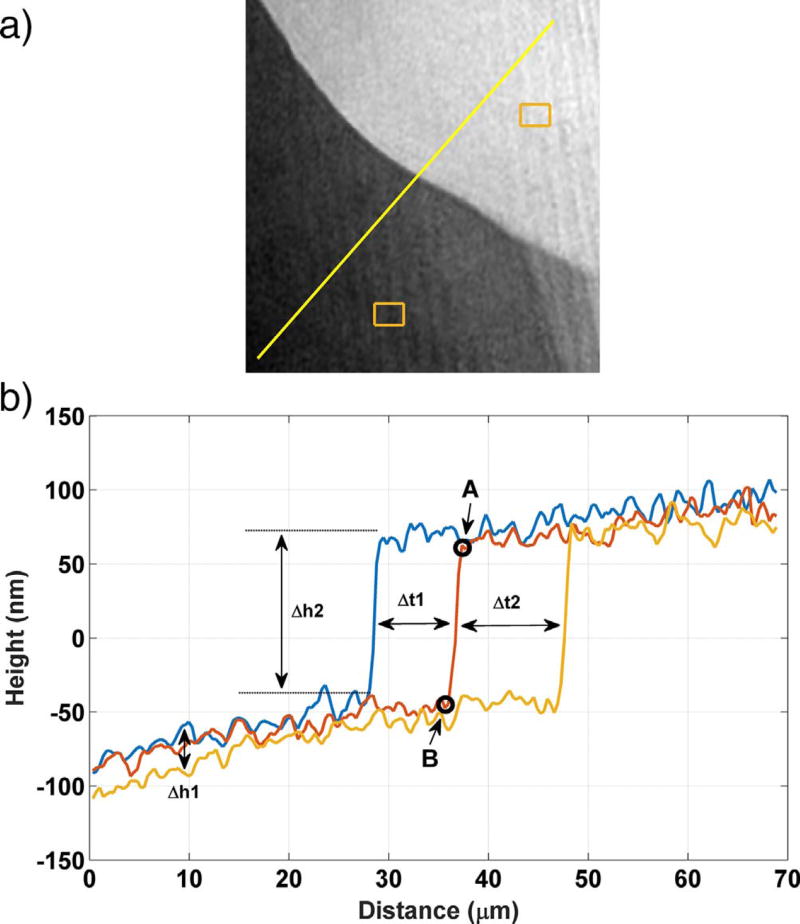
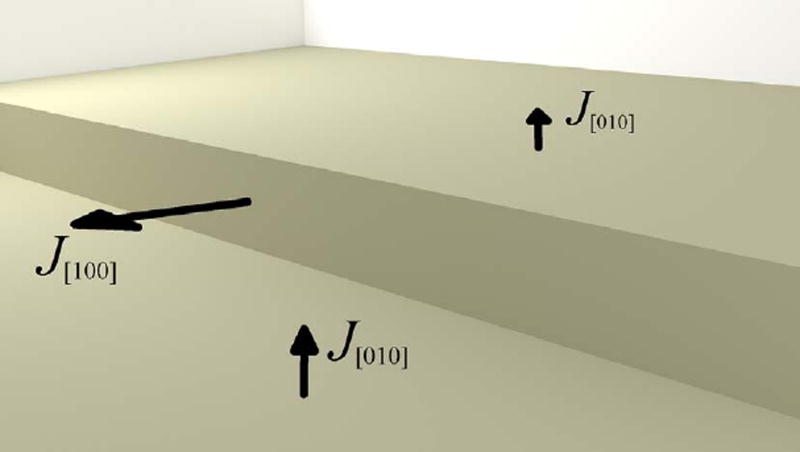
Fig. 14 shows a 3D map of stepwave movement over a period of 20 s, and Fig. 15 shows the depth and lateral displacement of that stepwave in terms of the line profiles in its direction of motion (yellow line in Fig. 15 (a)). The average stepwave speed in the [100] direction is v[100] = (755 ± 25) nm s−1, based on its displacement measured over two prescribed time intervals marked as Δt1 and Δt2 in Fig. 15 (b). The uncertainty is expressed as the range of the two measured speeds. The localized flux normal to the step, J[100], can be calculated from the step speed, the step height, and the assumed molar volume (Peruffo et al., 2013). This yields a value of J[100] = (1.01 ± 0.03) × 104 µmol m−2 s−1, where the flux direction is indicated in Fig. 16.
Fig. 14.
Stepwave motion parallel to [100] on the (010) gypsum cleavage surface of a gypsum crystal.
Fig. 15.
1D profiles over 25 s showing stepwave motion parallel to [100] on the (010) gypsum cleavage surface of sample A. The uncertainty in the individual measurements is characterized as the temporal standard deviation of the measurement on a single pixel, 2nm. (For interpretation of the references to color in this figure, the reader is referred to the web version of this article.)
Fig. 16.
Flux directions near a step as discussed in the text. The flux from the step wall, J[100] = (1.01 ± 0.03) × 104 µmolm−2 s−1, is more than three orders of magnitude greater than the fluxes measured from the (010) plane on either side of the step.
The average molar flux from the stepwave wall is four orders of magnitude greater than any measured localized rate by the slower mechanisms described in the previous section. The average stepwave velocity is also much greater than previously reported stepwave velocities of 330 nm s−1 (Peruffo et al., 2013) and 23 nm s−1 (Fan and Teng, 2007); possible reasons for these apparent discrepancies are offered in the Discussion.
Fig. 15 (b) shows that the terraces on either side of the moving stepwave continue to dissolve, although at a much slower rate than the stepwave itself. Two local patches, one on each side of the step, were selected to measure the local terrace dissolution rates, marked by the rectangles in Fig. 15 (a). Within the 25 s of observation in the plot, the dissolution fluxes in those patches are (7.22 ±0.40) µmol m−2 s−1 behind the step and (7.90 ± 0.40) µmol m−2 s−1 in front of the step; the directions of these fluxes are shown in Fig. 16. Both rates are more than double the grand dissolution rate obtained in areas where stepwaves are not observed, and are near the extreme tail of the rate spectrum averaged in such areas over all seven crystals.
The origin and behavior of stepwaves, unlike other topographical features on the gypsum cleavage surface, continue to change with increasing liquid flow rate all the way up to 65.0 mL min−1. In particular, at the higher flow rates, the valley type etch pits can spawn stepwaves, the height of which varies between 50 nm and 100 nm. In addition, the rate of material removal from these steps increases with increasing flow rate, although the dependence has not been systematically quantified in this study. The considerably greater local dissolution fluxes at steps gives these features a prominent role in determining grand dissolution rates of gypsum. The complexities of their formation, motion, interaction with other topological features, and ultimate fate, especially as a function of flow rate, are important subjects for further detailed investigation in the future.
4. Discussion
Wider distributions in local dissolution rates, and especially longer tails at the higher rates, are correlated with greater surface roughnesses as measured by Sq at the end of the observation period. In the absence of tall stepwaves, this correlation suggests that higher dissolution rates are observed both when more reactive sites (i.e., etch pits) are exposed during dissolution and when existing etch pits grow deeper. The initial surface roughness is not a good predictor of future rate spectra, however. In fact, Fig. 12 indicates that crystal S1, with a dissolution spectrum narrowly peaked at lower fluxes, initially had a roughness distribution higher (i.e., shifted to the right) than that of crystal S7, which had one of the broader rate spectra and the highest grand dissolution flux of all the specimens that were studied. The apparent lack of influence of the initial roughness probably reflects the fact that the great majority of etch pits form only after being in contact with water for a while. Pronounced etch pits and channels are relatively rare on freshly cleaved (010) gypsum surfaces, as shown in Fig. 3.
The velocities of the tall cleavage steps observed in this study correspond to molar dissolution fluxes that are more than four orders of magnitude greater than those associated with any other topographical feature observed in this study. Furthermore, the stepwave velocities are much greater than those measured for steps in previous studies of gypsum. Peruffo et al. (2013) reported a stepwave velocity of 330 nm s−1, which is less than half the value measured here, and Fan and Teng (2007) reported a stepwave velocity of only 23 nm s−1. The differences could be due in part to material differences in the gypsum source, such as surface impurities, thermal history, or slight differences in temperature during the experiment. But the most likely reasons why this behavior has not been previously observed are that (1)the present experiments uses a higher water flow rate that maintains the gypsum saturation index near zero in the solution and thereby keeps the driving force for dissolution as high as possible, and (2)previous studies, even in situ AFM observations, may not have been able to capture such rapid step motion across the field of view due to limitations in the scanning speed.
The much greater molar dissolution fluxes near tall stepwaves could have been included in the dissolution rate spectra shown in Fig. 10 to give a fuller picture of the variations in dissolution rates, but this was not done here for several reasons. First, the tall stepwave rates are so much greater than the etch pit rates that the histogram would need to be plotted on a logarithmic scale and would have obscured the details of the lower part of the histogram. But more importantly, tall steps are less commonly observed than the other features. The area density of such steps on the gypsum (010) surface appears to depend on the quality of the cleaving operation, and some surfaces appear to have no such steps within the largest field of view used in these experiments. Also, when a step or multiple steps appear in the field of view, unwrapping of the phase image often becomes difficult and leads to greater uncertainty in the measurements because of the large and sharp height differences associated with each step. Therefore, although the stepwave velocities reported here are measured accurately, we collected measurements on too few steps to have as much confidence in the statistics as we have for the etch pits and flat regions.
Dissolution rates of small mineral particles measured by batch reaction methods are often much greater than the rates measured on large crystal surfaces using techniques like VSI or AFM (Barton and Wilde, 1971; Bolan et al., 1991; Jeschke et al., 2001; Arvidson et al., 2003; Kumar et al., 2013). Consistent with that trend, the grand dissolution fluxes normal to the gypsum (010) cleavage plane in this DHM study, even with tall cleavage step motion, are about 30% of the fluxes estimated for individual gypsum particles in water by VSI (Kumar et al., 2013). This size dependence is unlikely to be due solely to the enhanced solubility of gypsum particles caused by the Freundlich effect. Assuming that the orientation-averaged surface energy of gypsum is no more than 600 mJ m−2 (Dundon and Mack, 1923; Rubbo et al., 2011), the Freundlich effect is negligible for particle sizes down to about 150 nm, below which the chemical potentials of the solid components increasingly exceed those for a bulk crystal (Defay and Prigogine, 1966; Jackson and McKenna, 1990).
The size dependence of dissolution fluxes likely originates with the differences in the density of sources of stepwaves on small particles compared to large crystal surfaces (Dove and Platt, 1996). Corners and edges on particles provide continual sources of steps, and these sources are much more closely spaced on small particles than on larger crystal surfaces. Similarly, crystallites and powder particles have a variety of exposed crystallographic planes at which dissolution occurs, and some of these surfaces may intrinsically have high step densities or microfacets, because of their crystallographic orientation (Mullins, 1963). In contrast, topographical studies are typically made on cleavage planes that tend to be singular or nearly singular surfaces with low surface energy and few or no steps. These and other reasons for the differences among kinetic measurements on powders, polycrystals, and single crystals have been discussed in detail elsewhere (Arvidson et al., 2003).
The present study on gypsum reinforces the evidence that even a few tall steps can increase local rates of dissolution significantly. Nevertheless, the grand (010) flux measured here when stepwave motion is active, J(010) = (21 ± 3) µmol m−2 s−1, is still less, by a factor of 10 to 30, than the values of 200 µmol m−2 s−1 to 600 µmol m− 2 s−1 measured for a gypsum powder using a rotating disk method (Barton and Wilde, 1971; Bolan et al., 1991; Jeschke et al., 2001) and is about three times less than the value of (65 ± 20) µmol m− 2 s−1 reported for particles dispersed on a substrate and submerged in static water (Kumar et al., 2013). At the same time, the local molar flux in the [100] direction at a stepwave, J[100] = (1.01 ± 0.03) × 104 µmol m−2 s−1, is greater than any of these previously reported values, possibly because previous in situ topographic techniques did not have a fast enough acquisition time, and may even represent an upper bound on the local molar flux since these experiments were performed under conditions for which material removal is unlikely to be controlled by diffusion.
5. Summary
In situ nanoscale measurements have been performed in real time by digital holographic microscopy to observe topographic changes and dissolution fluxes from gypsum (010) cleavage surfaces submerged in pure water flowing at 14.5 mL min−1. Four kinds of topographic features are observed on the (010) surface, namely (1) smooth, flat regions without evident defects, (2) deep, narrow etch pits (trenches), (3) shallow, wide etch pits (valleys), and (4) tall cleavage steps. Flat regions, trenches, and valleys typically appear in close proximity, and the local dissolution fluxes associated with each are generally within a factor of two of each other. The overall, or grand, molar flux normal to (010) within a region of interest having these latter three features is (3.0 ± 0.7) µmol m−2 s−1. Tall cleavage steps appear less frequently but migrate rapidly across the ROI with a velocity of (755 ± 25) nm s−1, generally in the [100] direction, when they are observed. The molar flux from the step walls in the [100] direction is (1.01 ± 0.03) × 104 µmol m−2 s−1, and regions with these tall stepwaves have (010) grand dissolution fluxes of (21 ± 3) µmol m−2 s−1. These grand and local fluxes bracket the range of values reported for gypsum powders by bulk methods. Powder particles necessarily have edges and corners between facets that, like these steps, furnish a continual source of kink sites for material removal, so it is unsurprising that the dissolution rates of small particles are often reported to be greater than the grand (010) dissolution flux but less than the local [100] flux measured at the step walls.
Acknowledgments
The authors gratefully acknowledge Tristan Colomb of Lyncée Tec for his assistance and support with the DHM. PF gratefully acknowledges financial support from National Basic Research Program (973 Program) of China via Grant No. 2015CB655100. ASB was supported by the National Research Council through an NRC Postdoctoral Associateship at NIST.
Footnotes
Unless stated otherwise, uncertainties in measurement are reported as one standard deviation of the mean using at least three replicates. The uncertainties in flux measurements obtained by linear regression (e.g., as in Fig. 5) are reported in terms of the standard error of regression.
Certain commercial equipment, instruments or materials are identified in this paper to foster understanding. Such identification does not imply recommendation or endorsement by the National Institute of Standards and Technology, nor does it imply that the materials or equipment identified are necessarily the best available for the purpose.
The area per pixel at 20 × magnification corresponds to actual edge lengths of the subregions of 2.4µm, 5.1 µm, 9.9 µm, 15.1 µm, or 19.9 µm.
References
- Abbott APAP, Azam MM, Ryder KSKS, Saleem SS. In situ electrochemical digital holographic microscopy; a study of metal electrodeposition in deep eutectic solvents. Anal. Chem. 2013;85:6653–6660. doi: 10.1021/ac400262c. [DOI] [PubMed] [Google Scholar]
- Arvidson RSRS, Ertan IEIE, Amonette JEJE, Lüttge AA. Variation in calcite dissolution rates: a fundamental problem? Geochim. Cosmochim. Acta. 2003;67:1623–1634. [Google Scholar]
- Asta MPMP, Cama JJ, Soler JMJM, Arvidson RSRS, Lüttge AA. Interferometric study of pyrite surface reactivity in acidic conditions. Am. Mineral. 2008;93:508–519. [Google Scholar]
- Barton AFMAFM, Wilde NMNM. Dissolution rates of polycrystalline samples of gypsum and orthorhombic forms of calcium sulfate by a rotating disc method. Trans. Faraday Soc. 1971;67:3590–3597. [Google Scholar]
- Bolan NSNS, Syers JKJK, Sumner MEME. Dissolution of various sources of gypsum in aqueous solutions and in soil. J. Sci. Food Agric. 1991;57:527–541. [Google Scholar]
- Bosbach DD, Jordan GG, Rammensee WW. Crystal growth and dissolution kinetics of gypsum and fluorite: an in situ scanning force microscope study. Eur. J. Mineral. 1995;7:267–276. [Google Scholar]
- Bosbach DD, Rammensee WW. In situ investigation of growth and dissolution on the (010) surface of gypsum by scanning force microscopy. Geochim. Cosmochim. Acta. 1994;58:843–849. [Google Scholar]
- Brand ASAS. Phase uncertainty in digital holographic microscopy measurements in the presence of solution flow conditions. J. Res. Natl. Inst. Stand. Technol. 2017;122:022. doi: 10.6028/jres.122.022. [DOI] [PMC free article] [PubMed] [Google Scholar]
- Brand ASAS, Feng PP, Bullard JWJW. Calcite Dissolution Rate Spectra Measured by In Situ Digital Holographic Microscopy. (Submitted) 2017 doi: 10.1016/j.gca.2017.07.001. [DOI] [PMC free article] [PubMed] [Google Scholar]
- Brown CACA, Compton RGRG, Narramore CACA. The kinetics of calcite dissolution/precipitation. J. Colloid Interface Sci. 1993;160:372–379. [Google Scholar]
- Burgos-Cara AA, Putnis CVCV, Rodriguez-Navarro CC, Ruiz-Agudo EE. Hydration effects on gypsum dissolution revealed by in situ nanoscale atomic force microscopy observations. Geochim. Cosmochim. Acta. 2016;179:110–122. [Google Scholar]
- Burns KK, Wu YTYT, Grant CSCS. Mechanisms of calcite dissolution using environmentally benign polyaspartic acid: a rotating disk study. Langmuir. 2003;19:5669–5679. [Google Scholar]
- Cama JJ, Zhang LL, Soler JMJM, Giudici GDGD, Arvidson RSRS, Lüttge AA. Fluorite dissolution at acidic pH: in situ AFM and ex situ VSI experiments and Monte Carlo simulations. Geochim. Cosmochim. Acta. 2010;74:4298–4311. [Google Scholar]
- Castillo EE, Hadi ASAS, Balakrishnan NN, Sarabia JMJM. CRC Handbook of Chemistry and Physics. 63. CRC Press; Boca Raton, Florida: 1982. [Google Scholar]
- Charrière FF, Colomb TT, Montfort FF, Cuche EE, Marquet PP, Depeursinge CC. Shot-noise influence on the reconstructed phase image signal-to-noise ratio in digital holographic microscopy. Appl. Opt. 2006a;45:7667–7673. doi: 10.1364/ao.45.007667. [DOI] [PubMed] [Google Scholar]
- Charrière FF, Kühn JJ, Colomb TT, Montfort FF, Cuche EE, Emery YY, Weible KK, Marquet PP, Depeursinge CC. Characterization of microlenses by digital holographic microscopy. Appl. Opt. 2006b;45:829–835. doi: 10.1364/ao.45.000829. [DOI] [PubMed] [Google Scholar]
- Charrière FF, Rappaz BB, Kühn JJ, Colomb TT, Marquet PP, Depeursinge CC. Influence of shot noise on phase measurement accuracy in digital holographic microscopy. Opt. Express. 2007;15:8818–8831. doi: 10.1364/oe.15.008818. [DOI] [PubMed] [Google Scholar]
- Chen LL, Henein GG, Liddle JJ. NanoTech Conference & Expo, Technical Proceedings. Houston, TX: 2009. Super-hydrophobic and/or super-hydrophilic surface made by plasma process; pp. 194–197. [Google Scholar]
- Chow EHHEHH, Bučar DD, Jones WW. New opportunities in crystal engineering—the role of atomic force microscopy in studies of molecular crystals. Chem. Commun. 2012;48:9210–9226. doi: 10.1039/c2cc32678g. [DOI] [PubMed] [Google Scholar]
- Colombani JJ. Measurement of the pure dissolution rate constant of a mineral in water. Geochim. Cosmochim. Acta. 2008;72:5634–5640. [Google Scholar]
- Colombani JJ, Bert JJ. Holographic interferometry study of the dissolution and diffusion of gypsum in water. Geochim. Cosmochim. Acta. 2007;71:1913–1920. [Google Scholar]
- Colombani JJ, Dez HH, Bert JJ, Dupuy-Philon JJ. Hydrodynamic instabilities and Soret effect in an aqueous electrolyte. Phys. Rev. E. 1998;58:3202–3208. [Google Scholar]
- Compton RGRG, Daly PJPJ. The dissolution/precipitation kinetics of calcium carbonate: an assessment of various kinetic equations using a rotating disk method. J. Colloid Interface Sci. 1987;115:493–498. [Google Scholar]
- Cuche EE, Marquet PP, Depeursinge CC. Simultaneous amplitude-contrast and quantitative phase contrast microscopy by numerical reconstruction of Fresnel off-axis holograms. Appl. Opt. 1999;38:6994–7001. doi: 10.1364/ao.38.006994. [DOI] [PubMed] [Google Scholar]
- Defay RR, Prigogine II. Surface Tension and Adsorption. Longmans Green and Co.; London, England; 1966. [Google Scholar]
- Dove PMPM, Platt FMFM. Compatible real-time rates of mineral dissolution by atomic force microscopy. Chem. Geol. 1996;127:331–338. [Google Scholar]
- Dundon MLML, Mack EE., Jr The solubility and surface energy of calcium sulfate. J. Am. Chem. Soc. 1923;45:2479–2485. [Google Scholar]
- Emmanuel SS. Mechanisms influencing micron and nanometer-scale reaction rate patterns during dolostone dissolution. Chem. Geol. 2014;363:262–269. [Google Scholar]
- Fan CC, Teng HHHH. Surface behavior of gypsum during dissolution. Chem. Geol. 2007;245:242–253. [Google Scholar]
- Fischer CC, Arvidson RSRS, Lüttge AA. How predictable are dissolution rates of crystalline material? Geochim. Cosmochim. Acta. 2012;98:177–185. [Google Scholar]
- Fischer CC, Finkeldei SS, Brandt FF, Bosbach DD, Lüttge AA. Direct measurement of surface dissolution rates in potential nuclear waste forms: the example of pyrochlore. ACS Appl. Mater. Interfaces. 2015;7:17857–17865. doi: 10.1021/acsami.5b04281. [DOI] [PubMed] [Google Scholar]
- Fischer CC, Kurganskaya II, Schafer TT, Lüttge AA. Variability of crystal surface reactivity: what do we know? Appl. Geochem. 2014;43:132–157. [Google Scholar]
- Fischer CC, Lüttge AA. Converged surface roughness parameters—a new tool to quantify rock surface morphology and reactivity alteration. Am. J. Sci. 2007;307:955–973. [Google Scholar]
- Fischer CC, Lüttge AA. Beyond the conventional understanding of water-rock reactivity. Earth and Planetary Science Letters. 2017;457:100–105. [Google Scholar]
- Ford DD, William PP. Karst Geomorphology and Hydrology. John Wiley Sons; West Sussex: 2007. [Google Scholar]
- Gasperino DD, Yeckel AA, Olmsted BKBK, Ward MDMD, Derby JJJJ. Mass transfer limitations at crystallizing interfaces in an atomic force microscopy fluid cell: a finite element analysis. Langmuir. 2006;22:6578–6586. doi: 10.1021/la060592k. [DOI] [PubMed] [Google Scholar]
- Hall CC, Cullen DCDC. Scanning force microscopy of gypsum dissolution and crystal growth. AICHE J. 1996;42:232–238. [Google Scholar]
- ISO 25178-2:2012. Geometrical Product Specifications (GPS)–Surface Texture: Areal–Part 2: Terms, Definitions, and Surface Texture Parameters. Standard International Organization for Standardization; Geneva, Switzerland: 2012. [Google Scholar]
- Jackson CLCL, McKenna GBGB. The melting behavior of organic materials confined in porous solids. J. Chem. Phys. 1990;93(12):9002–9011. [Google Scholar]
- Jeschke AA, Vosbeck KK, Dreybrodt WW. Surface controlled dissolution rates of gypsum in aqueous in solutions exhibit nonlinear dissolution kinetics. Geochim. Cosmochim. Acta. 2001;65:27–34. [Google Scholar]
- Jordan GG, Rammensee WW. Dissolution rates of calcite (1014) obtained by scanning force microscopy: microtopography-based dissolution kinetics on surfaces with anisotropic step velocities. Geochim. Cosmochim. Acta. 1998;62:941–947. [Google Scholar]
- Kim MKMK. Principles and techniques of digital holographic microscopy. SPIE Rev. 2010;1:018005. [Google Scholar]
- Knox CC, Sayano RR, Seo EE, Silverman HH. Holographic interferometry in electrochemical studies. J. Phys. Chem. 1967;71:3102–3104. [Google Scholar]
- Kuechler RR, Noack KK, Zorn TT. Investigation of gypsum dissolution under saturated and unsaturated water conditions. Ecol. Model. 2004;176:1–14. [Google Scholar]
- Kühn JJ, Charrière FF, Colomb TT, Cuche EE, Montfort FF, Emery YY, Marquet PP, Depeursinge CC. Axial sub-nanometer accuracy in digital holographic microscopy. Meas. Sci. Technol. 2008;19:074007. [Google Scholar]
- Kumar AA, Reed JJ, Sant GG. Vertical scanning interferometry: a new method to measure the dissolution dynamics of cementitious minerals. J. Am. Ceram. Soc. 2013;96:2766–2778. [Google Scholar]
- Lasaga AA, Lüttge AA. Variation of crystal dissolution rate based on a dissolution stepwave model. Science. 2001;291:2400–2404. doi: 10.1126/science.1058173. [DOI] [PubMed] [Google Scholar]
- Léon-Rodríguez MM, Rodríguez-Vera RR, Rayas JAJA, Calixto SS. High topographical accuracy by optical shot noise reduction in digital holographic microscopy. J. Opt. Soc. Am. A. 2012;29:498–506. doi: 10.1364/JOSAA.29.000498. [DOI] [PubMed] [Google Scholar]
- Liu STST, Nancollas GHGH. The kinetics of dissolution of calcium sulfate dihydrate. J. Inorg. Nucl. Chem. 1971;33:2311–2316. [Google Scholar]
- Lüttge AA. Crystal dissolution kinetics and Gibbs free energy. J. Electron Spectrosc. Relat. Phenom. 2006;150:248–259. [Google Scholar]
- Lüttge AA, Arvidson RSRS. Reactions at surfaces: a new approach integrating interferometry and kinetic simulations. J. Am. Ceram. Soc. 2010;93(11):3519–3530. [Google Scholar]
- Lüttge AA, Arvidson RSRS, Fischer CC. A stochastic treatment of crystal dissolution kinetics. Elements. 2013;9:183–188. [Google Scholar]
- Lüttge AA, Bolton EWEW, Lasaga AA. An interferometric study of the dissolution kinetics of anorthite: the role of reactive surface area. Am. J. Sci. 1999;299:652–678. [Google Scholar]
- Maclnnis ININ, Brantley SLSL. Development of etch pit size distributions on dissolving minerals. Chem. Geol. 1993;105:31–49. [Google Scholar]
- Macpherson JVJV, Unwin PRPR. Scanning electrochemical microscope induced dissolution: rate law and reaction rate imaging for dissolution of the (010) face of potassium ferrocyanide trihydrate in nonstoichiometric aqueous solutions of the lattice ions. J. Phys. Chem. 1995;99:3338–3351. [Google Scholar]
- Mbogoro MMMM, Snowden MEME, Edwards MAMA, Peruffo MM, Unwin PRPR. Intrinsic kinetics of gypsum and calcium sulfate anhydrite dissolution: surface selective studies under hydrodynamic control and the effect of additives. J. Phys. Chem. C. 2011;115:10147–10154. [Google Scholar]
- McGeouch CACA, Peruffo MM, Edwards MAMA, Bindley LALA, Lazenby RARA, Mbogoro MMMMMM, McKelvey KMKM, Unwin PRPR. Quantitative localized proton-promoted dissolution kinetics of calcite using scanning electrochemical microscopy (SECM) J. Phys. Chem. C. 2012;116:14892–14899. [Google Scholar]
- Mindat [accessed 24-August-2016];Gypsum. 2016 http://www.mindat.org/min-1784.html [Online]
- Mullins WWWW. Metal Surfaces: Structure, Energetics and Kinetics. ASM; Cleveland, OH: 1963. Solid surface morphologies governed by capillarity; pp. 17–66. [Google Scholar]
- Pachon-Rodriguez EAEA, Combani JJ. Pure dissolution kinetics of anhydrite and gypsum in inhibiting aqueous salt solutions. AICHE J. 2013;59:1622–1626. [Google Scholar]
- Pan FF, Xiao WW, Liu SS, Rong LL. Application of three-dimensional spatial correlation properties of coherent noise in phase noise suppression for digital holographic microscopy. Opt. Laser Technol. 2013;51:67–71. [Google Scholar]
- Pandey NN, Hennelly BB. Effect of additive noise on phase measurement in digital holographic microscopy. 3D Res. 2011;2:1–6. [Google Scholar]
- Peruffo MM, Mbogoro MM, Edwards MAMA, Unwin PRPR. Holistic approach to dissolution kinetics: linking direction-specific microscopic fluxes, local mass transport effects and global macroscopic rates from gypsum etch pit analysis. Phys. Chem. Chem. Phys. 2013;15:1956–1965. doi: 10.1039/c2cp43555a. [DOI] [PubMed] [Google Scholar]
- Peruffo MM, Mbogoro MMMM, Adobes-Vidal MM, Unwin PRPR. Importance of mass transport and spatially heterogeneous flux processes for in situ atomic force microscopy measurements of crystal growth and dissolution kinetics. J. Phys. Chem. C. 2016;120:12100–12112. [Google Scholar]
- Raines MM, Dewers TT. Mixed transport/reaction control of gypsum dissolution kinetics in aqueous solutions and initiation of gypsum karst. Chem. Geol. 1997;140:29–48. [Google Scholar]
- Rubbo MM, Massaro FRFR, Aquilano DD, Vanzetti WW. Morphology of gypsum: a case study. Cryst. Res. Technol. 2011;46:779–783. [Google Scholar]
- Ruiz-Agudo EE, Urosevic MM, Putnis CVCV, Rodriguez-Navarro CC, Cardell CC, Putnis AA. Ion-specific effects on the kinetics of mineral dissolution. Chem. Geol. 2011;281:364–371. [Google Scholar]
- Saldi GD, Voltolini M, Knauss KG. Effects of surface orientation, fluid chemistry and mechanical polishing on the variability of dolomite dissolution rates. Geochim. Cosmochim. Acta. 2017;206:94–111. [Google Scholar]
- Schnars UU, Jüptner WPOWPO. Digital recording and numerical reconstruction of holograms. Meas. Sci. Technol. 2002;13:R85–R101. [Google Scholar]
- Shindo HH, Seo AA, Itasaka MM, Odaki TT, Tanaka KK. Stability of surface atomic structures of ionic crystals studied by atomic force microscopy observation of various faces of CaSO4 crystal in solution. J. Vac. Sci. Technol. 1996;14:1365–1368. [Google Scholar]
- Singh HH, Bajwa MSMS. Comparison of different models for describing gypsum dissolution kinetics in different aqueous salt solutions. Aust. J. Soil Res. 1990;28:947–953. [Google Scholar]
- Svensson UU, Dreybrodt WW. Dissolution kinetics of natural calcite minerals in CO2-water systems approaching calcite equilibrium. Chem. Geol. 1992;100:129–145. [Google Scholar]
- Weijnen MPCMPC, van Rosmalen GMGM, Bennema PP, Rijpkema JJMJJM. The adsorption of additives at the gypsum crystal surface: a theoretical approach: I. Determination of the interfacial bond energies. J. Cryst. Growth. 1987;82:509–527. [Google Scholar]
- Zhang JWJW, Nancollas GHGH. Mechanisms of growth and dissolution of sparingly soluble salts. Rev. Mineral. Geochem. 1990;23:365–396. [Google Scholar]


