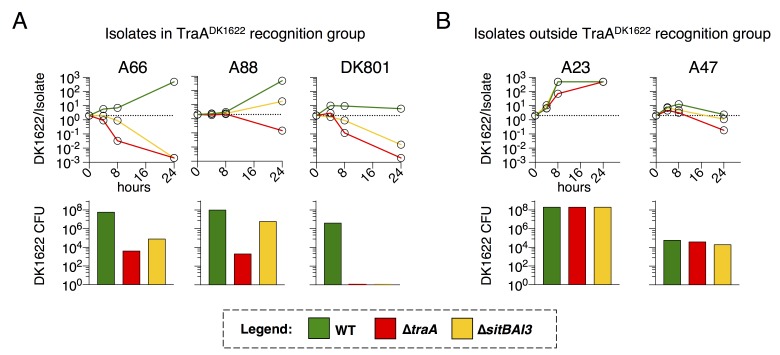
Figure 7. TraA and SitA are dominant determinants of competitive outcome within TraA recognition groups.
(A) Line graphs represent strain ratio over time when the three indicated, DK1622-derived strains, which were fluorescently labelled, were competed with wild isolates (A66, A88, DK801). These isolates belong to the same TraA recognition group as DK1622. Histograms indicate viable cells (CFU) of the DK1622-derived strains (Tcr) after the 24 hr competition. (B) Identical experiments as in A, except the lab strains were competed with wild isolates that belong to different TraA recognition groups.

