

Abstract
Heliotropium digynum, is a shrub that has ecological importance. The height of the plant differs from one population to another and the difference in length of the inflorescence can be attributed to environmental factors, such as rainfall or type of soil and temperature. To date, no study has shed light on estimation in seed samples of H. digynum in Saudi Arabia. So, the aim is to evaluate and characterize the protein patterns of seed storage proteins of H. digynum to be used as fingerprint of this plant in Saudi Arabia. It is collected from different locations in the central region of Saudi Arabia and total protein extraction from plant was compared in SDS-PAGE. The genetic relationships among all cultivars were analyzed using UPGMA and NJ using Total Lab TL and in the same way using Jaccard Similarity Coefficient dendrogram using STATISTICA (ver.8) software. Results, our data show that amounts of protein are different, although they are of the same type or from the same geographical region. Amounts ranged between 22 and 1.5 mg/g of dry weight. Less amount of protein was obtained from the group of samples collected from Dir’iyah area, and the highest amount of protein was from the group of samples collected from Dyrab area in general.
Keywords: Heliotropium digynum, SDS-PAGE, Total proteins, Boraginaceae
1. Introduction
Heliotropium digynum, a member of Boraginaceae family, is an erect perennial shrub, reaching to a height of 30–50 cm above the ground. The growth of the plant, as well as its size, length of inflorescence, and speed of development, depends on the amount of rain in its habitat. The study by Forssk (1877) is regarded as the first work mentioning the presence of the genus Heliotropium, in the Arabian region. It normally grows in areas with deep sand, and is found in north and north east Africa, the Arabian Peninsula, and some other areas of the Middle East (Chaudhary, 2001). In Saudi Arabia, it is found in the form of scattered populations spreading in the Hijaz region, and in the south region. It is also found in some areas of central Saudi Arabia such as Kharj, Muzahimiyah, Dir’iyyah, Zulfi, Unaizah and Rimah.
Electrophoresis method of protein has been developed for the past three decades, to solve many problems. From these advanced methods, the SDS–polyacrylamide electrophoresis discontinuous gel (Dyer et al., 2014), in accordance with (Laemmli, 1970, Rathi et al., 2015) the method which is one of the methods used in scientific studies for its several advantages, such as, it’s being quick and having high-sensitivity, it divides a single protein into parts on the basis of size, and been distributed giving bands with molecular weight variety along the path of the gel (Nelson and Cox, 2009). This method has been used to separate proteins samples of this study to determine the molecular weight of protein separated, and identify the order of patterns of proteins resulting from the genetic expression and study of differences between proteins which have been drawn from the seeds types collected from different regions.
It is well known that the protein is composed of several particles consisting of amino acids and differ from each other depending on the order and number of amino acids or their numbers changed so if a protein differed, it would be changed to another protein, different in molecular weight, type and function, as the proteins structure happens as a result of the process of translating genetic codes ordered on the MRNA, resulting from the copy a particular gene during the process of genetic expression, and every genetic code is linked to a particular amino acid, as the order of amino acids in protein molecule matches the code order on the MRNA, therefore, each gene is coded for a particular number of polypeptides (Pierce, 2010). The mechanism of genetic expression through which a protein is formed as a direct producer gene expression indicates that proteins are seen on gel electrophoresis in the form of different protein patterns (Ehsanpour et al., 2010). Crawford and Julian (1976) believe that change in the quality of protein is considered as a result of accumulated genetic mutation. Patterns that have been separated from the gel, are showed by the single type of growth in different locations. So the change in the genetic compound, which has been observed from the analysis of genetic fingerprint later, may result in the appearance or disappearance of type.
To the knowledge of the author, no study has been reported on protein estimation in seeds samples of H. digynum in Saudi Arabia. The objectives of this paper are evaluation and characterization of the protein patterns of seed storage proteins from H. digynum. (to characterize the leaf and seed proteins).
2. Materials and methods
2.1. Plant material
In this study, plant seeds of (H. digynum) collected from different locations in Saudi Arabia, Central Region; samples were given numbers that distinguish them from each other, according to the sample and location as follows:
-
•
Dyrab: samples given figures from (1 to 5) and symbol D.
-
•
Dir’iyah: samples given figures from (1 to 5) and symbol Dr.
-
•
Kharj: samples given figures from (1 to 5) symbol K.
-
•
Rumah: samples, given the figures from (1 to 5) and symbol R.
2.2. SDS-PAGE analysis
After cleaning and washing the seeds, individual seeds were ground into a fine powder to extract the seed storage proteins. After defeating by washing with 10× n-butyl alcohol (v/w) and dried by vacuum, 100 mg powder of each bulk seed was added into 1.5 ml plastic Eppendorf with 1 ml 0.22 mol/L Tris-HCI buffer (pH 6.8) extraction solution, mixed thoroughly and stored at 4 °C overnight (Chanyou et al., 2006). The mixture was centrifuged at 15,000 rpm for 10 min (angle rotor, 01420, 24-place, Boeco centrifuges U-320, Germany), and 200 μl of the supernatant was put in a new tube and was mixed with 800 μl (1:4, v/v) SDS-PAGE disruption mixture (125 mmol/L Tris HCl pH 6.8, (2.5%) β-mercaptoethanol, (1%) SDS, (5%) glycerol, (0.01%) bromophenol blue dye) (Laemmli, 1970). The sample in Eppendorfs was then heated for 5 min at 95 °C. The storage protein sample solution with concentration of about 1.85–2 mg/ml (Bradford, 1976) was prepared for SDS-PAGE after centrifugation for 5 min. The stacking and resolving gel concentrations were maintained at 4% and 5–11% gradient, respectively. The electrophoresis was carried out under submerged mode using a tank buffer (0.025 M Tris pH 8.3, 0.192 M Glycine, (0.1%) SDS) at a constant voltage (50 V at the beginning and then 25 V) of 50 mA in a protein gel apparatus. The amount of sample was 50 μl. Gels were fixed with (10% (w/v)) TCA solution, stained with (0.25% (w/v)) Coomassie brilliant blue R250 and then de-stained with a solution containing 15 ml ethanol (15%), 175 ml acetic acid (5%) and 60 ml distilled water till the background became transparent (Howland, 1996). Stock solutions were prepared before making a working solution.
2.3. Data analysis
The presence (1) and absence (0) of each band were analyzed in each Sample. The binary data matrix was used to calculate JSI. The genetic relationships among all cultivars analyzed were surveyed in three dendrograms, applying UPGMA and NJ using Total Lab TL and in the same way Jaccard Similarity Coefficient dendrogram using STATISTICA (ver.8) software (Goncalves et al., 2008, Buyukunal Bal and Bay, 2009). The goodness of the dendrogram was assessed by bootstrap analysis with the WINBOOT program and 1000 repeated samplings with the replacement and selecting the Jaccard’s Similarity Coefficient. The standard curve, to calculate molecular weight for each band, was drawn by Total Lab TL software according to MW protein markers and their pixel positions on the gel with quadratic type curve. PCA was performed by computing the data matrix (Abdi and Williams, 2010).
3. Results
It was found that the amounts of protein in the sample in the study are different, although they are of the same type or from the same geographical region. Amounts ranged between (22 and 1.5) mg/g of dry weight. The less amount of protein was the group of samples collected from Dir’iyah area, and the highest amount of protein was the group of samples collected from Dyrab area in general. The other 2 areas of Alkharj and Rumah samples ranged between estimations, see Table 1, Table 2.
Table 1.
Total protein in plant seed samples H. digynum from different locations in the central region of Saudi Arabia.
| Sample name | Protein quantity in mg/g dry weight |
|---|---|
| D1 | 2.39 |
| D2 | 2.4 |
| D3 | 2.45 |
| D4 | 2.5 |
| D5 | 2.34 |
| Dr1 | 1.9 |
| Dr2 | 2.0 |
| Dr3 | 2.1 |
| Dr4 | 2 |
| Dr5 | 2 |
| K1 | 2.2 |
| K2 | 2.36 |
| K3 | 2.33 |
| K4 | 2.34 |
| K5 | 2.28 |
| R1 | 2.37 |
| R2 | 2.37 |
| R3 | 2.33 |
| R4 | 2.37 |
| R5 | 2.4 |
Table 2.
Matrix percentage similarity of proteins separated using the software programe.
| D1 | D2 | D3 | D4 | D5 | Dr1 | Dr2 | Dr3 | Dr4 | Dr5 | K1 | K2 | K3 | K4 | K5 | R1 | R2 | R3 | R4 | R5 | |
|---|---|---|---|---|---|---|---|---|---|---|---|---|---|---|---|---|---|---|---|---|
| D1 | 1.00 | |||||||||||||||||||
| D2 | 0.75 | 1.00 | ||||||||||||||||||
| D3 | 0.89 | 0.85 | 1.00 | |||||||||||||||||
| D4 | 0.48 | 0.70 | 0.57 | 1.00 | ||||||||||||||||
| D5 | 0.75 | 0.90 | 0.85 | 0.62 | 1.00 | |||||||||||||||
| Dr1 | 0.67 | 0.65 | 0.68 | 0.38 | 0.65 | 1.00 | ||||||||||||||
| Dr2 | 0.79 | 0.85 | 0.90 | 0.57 | 0.85 | 0.78 | 1.00 | |||||||||||||
| Dr3 | 0.78 | 0.75 | 0.79 | 0.48 | 0.75 | 0.88 | 0.79 | 1.00 | ||||||||||||
| Dr4 | 0.72 | 0.70 | 0.74 | 0.43 | 0.70 | 0.81 | 0.74 | 0.94 | 1.00 | |||||||||||
| Dr5 | 0.74 | 0.80 | 0.75 | 0.52 | 0.90 | 0.63 | 0.75 | 0.74 | 0.68 | 1.00 | ||||||||||
| K1 | 0.65 | 0.80 | 0.75 | 0.60 | 0.80 | 0.63 | 0.75 | 0.74 | 0.78 | 0.70 | 1.00 | |||||||||
| K2 | 0.79 | 0.85 | 0.90 | 0.57 | 0.85 | 0.60 | 0.80 | 0.70 | 0.74 | 0.75 | 0.84 | 1.00 | ||||||||
| K3 | 0.70 | 0.76 | 0.71 | 0.57 | 0.76 | 0.60 | 0.71 | 0.70 | 0.65 | 0.75 | 0.67 | 0.71 | 1.00 | |||||||
| K4 | 0.67 | 0.81 | 0.76 | 0.62 | 0.81 | 0.57 | 0.76 | 0.67 | 0.62 | 0.71 | 0.71 | 0.76 | 0.95 | 1.00 | ||||||
| K5 | 0.84 | 0.90 | 0.95 | 0.62 | 0.90 | 0.74 | 0.95 | 0.84 | 0.79 | 0.80 | 0.80 | 0.85 | 0.76 | 0.81 | 1.00 | |||||
| R1 | 0.70 | 0.85 | 0.80 | 0.57 | 0.85 | 0.78 | 0.90 | 0.79 | 0.74 | 0.75 | 0.75 | 0.80 | 0.71 | 0.76 | 0.85 | 1.00 | ||||
| R2 | 0.43 | 0.57 | 0.52 | 0.61 | 0.57 | 0.47 | 0.52 | 0.50 | 0.53 | 0.55 | 0.63 | 0.60 | 0.46 | 0.50 | 0.57 | 0.60 | 1.00 | |||
| R3 | 0.50 | 0.64 | 0.59 | 0.68 | 0.64 | 0.41 | 0.59 | 0.50 | 0.52 | 0.62 | 0.62 | 0.67 | 0.67 | 0.71 | 0.64 | 0.59 | 0.72 | 1.00 | ||
| R4 | 0.55 | 0.70 | 0.65 | 0.50 | 0.70 | 0.71 | 0.74 | 0.63 | 0.58 | 0.60 | 0.60 | 0.65 | 0.57 | 0.62 | 0.70 | 0.83 | 0.61 | 0.52 | 1.00 | |
| R5 | 0.65 | 0.80 | 0.75 | 0.52 | 0.80 | 0.82 | 0.84 | 0.74 | 0.68 | 0.70 | 0.70 | 0.75 | 0.67 | 0.71 | 0.80 | 0.94 | 0.63 | 0.55 | 0.88 | 1.00 |
3.1. Qualitative estimation of protein by electrophoresis
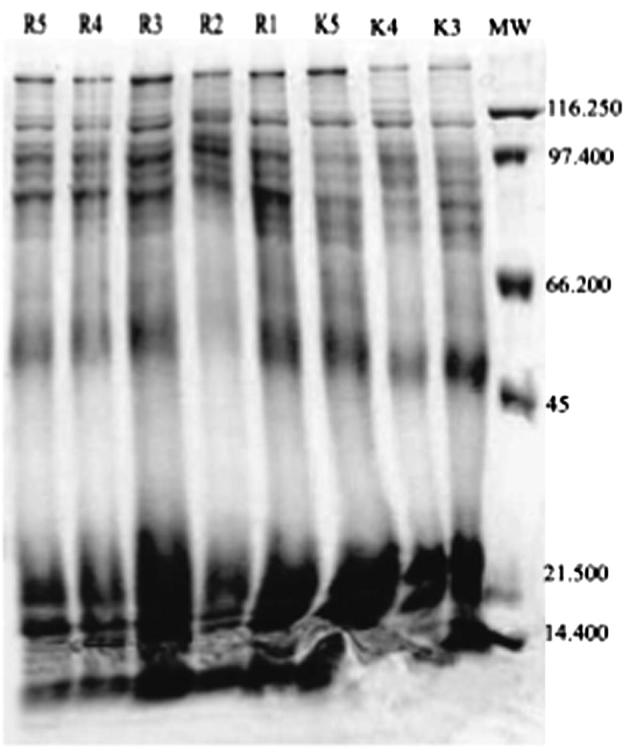
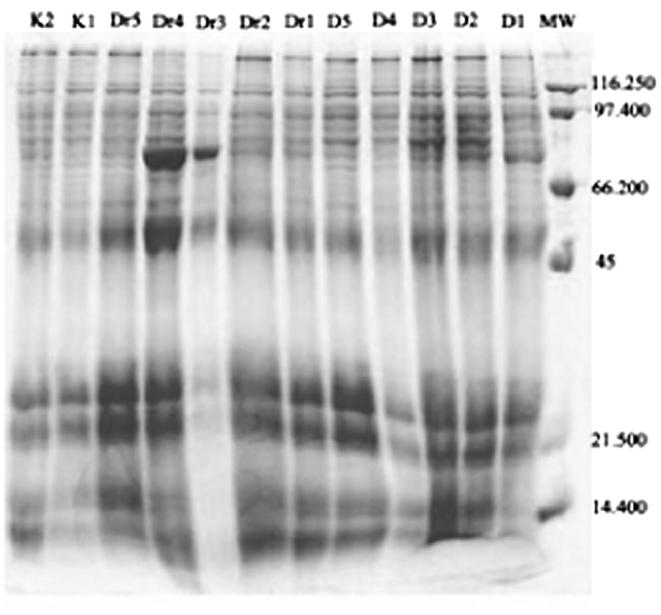
The results of the electrophoresis for existing types of proteins in samples of the type H. digynum, that were collected from different locations in the central region of Saudi Arabia. There was a difference in the total number of separated protein in the form of bands on the gel, and differences also in thickness of these bands and the degree of intensity, which shows the difference in the amount of proteins.
When comparing the behavior of the samples examined separately from the images Figure 1, Figure 2 and Table 1 noted that there is a difference in the number of protein separation and it’s intensity in the samples from each site, and even on the same site level. Samples D2, D5, K4, K5 gave (20) protein bands out of (23) in samples Dr2, K1, K2, K3 gave (19) protein bands while samples D3, Dr5, R3, R5 gave (18) protein package and (17) protein package in the samples D1, D4, Dr5, Dr3 and samples R2, R4 gave a 16 protein package. Finally Dr1, Dr4 gave a 15 protein package. These protein bands are varying in protein content for the reasons of thickness and thinness of the bands on the gel.
Figure 1.
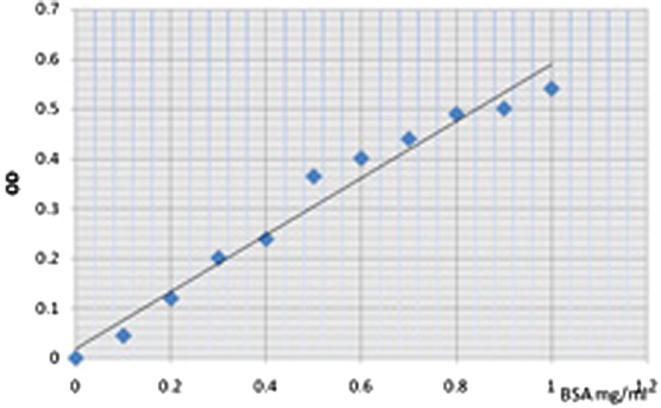
Standard curve of albumin (0.1–1) mg/ml.
Figure 2.
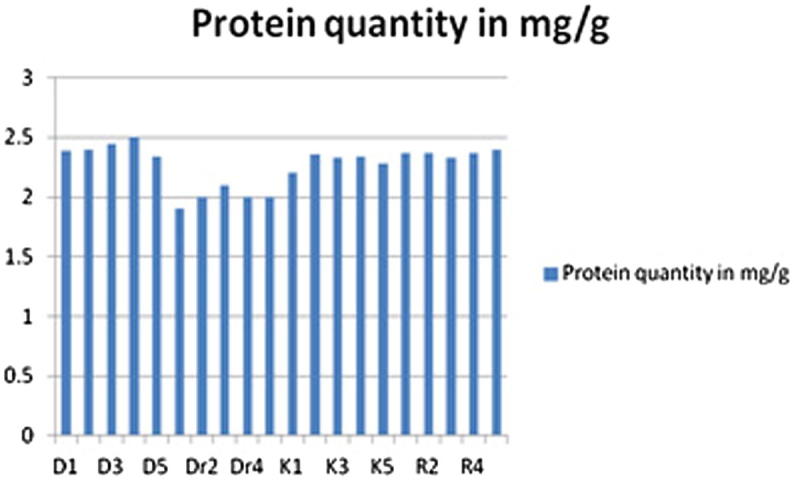
Protein concentration (mg/g) in the samples seeds of H. diygun from different sites of from the central region of Saudi Arabia.
20 Protein bands out of 23 showed a polymorphic manner and 3 protein bands appeared in monomorphic manner. Thus, the percent of polymorphism of samples on the basis of protein results is 86.95% and the ratio of similarity between samples is 13.04%. All samples showed variety in the intensity and the emergence of protein bands at different molecular weights, according to what is shown in the Table 1. It is noticeable that both Dr3 and Dr4 had contained clear and thick protein bands compared to other clear protein bands of other samples at the molecular-weight of about 80 K Da.
3.2. Similarity and difference between samples
The relationship between of genetic combinations applying the matrix percentages of (SI) similarity using the program (MVSP) MVSP 3.1 – a multivariate statistical package, where the high values of this matrix indicate a genetic similarity and lower values increases the contrast between genetic combinations studied.
Note from Table 2 that the least value of SI is 0.38 between genetic combinations Dr4 and D 1. In other words, these 2 samples are on a high degree of genetic divergence, while the highest value of the SI is 0.95 between genetic combinations K3 and K4 thus, these 2 samples are on a high degree of genetics convergence, and between these two values the degrees of convergence range between the remaining samples.
Cluster analysis allows division of studied species into groups, and reflects the degree of genetic convergence among them, the samples may gather within one group based on the degree of genetic convergence among them. The cluster analysis of the results obtained is done to establish a tree of genetic convergence. It was noted from the Fig. 1 that the cluster analysis was divided into two major groups at the beginning in genetic dimension (% 42), under which a number of totals in the form of cluster form and gradient would be genetically divergent to convergent, and species collected from more closer sites with the same surrounding environmental conditions came more closer in genetic distance (Figure 3, Figure 4).
Figure 3.
Comparing types of proteins between samples H. digynum from different locations in the central region of the image.
Figure 4.
Comparing types of proteins between samples H. digynum from different locations in the central region of Saudi Arabia.
It has been found that samples Dr4 and Dr3 from Dir’iyah were taking their place in the kinship tree as an independent group, which indicates that the protein which came in the form of gel, image (2) was different from many other samples proteins on the same gel which did belong to one group (Fig. 5).
Figure 5.

Tree of genetic kinship (dendrogram) for seeds protein of sample H. digynum in the central region of Saudi Arabia.
4. Discussion
Seeds contain one or more groups of proteins that are present in high amounts and that serve to provide a store of amino acids for use during germination and seedling growth. These storage proteins are of particular importance because they determine not only the total protein content of the seed but also its quality for various end users in metabolism, (Shewry et al., 1995). In the present study, the quantity of protein ranged between 1.5 and 22 mg/g for dry weight, the highest amount of protein content was seen in samples collected from Dyrab. Perhaps this is due to the difference in the environment of plants of climatic conditions or breeding, where it is well-known that the rich materials, fertilizers, nutrients in soil play a role in the content of the plant of organic materials that is consistent with (Zanen et al., 2008).
The results for types of proteins in samples of the type H. digynum from different locations in the central region of Saudi Arabia showed that there is a difference in the total number of proteins separated on bands formed on the gel, thickness and differences in the degree of intensity, which shows the difference in the amount of proteins. and the cause of these differences is not exactly known, several studies showed that change in protein groups of the plant’s cell is important for the plant to be able to adapt to the environmental changes, that change may be due to factors within the plant, as growth organizers or chemical materials resulting from metabolic syndrome affects the activity of genes (Salisbury and Ross, 1991, Wareing and Philips, 1985).
It was observed that the seeds of H. digynum separates into several bands by SDS-PAGE and protein-page and there are no detailed studies on proteins of H. digynum seeds as it is for crop plants such as artichoke (Sergio et al., 2005) and tomatoes (Elizabeta et al., 2008) that the difference in protein patterns of seed extracts indicates genetic differences between samples, and even between samples of the same type growing in different locations, in line with other studies about other plants seeds such as Pine (Allona et al., 1996) and sunflower (Rodriguez et al., 2002, Larsen, 1967).
Nominally versatile of protein patterns by 86.95% while gave similar formality by 13.04%, and that the density of protein bands was different between samples examined, and such manner is used in classification and showing differences between plant species in general, what is consistent with Ladizinsky and Hymowitz (1979) who adopted the electrophoresis of seeds protein to determine the classification status for the different classifying categories. Knowing that comparing the content of protein bands in this study was examined by abstractive vision, therefore, they are not accurate in identifying genetic differences, this multiform of bands indicates the existence or the possibility of differences occurrence in the genetic structure between samples.
H. digynum collected from different geographical locations did not meet with each other on a kinship tree, what confirms the impact of geographical region on proteins samples seeds, which is consistent with the study of (Kamel, 2005) on the species of kambnywla have been obtained and classified based on the proteins of seeds, where the study showed that the species of kambnywla that had been obtained from different geographical areas did not meet with each other on the kinship tree, what confirms the impact of geographical region on the proteins of species seeds themselves. Gibson (2008) mentioned that environmental factors affect clearly on the genetic expression of genes, as the circumstances surrounding the plant, and the cell as well has got a key role in organizing the function of the gene to do its work in genetic expression, and may discourage the work of other genes, as a result of that emergence or absence of some proteins. Plant evolutionary and physiological processes vary extremely as a result of the difference in temperatures surrounding the plant, as these are essential changes to enable plants to adapt to surrounding environmental changes.
Acknowledgements
The author extended their appreciation to Deanship of Scientific Research at King Saud University for funding the work through the research group project No. RG-1435-086.
Footnotes
Peer review under responsibility of King Saud University.
References
- Abdi H., Williams L.J. Principal component analysis. Wiley Interdiscip. Rev. Comput. Stat. 2010;2(4):433–459. [Google Scholar]
- Allona I., Collada C., Casado R., Paz-Ares J., Aragoncillo C. Bacterial expression of an active class Ib chitinase from Castanea sativa cotyledons. Plant Mol. Biol. 1996;32:1171–1176. doi: 10.1007/BF00041402. [DOI] [PubMed] [Google Scholar]
- Bradford M.M. A rapid and sensitive method for the quantitation of microgram quantities of protein utilizing the principle of protein-dye binding. Anal. Biochem. 1976;72(1):248–254. doi: 10.1016/0003-2697(76)90527-3. [DOI] [PubMed] [Google Scholar]
- Buyukunal Bal E.B., Bay S. Genetic analysis of Turkish rice varieties (Oryza sativa L.) using seed storage proteins and RAPD markers. Eur. Food Res. Technol. 2009;230(4):609–617. [Google Scholar]
- Chanyou C., Lei P., Yaojun H., Zhihui H., Yi D. Analysis of genetic variation of seed proteins in the genus vigna and among its relatives cultivated in China. Wuhan Univ. J. Nat. Sci. 2006;11(3):725–731. [Google Scholar]
- Chaudhary A. Flora of Saudi Arabia. Ministry Agric. Water – Riyadh. 2001;2(part 2):223–285. 542p. [Google Scholar]
- Crawford D.J., Julian E.A. Seed protein profiles in the narrow-leaved species of Chenopodium of the western United States: taxonomic value and comparison with distribution of flavonoid compounds. Am. J. Bot. 1976;63(3):302–308. [Google Scholar]
- Dyer L.A., Wu Y., Patterson C. Protein isolation from the developing embryonic mouse heart valve region. J. Vis. Exp. 2014;23(91):51911. doi: 10.3791/51911. [DOI] [PMC free article] [PubMed] [Google Scholar]
- Ehsanpour A.A., Shojaie B., Rostami F. Characterization of seed storage protein patterns of four Iranian Pistachios using SDS-PAGE. Nat. Sci. 2010;2(07):737–740. [Google Scholar]
- Elizabeta Miskoska-Milevska, Blagica Dimitrievska, Koo Poru, Popovski Zoran T. Differences in tomato seed protein profiles obtained by SDS-PAGE analysis. J. Agric. Sci. 2008;53(1):14–23. [Google Scholar]
- Forssk P. Royal Botanic Gardens; Kew: 1877. The Plants of Pehr Forsskal’s “Flora Aegyptiaco-Arabica”; pp. 86–89. [Google Scholar]
- Gibson G. The environmental contribution to gene expression profiles. Nat. Rev. Genet. 2008;9:575–581. doi: 10.1038/nrg2383. [DOI] [PubMed] [Google Scholar]
- Goncalves L.S., Rodrigues R., Amaral A.T., Jr., Karasawa M., Sudre C.P. Comparison of multivariate statistical algorithms to cluster tomato heirloom accessions. Genet. Mol. Res. 2008;7(4):1289–1297. doi: 10.4238/vol7-4gmr526. [DOI] [PubMed] [Google Scholar]
- Howland J.L. John Wiley and Sons Inc.; New York: 1996. Current Protocols in Protein Science. [Google Scholar]
- Kamel E.A. Biochemical and molecular variations in of the genus Raphanus L. based on SDS-PAGE seed proteins and isozymes patterns. Bull. Fac. Sci. Assiut Univ. 2005 [Google Scholar]
- Ladizinsky G., Hymowitz T. Seed protein electrophoresis in taxonomic and evolutionary studies. Theor. Appl. Genet. 1979;54:145–151. doi: 10.1007/BF00263044. [DOI] [PubMed] [Google Scholar]
- Laemmli U.K. Cleavage of structural proteins during the assembly of the head of bacteriophage T4. Nature. 1970;227(5259):680–685. doi: 10.1038/227680a0. [DOI] [PubMed] [Google Scholar]
- Larsen S. Soil phosphorus. Adv. Agron. 1967;19:151–210. [Google Scholar]
- Nelson D., Cox M. fifth ed. Freeman; New York: 2009. Lehninger Principles of Biochemistry. (Chapter 5), pp. 159–189. [Google Scholar]
- Pierce B.A. Macmillan; 2010. Genetics: A Conceptual Approach. [Google Scholar]
- Rathi M.A., Meenakshi P., Gopalakrishnan V.K. Hepatoprotective activity of ethanolic extract of Alysicarpus vaginalis against nitrobenzene-induced hepatic damage in rats. South Ind. J. Biol. Sci. 2015;1(2):60–65. [Google Scholar]
- Rodriguez D.J., Romero-Garcia J., Rodriguez-Garcia R., Angulo-Sanchez J.L. Characterization of proteins from sunflower leaves and seeds: relationship of biomass and seed yield. In: Janick J., Whipkey A., editors. Trends in New Crops and New Uses. ASHS Press; Alexandria, VA: 2002. pp. 143–149. [Google Scholar]
- Salisbury F.B., Ross C.W. fourth ed. Wadsworth Publishing Company; Belmont, CA: 1991. Plant Physiology. [Google Scholar]
- Sergio F., Newton I., Marchesi L. Top predators and biodiversity. Nature. 2005;236:192. doi: 10.1038/436192a. [DOI] [PubMed] [Google Scholar]
- Shewry Peter R., Napier Johnathan A., Tatham Arthur S. Seed storage proteins: structures’ and biosynthesis. Am. Soc. Plant Physiol., Plant Cell. 1995;7:945–956. doi: 10.1105/tpc.7.7.945. [DOI] [PMC free article] [PubMed] [Google Scholar]
- Wareing P.F., Philips I.D.J. Pergamon Press; Oxford, NewYork: 1985. Growth and Differentiation in Plants. [Google Scholar]
- Zanen M., Bokhorst J.G., Koopmans C.J. 16th IFOAM Organic World Congress, Modena, Italy, 2008. 2008. Soil Fertility and biodiversity effects from organic amendments in organic farming. [Google Scholar]