

Abstract
Purpose
To study the feasibility of black-blood contrast in native T1 mapping for reduction of partial-voluming at the blood-myocardium interface.
Methods
A saturation-pulse prepared heart-rate independent inversion recovery (SAPPHIRE) T1 mapping sequence was combined with motion sensitized driven equilibrium (MSDE) blood-suppression for black-blood T1 mapping at 3T. Phantom scans were performed to assess the T1 time accuracy. In-vivo black-blood and conventional SAPPHIRE T1 mapping was performed in eight healthy subjects and analyzed for T1 times, precision and inter- and intra-observer variability. Furthermore, manually drawn ROIs in all T1 maps were dilated and eroded to analyze the dependence of septal T1 times on the ROI thickness.
Results
Phantom results and in-vivo myocardial T1 times show comparable accuracy with black-blood compared to conventional SAPPHIRE (In-vivo: Black-blood: 1562±56ms vs. Conventional: 1583±58ms, p=0.20); Using black-blood SAPPHIRE precision was significantly lower (standard-deviation: 133.9±24.6ms vs. 63.1±6.4ms, p<.0001), and blood T1 time measurement was not possible. Significantly increased inter-observer Interclass-correlation-coefficient (ICC) (0.996 vs. 0.967, p=0.011) and similar intra-observer ICC (0.979 vs. 0.939, p=0.11) was obtained with the black-blood sequence. Conventional SAPPHIRE showed strong dependence on the ROI thickness (R2=0.99). No such trend was observed using the black-blood approach (R2=0.29).
Conclusion
Black-blood SAPPHIRE successfully eliminates partial-voluming at the blood-pool in native myocardial T1 mapping, while providing accurate T1 times, albeit at a reduced precision.
Keywords: T1 Mapping, SAPPHIRE, MSDE, Black-blood, partial-voluming
Introduction
Quantitative tissue characterization of the myocardium using cardiac magnetic resonance imaging (CMR) has emerged as a promising diagnostic tool with clinical value in numerous cardiomyopathies (1). Recently, native myocardial T1 mapping has also shown prognostic value in pathologies with reduced myocardial wall thickness, such as dilated cardiomyopathy (DCM) (2,3).
Myocardial T1 mapping is commonly performed using a series of end-diastolic single-shot images acquired within a single breath-hold (4,5). Variable magnetization preparation of the single-shot images induces varying T1 weighted contrast and enables voxel-wise T1 quantification.
However, the limited duration of the diastolic quiescence requires rapid imaging and restricts the in-plane resolution. This leads to major partial-voluming effects at the myocardial-blood interface due to substantial differences in their respective T1 times. Partial-voluming reduces the myocardial area that is suitable for quantitative evaluation, impairs the reproducibility and hampers the depiction of thin structures (6).
Segmented acquisition of the T1 weighted images has been proposed to mitigate this shortcoming by improving the in-plane resolution (7-9). Similarly, T1 quantification at systole has been proposed to increase the number of voxels within the myocardium that are not subject to partial-voluming (10). However, residual partial-voluming can still be expected even at higher resolutions or with increased myocardial wall thickness, especially in oblique orientations. Another approach to overcome this issue is blood-suppression: In-flow saturation at the great vessels has been used to induce black-blood contrast (11) in the pre-clinical mouse model (12). Furthermore, a recent study presented preliminary data on the use of motion-sensitized driven equilibrium (MSDE) (13) for black-blood T1 mapping in humans (14). Both approaches achieved promising black-blood image quality but with reduced repeatability.
In this study we sought to develop a MSDE prepared black-blood native T1 mapping method using combined saturation and inversion recovery magnetization preparation. Numerical simulations were performed to study the effects of blood-suppression on partial-voluming. Phantom scans and in-vivo experiments in healthy volunteers were carried out to optimize the black-blood imaging parameters and to evaluate the proposed method on efficient blood signal suppression and homogeneous T1 quantification.
Methods
Sequence
Black-blood T1 mapping was performed using a modified Saturation Pulse Prepared Heart-rate independent Inversion REcovery (SAPPHIRE) (15) technique. A MSDE preparation was inserted directly before the balanced Steady-State Free-Precession (bSSFP) imaging readout (Figure 1a). In a MSDE preparation a non-selective 90° tip-down pulse, a series of one or more 180° refocusing pulses and a final 90° tip-up pulse are used to encode the spin-dephasing in the longitudinal magnetization (Figure 1b). Strong gradients with identical gradient moments are placed before and after the refocusing pulses to induce dephasing of differentially moving tissue.
Figure 1.
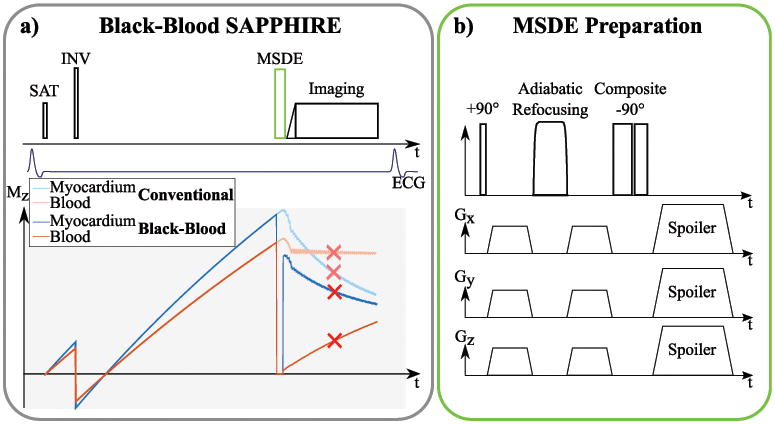
a) Sequence scheme of the proposed black-blood T1 mapping method. As in conventional SAPPHIRE, a saturation pulse is played at the detection of the R-wave followed by an inversion pulse after a variable delay. For black-blood SAPPHIRE an additional MSDE preparation is inserted right before the imaging pulses. b) Sequence diagram of a MSDE preparation, consisting of a tip-down, a refocusing and a tip-up pulse. Strong motion-sensitizing gradients are inserted before and after the refocusing pulse.
Numerical Simulations
Numerical simulations of a bi-compartment model have been performed to study the effect of partial-voluming on the T1 estimation in a SAPPHIRE sequence. A myocardial-tissue compartment has been simulated with T1/T2=1580ms/50ms and a blood-compartment with T1/T2=2300ms/250ms. In this noise free simulation, the signal strength of the myocardial compartment, relative to the blood compartment, was chosen as the signal-to-noise ratios (SNR) for myocardium over the SNR of blood obtained from literature values (16): Without MSDE: Myocardium/Blood=117/119; With MSDE: Myocardium/Blood=95/11. The relative compartmental share between the blood and myocardium was varied between 0% and 100%. The overall signal of the SAPPHIRE sequence with and without MSDE preparation was simulated using the Bloch-equations. T1 times were obtained by fitting a three-parameter model to the simulated signal intensities using a non-linear Levenberg-Marquardt least-squares optimization (17).
To study the visual effects of partial-voluming, a numerical representation of a cardiac short-axis slice was simulated with blood and myocardial compartments of the left and right ventricle. The numerical phantom was generated with a matrix size of 1024×1024 pixels and subsequently down-sampled using bilinear interpolation in order to induce partial-voluming. Matrix-sizes after down-sampling were chosen to correspond to approximate pixel resolutions of 1.5×1.5-3.0×3.0 mm2. To facilitate comparability between different resolutions, all images were then up-sampled to a reconstruction resolution of 0.5×0.5 mm2 prior to further processing. Bloch-equations were used to simulate voxel-wise signals of the numerical phantom, using the same myocardium and blood compartments as described above. Subsequent fitting with a three-parameter model was used to generate the T1 maps.
Imaging
All imaging was performed on a 3T scanner (Magnetom Skyra; Siemens Healthcare, Erlangen, Germany) with a 30 channel receive array.
All T1 mapping sequences have been performed with the following imaging parameters: TR/TE = 2.9/1.0 ms, flip-angle = 45°, bandwidth = 1085 Hz/Px, FOV = 400×300 mm2, in-plane resolution = 2.1×2.1 mm2, partial-fourier = 6/8, GRAPPA-factor 2, number of phase-encoding steps = 56. The flip-angle was adjusted if specific absorption rate (SAR) limitations were reached.
In the present MSDE implementation the black-blood gradients were played out with all three gradient coils, maximum gradient amplitude of 20 mT/m per axis and a slew-rate of 150 mT/m/ms leading to gradient ramp durations of 0.14 ms. Motion-sensitizing gradient duration was maximized within the gaps between the respective tip-up/-down and the refocusing pulse. MSDE echo time was fixed to TEMSDE = 11 ms, if not stated otherwise.
Phantom
Imaging has been performed in a static phantom to study B1+ uniformity of various MSDE preparation modules and to verify the accuracy of the black-blood SAPPHIRE sequence.
The following three MSDE preparation modules with different combinations of RF pulses were tested for B1+ uniformity in a homogeneous phantom containing NaCl-doped water: 1) Rectangular 90° hard-pulses for tip-down and tip-up and a single 180° MLEV refocusing pulse as proposed in (16). 2) A rectangular 90° hard-pulse for tip-down, an adiabatic 180° BIREF1 refocusing pulse and a composite (270° - 360°) tip-up pulse. 3) A 0° degree three compartment BIR4 pulse, with the MSDE gradients inserted symmetrically between the compartments (18,19). The timing of the RF pulses in the MSDE modules is detailed in Supporting Table S1. The echo-time of the three MSDE modules was fixed to TEMSDE = 15 ms. B1+ uniformity was assessed as the signal of a MSDE prepared single-shot image normalized by the signal of a single-shot image without MSDE preparation. The imaging parameters were as described above.
Furthermore, accuracy of the SAPPHIRE black-blood sequence was evaluated in phantom scans. The phantom was composed of seven vials containing agarose-gel doped with various concentrations of gadoterate meglumine (Dotarem; Guerbet, Aulnay-sous-Bois, France) to achieve T1 and T2 times in the physiological range. The combination of composite-pulses and the adiabatic refocusing was used for MSDE preparation in the remainder of the study. Conventional SAPPHIRE without MSDE preparation was performed as a reference. The T1 times obtained with the SAPPHIRE black-blood sequence were compared to conventional SAPPHIRE using Bland-Altman analysis.
In-vivo
The study was approved by the local institutional review board (IRB) and written informed consent was obtained from all subjects prior to scanning.
The black-blood preparation was optimized in a cohort of five healthy subjects (3 male, 29±4 years old). Baseline images without saturation/inversion preparation, as acquired in the SAPPHIRE black-blood sequence, were obtained with varying the echo time TEMSDE from 10 ms to 14 ms. The effectiveness of blood-suppression was quantitatively analyzed as the contrast-to-noise ratio (CNR) between the left-ventricular myocardium and the left-ventricular blood-pool. To capture the effects of stagnant blood in the CNR, manually drawn endocardial contours, covering the entire LV blood-pool were used for signal analysis of the blood. Signal heterogeneity in the myocardium, caused by the MSDE preparation, was quantitatively analyzed as the coefficient of variation (COV) of the signal over the entire myocardium between the epi- and the endocardial contours.
A separate cohort of eight healthy volunteers (4 male, 28±4 years old) was recruited for T1 time analysis. Imaging was performed using standard and black-blood SAPPHIRE in three short-axis slices and one four-chamber slice. T1 times were evaluated using manually drawn ROIs. Average segmental T1 times were assessed according to the AHA 16-segment model. Precision was obtained as the average inter-segment variation. SNR of the baseline image without saturation/inversion preparation was analyzed for both sequences, based on the signal of the two septal segments in the most basal slice, over the standard-deviation in a noise area. The average myocardial thickness was assessed between the manually drawn epi- and endocardial contours: 1000 spokes through the center of mass were uniformly spread around the myocardium. Thickness was then defined as the average distance of the crossing point of the spoke with the endo- and epicardial border, respectively. T1 times, T1 time precision and average myocardial ROI thickness were compared between conventional and black-blood SAPPHIRE on a per subject basis using student's t-test. P-values <0.05 were considered to be significant.
Partial-voluming effects in the myocardium were visualized by analyzing the transmural T1 times in five rings around the myocardium from the endo- to the epicardial border. The rings were divided in three segments around the myocardium (septal, antero- and inferolateral). Average T1 time per segment and per ring was then compared between conventional and black-blood SAPPHIRE.
Inter- and intra-observer variability was studied for black-blood and conventional T1 Mapping. Two readers draw a total of three ROI sets (Reader 1: ROIs A, ROIs B, Reader 2: ROIs C). Intra-observer variability was studied comparing the T1 times obtained with ROIs A and ROIs B on a per-subject basis. To obtain the inter-observer variability the per-subject mean of the T1 obtained with ROIs A and ROIs B (average of Reader 1) were compared to ROIs C (Reader 2). One subject, where segments had to be excluded due to SSFP imaging artifacts, was excluded from the consistency analysis, to avoid reproducibility errors caused by differential artifact inclusion. Inter- and intra-observer consistency was analyzed using the interclass correlation coefficient (ICC) based on Winer's adjustment of anchor points (20,21). The ICCs between the two sequences were statistically compared for inter- and intra-observer analysis using F-statistics. Absolute agreement in the inter- and intra-observer reproducibility was assessed according to Bland and Altman (22). Paired t-tests were used to assess differences in the bias between the two sequences, and F-tests were used to analyze differences in the variance of the agreement. A significance level of p < 0.05 was used for all statistical tests, and consistency intervals are reported for a 95% level.
Furthermore, quantitative analysis of the in-vivo partial-voluming was performed by retrospective alteration of the manually drawn ROIs, as proposed in (10). The binary ROI masks were eroded or dilated by up to two and four pixels, respectively, to decrease/increase the myocardial ROI thickness. The average T1 times in the five septal AHA segments, which are in the vicinity of both blood-pools, were compared between conventional and black-blood SAPPHIRE at the various altered ROIs. Correlation between the septal T1 time and the ROI thickness were identified using Pearson's correlation-coefficient. Furthermore, one-way analysis of variance (ANOVA) was employed to test the T1 times at various ROI thicknesses for differences in the mean, to exclude nonlinear trends. P-values <0.05 were considered to be significant.
Results
Numerical Simulations
Figure 2 shows the T1 time in a simulated voxel with partial signal contribution of blood and myocardium. T1 times assessed with conventional SAPPHIRE increases linearly with increased share of blood-signal in the voxel. The black-blood approach successfully reduces the impact of blood-signal in the voxel, leading to substantially steeper myocardial-blood transitions.
Figure 2.
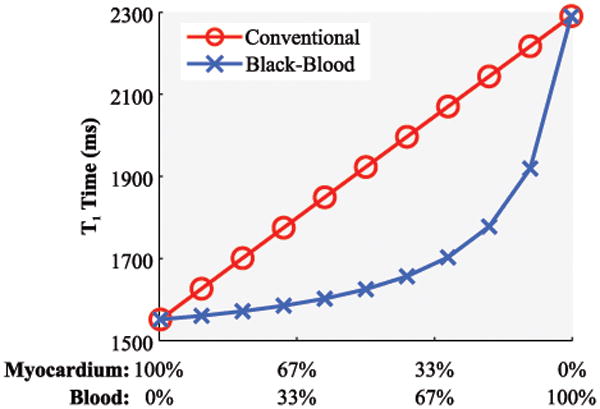
Simulated T1 time in a voxel with partial-voluming at varying signal contributions of blood and myocardium using conventional and black-blood SAPPHIRE. A linear increase of the T1 time is observable with more blood contribution, when using conventional SAPPHIRE. The blood-myocardial transition is substantially steepened using the proposed black-blood technique.
The visual impact of this partial-voluming reduction on the numerical phantom is depicted in Figure 3. Using conventional SAPPHIRE, apparent myocardial thickness reduces with coarser sampling resolution, creating smoothed edges at the blood-myocardial interface. This trend is also highlighted in the line plots: Coarse sampling leads to flat slopes towards the blood-pool and a reduced width of the plateau with uncorrupted myocardial T1 times. The black-blood preparation, on the other hand maintains steep slopes and a broad area with largely uncorrupted T1 times as apparent in the line plots (Figure 3b). This leads to increased myocardial thickness in the numerical phantom.
Figure 3.
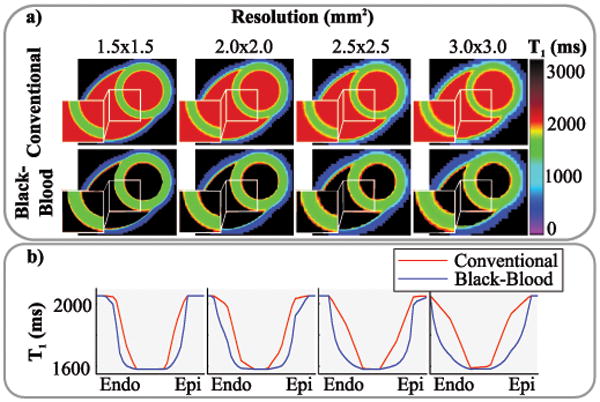
a) T1 maps generated from numerical phantoms at various resolutions to obtain a varying degree of partial-voluming. Decreased myocardial thickness can be observed with conventional T1 mapping at coarser resolutions. Black-blood T1 mapping mitigates this effect. b) Line plots through the myocardium, showing increasingly blurred blood-myocardium interfaces with conventional SAPPHIRE. Steep transitions are maintained using black-blood SAPPHIRE.
Phantom
The results of the B1+ uniformity using three MSDE preparation modules are displayed in Figure 4. The BIR4 adiabatic module results in the least signal loss with the most homogeneous signal profile. The hybrid Composite/BIREF1 module shows slightly increased signal loss with a signal drop towards the center of the phantom. This trend is strongly increased using the rectangular module. However, the relative SAR of the BIR4, Composite/BIREF1 and the rectangular module were 9.6, 5.2 and 1.0, respectively. The Composite/BIREF1 module was used for blood-suppression as a trade-off in the remainder of the study.
Figure 4.
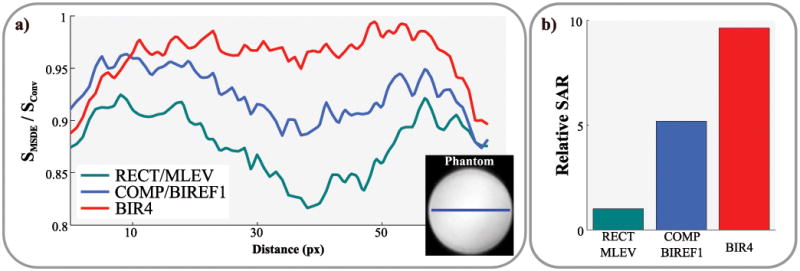
a) B1+ uniformity of three MSDE preparation modules, shown as line plots in a homogeneous phantom. b) Bar-plots showing the relative SAR burden of the three modules. The BIR4 module shows the most uniform signal with the least signal-loss for the cost of highest SAR values. The hybrid COMP/BIREF1 scheme shows a slight signal drop towards the center of the phantom. This trend is strongly increased using a fully rectangular preparation.
The Bland-Altman analysis of the phantom scans shows good agreement between the black-blood sequence and the conventional approach (see Supporting Figure S1): The average deviation was -3.9 ms (95% CI: -15.4 ms to 7.6 ms) for phantom vials with T1 times between 100 and 1800 ms.
In-vivo
Figure 5 shows the analysis of MSDE-prepared single-shot images acquired with various echo-times (TEMSDE). Residual blood signal is readily visible in the exemplary images if the echo-time is chosen too short (10 ms) causing decreased CNR. However, progressively strong signal void in the lateral area of the myocardium can be observed with increasing echo-times, due to increased motion during the preparation. This reflects as increased signal heterogeneity in the myocardium (COV), and causes a CNR drop for long echo times. TEMSDE = 11 ms shows substantially higher blood-myocardium contrast than shorter echo times and reduced signal heterogeneity compared to long TEMSDE. This echo-time value was fixed for the remainder of the study to offer a trade-off between blood suppression and signal void.
Figure 5.
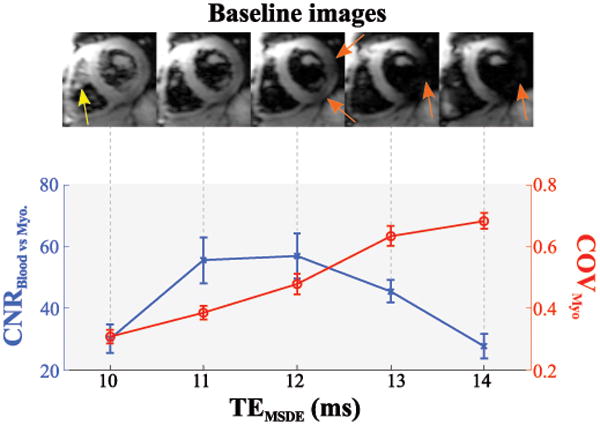
Black-blood contrast as a function of the MSDE preparation echo time. Exemplary baseline images (upper panel) show residual blood-signal for too short echo-times (yellow arrow), while long echo-times cause myocardial signal void (orange arrows). Accordingly, the contrast-to-noise ratio (CNR) between myocardium and blood-pool is compromised for long and very short echo-times. The coefficient of variation (COV) in the myocardium increases with longer echo-times, caused by progressive signal void.
T1 mapping was successfully performed in all healthy subjects, 2 out of 136 (1.5%) segments of the black-blood T1 maps were excluded from further analysis due to bSSFP artifacts. The imaging flip-angle was reduced by 2° in one healthy subject due to SAR limitations. Representative T1 maps acquired with conventional and black-blood SAPPHIRE are shown as myocardial-overlays together with the corresponding T1 weighted baseline images in Figure 6. Good T1 time homogeneity throughout the myocardium is observed with both techniques. Black-blood SAPPHIRE shows slightly increased variability by visual inspection. However, visually increased myocardial thickness is achieved with the black-blood sequence. The upper panel of Figure 6 shows the transmural analysis in a healthy subject and the corresponding T1 map. Increased T1 values are observed towards the blood-pools with the conventional approach. No such elevation was seen using black-blood SAPPHIRE. Figure 7 depicts all baseline images used for the T1 map generation and the corresponding signal intensities in the myocardium and the blood-pool, for the conventional and the black-blood sequence in one healthy subject. Black-blood SAPPHIRE shows comparable T1 recovery curves to the conventional sequence in the myocardium, although at decreased intensity. Accordingly the myocardial SNR in the baseline images of the conventional sequence was 76±42% higher than with black-blood SAPPHIRE. The high intensity blood-signal in the conventional T1 mapping sequence is successfully suppressed in the black-blood approach. However, the almost flat intensity curve in the blood-pools of the black-blood sequence, does not allow for extraction of the blood T1 time.
Figure 6.
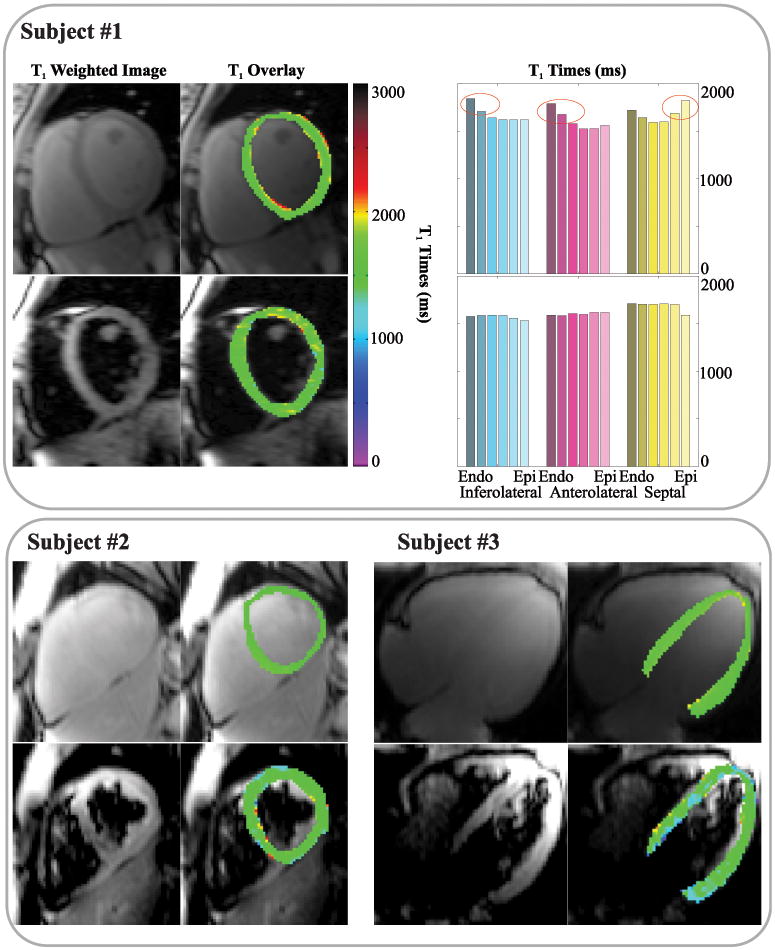
T1 weighted baseline images (left columns) and color-scaled myocardial T1 map overlays (right columns) in three healthy subjects, acquired in short-axis or four-chamber orientation. Good homogeneity of the T1 times is assessed with both techniques in all subjects. Slightly increased variability is visible in the black-blood approach. The analysis of the transmural T1 times in subject #1 is shown in the upper right. Conventional T1 mapping shows increased T1 times at the blood-myocardial interface. No such elevation is observed with the black-blood technique.
Figure 7.
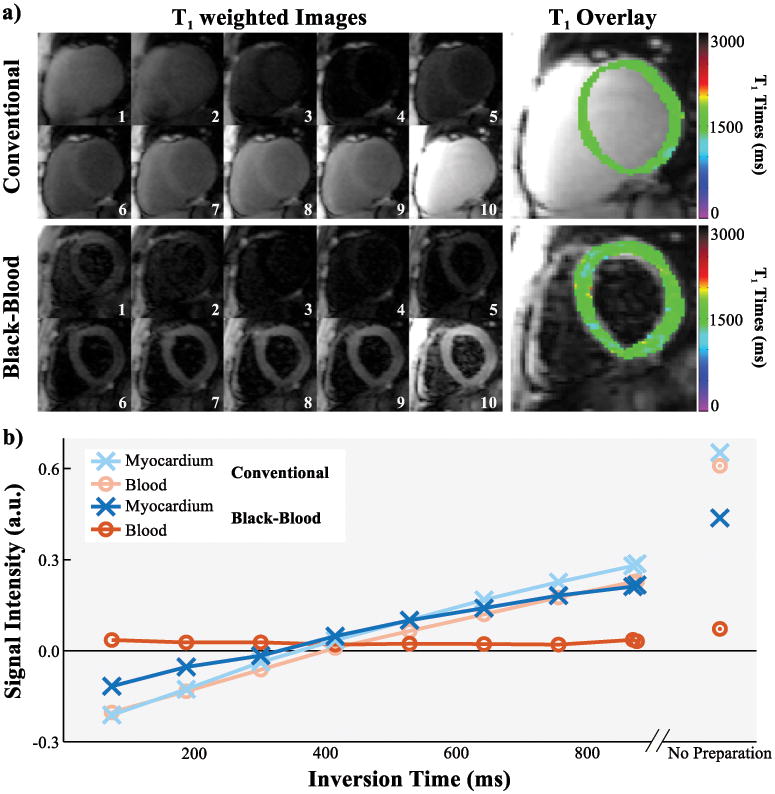
a) Series of T1 weighted baseline images with different inversion times and the corresponding T1 map overlay as acquired in the conventional and black-blood SAPPHIRE T1 mapping sequence in one healthy subject. b) Signal intensities of the septal myocardium and the left-ventricular blood-pool in the baseline images shown in a). T1 recovery curves are obtained in the myocardium with both sequences. The high blood-signal in the conventional T1 mapping sequence is successfully suppressed with the black-blood approach, leading to minor differences in the blood-signal across the inversion times.
No significant difference was found between the average T1 times of the conventional and the black-blood approach (1583±58 ms vs. 1562±56 ms, p=0.20), with slightly lower T1 time in the black-blood sequence, especially in the septal regions (Figure 8). However, precision, as assessed by intra-segmental T1 variation, is significantly increased using the black-blood approach (63.1±6.4 ms vs. 133.9±24.6 ms; p<0.0001). The myocardial thickness in SAPPHIRE black-blood T1 times was significantly increased by an average of 50±22% compared to conventional SAPPHIRE, as detailed in Table 1.
Figure 8.
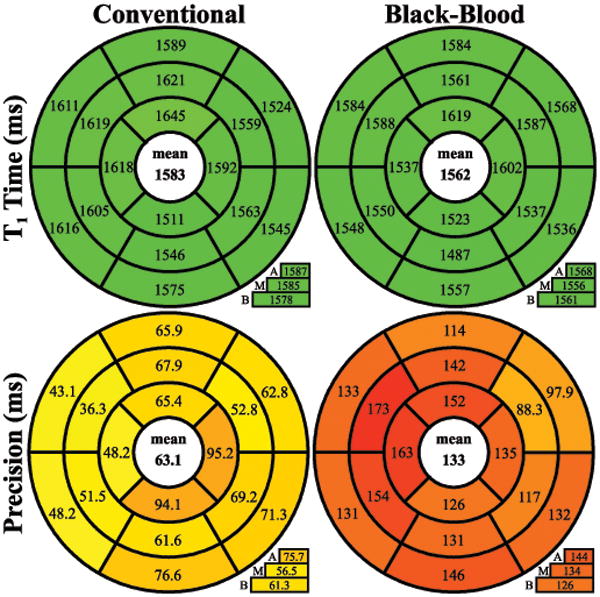
Bulls-eye representation of T1 times and precision in the 16 AHA segments across three slices (A=apical, M=midventricular, B=basal) acquired with conventional and black-blood SAPPHIRE. Similar T1 times are assessed with both approaches, while significantly better precision is observed with conventional SAPPHIRE.
Table 1.
Average myocardial ROI thickness for conventional and black-blood T1 mapping.
| Average myocardial ROI thickness (mm) | |||
|---|---|---|---|
| SHAX Slice | Conventional | Black-Blood | Difference* |
| Apical | 4.1±0.7 | 6.2±1.5 | 52%±24% |
| Mid | 4.7±1.1 | 7.3±1.5 | 61%±33% |
| Basal | 5.1±0.8 | 6.8±1.0 | 36%±22% |
| Average | 4.6±0.7 | 6.8±0.8 | 50%±22% |
p < 0.05 for all differences
Intra-observer consistency was characterized by an ICC of 0.939 (95% CI: [0.689, 0.989]) for the conventional sequence and an ICC of 0.979 (95% CI: [0.882, 0.996]) for the black-blood approach. This difference was not found to be significant (p = 0.11). Bland-Altman statistics showed slightly lower intra-observer variability for the SAPPHIRE black-blood (bias: 1.3 ms, 95% CI: [-24.6, 27.3 ms]) compared with the conventional sequence (bias: -2.5 ms, 95% CI: [-37.7, 32.6 ms]). However, neither the difference in the bias (p = 0.58), nor in the variability of the differences (p = 0.48), was found to be significant. Inter-observer consistency, on the other hand, was significantly lower using the conventional T1 mapping sequence compared to black-blood SAPPHIRE (mean, [95% CI]): Conventional 0.967, [0.822, 0.994] vs Black-Blood: 0.996, [0.976, 0.999], p = 0.011. Also, significantly lower bias was shown for the proposed sequence in the Bland-Altman analysis (mean, [95% CI]): Conventional -20.2 ms, [-46.5 ms, 6.0 ms] vs Black-Blood: 1.3 ms, [-9.8 ms, 12.5 ms], difference in bias: p=0.003, difference in variance: p=0.056.
The quantitative analysis of the partial-voluming, using erosion and dilation of the myocardial ROIs is shown in Figure 9. Septal T1 times assessed with conventional SAPPHIRE show a strongly increasing trend for dilated ROIs (R2=0.99) with significantly different T1 times at different ROI sizes (p=0.012). SAPPHIRE Black-blood shows good invariance to the ROI thickness over a wide-range with no increasing trend and no significant difference in the ANOVA (R2=0.29, p=0.997).
Figure 9.
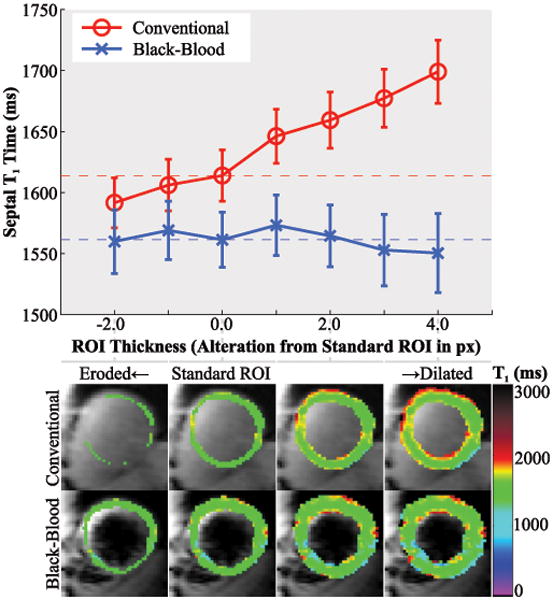
Analysis of the in-vivo partial-voluming effect with conventional and black-blood SAPPHIRE. The upper panel shows the septal T1 times, at various alterations of the standard, manually drawn ROI, obtained by progressive erosion/dilation. The lower panel shows the corresponding ROIs as color-scaled T1 map overlays. Strongly increased T1 times are observed at increased myocardial ROI thickness in the conventional technique, due to the progressive inclusion of blood in the ROI. No such trend is observed using the SAPPHIRE black-blood sequence.
Discussion
In this study a MSDE prepared SAPPHIRE sequence was proposed for blood-signal suppressed T1 mapping. Numerical simulations showed that black-blood T1 mapping benefits from decreased sensitivity to partial-voluming effects and increased apparent myocardial wall thickness. Phantom T1 times of black-blood SAPPHIRE were in good agreement with the conventional sequence. In-vivo T1 maps in healthy volunteers showed thorough blood-suppression with the chosen MSDE module and robust T1 quantification in myocardial ROIs with increased thickness for the trade-off against decreased precision. Black-blood T1 mapping successfully eliminated the T1 time dependence on the ROI thickness and increased inter-observer consistency, indicating the mitigation of partial-voluming effects and high resilience to ROI alterations.
A MSDE preparation was employed for blood-signal suppression in this study, as it can be well integrated in a T1 mapping sequence. Black-blood imaging using MSDE is already clinically well established for plaque assessment in the coronary arteries (23). Active research efforts have focused on the optimization of MSDE preparations for plaque imaging (24-26). However, previous studies have shown substantial differences in the demands on the MSDE preparation for effective blood-suppression in the left-ventricle compared to the coronary arteries (16,27). Substantial differences in the flow patterns, with more shearing and less ordered motion in the left ventricle, require reduced motion sensitizing gradient strength than for the coronary arteries: The optimal first order gradient moment (m1) was reported to be around ∼160 mT · ms2 / m for ventricular applications (16,27), and 800-1600 mT · ms2 / m for plaque imaging (25,28). Hence, to account for these differences and to ensure optimal blood-suppression that meets the requirements of quantitative imaging, a separate optimization of the MSDE preparation and the motion sensitizing gradient strength was performed. A hybrid adiabatic/composite preparation module was chosen as a trade-off between B1+ uniformity and SAR that enables thorough blood-suppression in the healthy volunteer cohort, suitable for quantitative imaging. The assessed optimal echo time (TEMSDE) leads to a first order gradient moment of m1 = 168 mT · ms2 / m, which is in agreement with previous reports (27).
To enable optimal blood-suppression with minimal signal-void in the myocardium, careful positioning of the preparation at a time-point with minimal contractile motion of the heart is necessary. Imaging was performed at late end-diastole in order to accommodate the MSDE preparation well within the end-diastolic quiescence. A fixed echo-time TEMSDE = 11 ms showed consistent T1 map quality in the healthy cohort. However, in patients with high heart-rates or arrhythmias, cardiac motion during the MSDE preparation might be unavoidable and potentially detrimental to the image quality in the proposed black-blood approach. Patient-specific adaption of the MSDE preparation should be performed in these cases to achieve optimal image quality. TEMSDE scouting has been previously proposed to enable efficient selection of the patient-specific optimal echo-time (26). Also, alternative blood-suppression schemes such as double-inversion recovery (29) or in-flow suppression (30), might be more suitable for patients with arrhythmia or tachycardia and warrant further inspection.
T1 maps are commonly evaluated using manually drawn ROIs. However, especially in pathologies with reduced myocardial wall thickness such as DCM or transmural scars, there are often only few voxels left within the myocardium that are not affected by partial-voluming (3). This bears the risk that elevated T1 times in this cohort merely reflect a change in the extent of partial-voluming. Black-blood T1 mapping might be a valuable tool to confirm actual changes in the underlying myocardial T1 in these pathologies, while eliminating the impairment by partial-voluming effects.
Heng et al. recently presented initial data on the use of a MSDE prepared fat-water separated T1 mapping sequence (14). The sequence was based on a SASHA saturation recovery design (31), during free-breathing. While thorough blood suppression enabled good depiction of the right ventricle, the T1 quantification with their pilot protocol was impaired by issues with robustness, reproducibility and T1 uniformity. The strong gradients in the MSDE preparation sensitize the magnetization even for small displacements. Hence, potential reasons for a lack of reproducibility in (14) include signal loss due to respiratory motion during free-breathing and sub-optimal placement of the MSDE preparation due to the long multi-echo imaging readout. In the present study, rapid imaging during a breath-hold mitigated these error sources and enabled reproducible T1 mapping in the left ventricle. However, depiction of the right ventricle is hindered by the lack of fat-signal suppression. Initial results for fat-suppressed T1 mapping has previously been proposed showing high image quality using spectrally selective saturation of the fat before the imaging pulses (32). A combination of fat- and blood-suppressed T1 mapping bears great promise for improved image quality and full elimination of partial-voluming caused by epicardial fat, and warrants further investigation.
Despite careful optimization of the MSDE module, a residual loss in precision was shown to be the major disadvantage of the proposed black-blood SAPPHIRE technique compared to the conventional T1 mapping. The loss in T1 mapping precision after the MSDE preparation can be attributed to multiple factors: 1) a consistent loss in SNR for all base-line images, 2) reduced resilience to imaging artifacts at lower SNR and 3) increased variability among the baseline images. Our results indicate that the loss of the imaging SNR in the baseline images, is the major source of increased variability. In addition to T2 decay during the MSDE preparation, pulse imperfections and residual bulk motion of the myocardium reduce the signal after the preparation. Diffusion-related signal loss during the MSDE preparation can be assumed to be of minor importance, due to very low b-Values in the preparation (< 1 s/mm2). Further loss in precision can be caused by increased susceptibility to imaging artifacts (e.g. fold-over) at lower SNR. Furthermore, additional variability among the baseline images can be induced in the proposed sequence due to differential patterns of residual motion in the myocardium.
The overall reproducibility in myocardial T1 mapping is paramount and affected by a number of factors, including the T1 mapping precision, the myocardial segment volume and the inter- and intra-observer variability. On the one hand, reduced precision was shown for the proposed black-blood T1 mapping technique compared with conventional SAPPHIRE. On the other hand, an increase in the readily evaluable myocardial area has been facilitated using blood-suppression, allowing for increased segmental sizes and potentially reducing the variability of segmental T1 times. Furthermore, the black-blood technique has shown high robustness towards variation of the ROI size. Correspondingly, our initial evaluation in a small cohort has indicated decreased inter-observer variability with black-blood SAPPHIRE compared with the conventional sequence. While these effects can be mitigated by observer training, this result is in line with a previous report on T2* mapping (33), showing differential ROI delineation against the blood pool is a disruptive factor to the inter-observer reproducibility. However, the differences in intra-observer variability were observed to be smaller and no statistical significance was obtained given the small sample size. Hence, the assessment of the net overall effect on the reproducibility, inter- and intra-observer variability between black-blood and conventional T1 mapping requires a larger cohort to substantiate the claims and allow for statistical significant findings. This is to be evaluated in a future study.
Residual blood signal, after the MSDE preparation was found to be insufficient for robust estimation of the blood T1 time. This prevented the estimation of the extracellular volume (ECV) with the proposed black-blood technique. As ECV estimation is the primary use of post-contrast T1 times, the evaluation in the present work was restricted to the native myocardium and no T1 times after contrast injection were assessed. Separate assessment of a single, not spatially-resolved blood T1 time of the blood-pool is potentially feasible with a rapid free-breathing technique (34). This will be evaluated as a supplement to the proposed technique in future studies in order to allow for black-blood ECV mapping.
This study and the proposed method have several limitations. Only a small number of healthy subjects were included in this proof of concept study, and no reproducibility or sensitivity towards pathological alternation in the T1 time was assessed. Furthermore, the analysis of inter- and intra-observer variability was based on the assessments of two independent readers only. Increased consistency can be expected for larger cohorts, due to learning effects on the readers, or if common training is provided.
Conclusion
This study showed the feasibility of black-blood T1 mapping at 3T. SAPPHIRE black-blood allows for accurate T1 time quantification of the native myocardium that is robust to ROI alterations and eliminates partial-voluming at the blood-pools, for the trade-off against increased precision.
Supplementary Material
Supporting Table S1: Summary of the three MSDE modules, with the employed RF pulses and corresponding timing.
Supporting Figure S1: Bland-Altman analysis of phantom T1 times assessed with conventional and black-blood SAPPHIRE. TEMSDE=11ms was used in the black-blood sequence. Good agreement with minimal average deviation is shown between the two sequences.
Acknowledgments
The authors would like to thank Dr. Peter Kellman for helpful discussions.
Footnotes
Competing interests: SW and MA are inventors of a pending U.S. and European patent entitled “Methods for scar imaging in patients with arrhythmia”, which described the SAPPHIRE imaging sequence. No other financial or non-financial competing interests exist for any author.
References
- 1.Taylor AJ, Salerno M, Dharmakumar R, Jerosch-Herold M. T1 Mapping: Basic Techniques and Clinical Applications. JACC Cardiovascular imaging. 2016;9(1):67–81. doi: 10.1016/j.jcmg.2015.11.005. [DOI] [PubMed] [Google Scholar]
- 2.Puntmann VO, Voigt T, Chen Z, Mayr M, Karim R, Rhode K, Pastor A, Carr-White G, Razavi R, Schaeffter T, Nagel E. Native T1 mapping in differentiation of normal myocardium from diffuse disease in hypertrophic and dilated cardiomyopathy. JACC Cardiovascular imaging. 2013;6(4):475–484. doi: 10.1016/j.jcmg.2012.08.019. [DOI] [PubMed] [Google Scholar]
- 3.Dass S, Suttie JJ, Piechnik SK, Ferreira VM, Holloway CJ, Banerjee R, Mahmod M, Cochlin L, Karamitsos TD, Robson MD, Watkins H, Neubauer S. Myocardial tissue characterization using magnetic resonance noncontrast t1 mapping in hypertrophic and dilated cardiomyopathy. Circ Cardiovasc Imaging. 2012;5(6):726–733. doi: 10.1161/CIRCIMAGING.112.976738. [DOI] [PubMed] [Google Scholar]
- 4.Higgins DM, Ridgway JP, Radjenovic A, Sivananthan UM, Smith MA. T1 measurement using a short acquisition period for quantitative cardiac applications. Med Phys. 2005;32(6):1738–1746. doi: 10.1118/1.1921668. [DOI] [PubMed] [Google Scholar]
- 5.Roujol S, Weingärtner S, Foppa M, Chow K, Kawaji K, Ngo LH, Kellman P, Manning WJ, Thompson RB, Nezafat R. Accuracy, precision, and reproducibility of four T1 mapping sequences: a head-to-head comparison of MOLLI, ShMOLLI, SASHA, and SAPPHIRE. Radiology. 2014;272(3):683–689. doi: 10.1148/radiol.14140296. [DOI] [PMC free article] [PubMed] [Google Scholar]
- 6.Kellman P, Hansen MS. T1-mapping in the heart: accuracy and precision. J Cardiovasc Magn Reson. 2014;16:2. doi: 10.1186/1532-429X-16-2. [DOI] [PMC free article] [PubMed] [Google Scholar]
- 7.Mehta BB, Chen X, Bilchick KC, Salerno M, Epstein FH. Accelerated and navigator-gated look-locker imaging for cardiac T1 estimation (ANGIE): Development and application to T1 mapping of the right ventricle. Magnetic resonance in medicine. 2015;73(1):150–160. doi: 10.1002/mrm.25100. [DOI] [PMC free article] [PubMed] [Google Scholar]
- 8.Weingartner S, Akcakaya M, Roujol S, Basha T, Stehning C, Kissinger KV, Goddu B, Berg S, Manning WJ, Nezafat R. Free-breathing post-contrast three-dimensional T1 mapping: Volumetric assessment of myocardial T1 values. Magnetic resonance in medicine. 2015;73(1):214–222. doi: 10.1002/mrm.25124. [DOI] [PMC free article] [PubMed] [Google Scholar]
- 9.Weingartner S, Akcakaya M, Roujol S, Basha T, Tschabrunn C, Berg S, Anter E, Nezafat R. Free-breathing combined three-dimensional phase sensitive late gadolinium enhancement and T1 mapping for myocardial tissue characterization. Magnetic resonance in medicine. 2015;74(4):1032–1041. doi: 10.1002/mrm.25495. [DOI] [PMC free article] [PubMed] [Google Scholar]
- 10.Ferreira VM, Wijesurendra RS, Liu A, Greiser A, Casadei B, Robson MD, Neubauer S, Piechnik SK. Systolic ShMOLLI myocardial T1-mapping for improved robustness to partial-volume effects and applications in tachyarrhythmias. J Cardiovasc Magn Reson. 2015;17(1):77. doi: 10.1186/s12968-015-0182-5. [DOI] [PMC free article] [PubMed] [Google Scholar]
- 11.Coolen BF, Geelen T, Paulis LE, Nauerth A, Nicolay K, Strijkers GJ. Three-dimensional T1 mapping of the mouse heart using variable flip angle steady-state MR imaging. NMR in biomedicine. 2011;24(2):154–162. doi: 10.1002/nbm.1566. [DOI] [PubMed] [Google Scholar]
- 12.Messner NM, Zöllner FG, Kalayciyan R, Schad LR. Pre-clinical functional Magnetic Resonance Imaging Part II: The heart. Z Med Phys. 2014;24(4):307–322. doi: 10.1016/j.zemedi.2014.06.008. [DOI] [PubMed] [Google Scholar]
- 13.Koktzoglou I, Li D. Diffusion-prepared segmented steady-state free precession: Application to 3D black-blood cardiovascular magnetic resonance of the thoracic aorta and carotid artery walls. J Cardiovasc Magn Reson. 2007;9(1):33–42. doi: 10.1080/10976640600843413. [DOI] [PubMed] [Google Scholar]
- 14.Heng EL, Kellman P, Gatzoulis MA, Moon J, Gatehouse P, Babu-Narayan SV. Pilot data of right ventricular myocardial T1 quantification by free-breathing fat-water separated dark blood saturation-recovery imaging. J Cardiovasc Magn Reson. 2015:1–2. [Google Scholar]
- 15.Weingärtner S, Akcakaya M, Basha T, Kissinger KV, Goddu B, Berg S, Manning WJ, Nezafat R. Combined saturation/inversion recovery sequences for improved evaluation of scar and diffuse fibrosis in patients with arrhythmia or heart rate variability. Magnetic resonance in medicine. 2014;71(3):1024–1034. doi: 10.1002/mrm.24761. [DOI] [PubMed] [Google Scholar]
- 16.Srinivasan S, Hu P, Kissinger KV, Goddu B, Goepfert L, Schmidt EJ, Kozerke S, Nezafat R. Free-breathing 3D whole-heart black-blood imaging with motion sensitized driven equilibrium. Journal of magnetic resonance imaging. 2012;36(2):379–386. doi: 10.1002/jmri.23662. [DOI] [PMC free article] [PubMed] [Google Scholar]
- 17.Lourakis MIA. levmar: Levenberg-Marquardt nonlinear least squares algorithms in C/C++ [Accessed June 1, 2013]; http://users.ics.forth.gr/∼lourakis/levmar/. Published 2004. Updated November 29, 2011.
- 18.Nezafat R, Ouwerkerk R, Derbyshire AJ, Stuber M, McVeigh ER. Spectrally selective B1-insensitive T2 magnetization preparation sequence. Magnetic resonance in medicine. 2009;61(6):1326–1335. doi: 10.1002/mrm.21742. [DOI] [PubMed] [Google Scholar]
- 19.Salerno M, Epstein FH, Kramer CM, inventors. Motion-attenuated contrast-enhanced cardiac magnetic resonance imaging and related method thereof. US Patent 12,696,433. 2009 Jan 29;
- 20.Winer BJ. Statistical principles in experimental design. New York: McGraw-Hill; 1971. [Google Scholar]
- 21.Shrout PE, Fleiss JL. Intraclass correlations: uses in assessing rater reliability. Psychological bulletin. 1979;86(2):420–428. doi: 10.1037//0033-2909.86.2.420. [DOI] [PubMed] [Google Scholar]
- 22.Bland JM, Altman DG. Statistical methods for assessing agreement between two methods of clinical measurement. Lancet. 1986;1(8476):307–310. [PubMed] [Google Scholar]
- 23.Kerwin WS, Canton G. Advanced techniques for MRI of atherosclerotic plaque. Topics in magnetic resonance imaging : TMRI. 2009;20(4):217–225. doi: 10.1097/RMR.0b013e3181ea2853. [DOI] [PMC free article] [PubMed] [Google Scholar]
- 24.Wang J, Yarnykh VL, Hatsukami T, Chu B, Balu N, Yuan C. Improved suppression of plaque-mimicking artifacts in black-blood carotid atherosclerosis imaging using a multislice motion-sensitized driven-equilibrium (MSDE) turbo spin-echo (TSE) sequence. Magnetic resonance in medicine. 2007;58(5):973–981. doi: 10.1002/mrm.21385. [DOI] [PubMed] [Google Scholar]
- 25.Wang J, Yarnykh VL, Yuan C. Enhanced image quality in black-blood MRI using the improved motion-sensitized driven-equilibrium (iMSDE) sequence. Journal of magnetic resonance imaging. 2010;31(5):1256–1263. doi: 10.1002/jmri.22149. [DOI] [PMC free article] [PubMed] [Google Scholar]
- 26.Fan Z, Zhou X, Bi X, Dharmakumar R, Carr JC, Li D. Determination of the optimal first-order gradient moment for flow-sensitive dephasing magnetization-prepared 3D noncontrast MR angiography. Magnetic resonance in medicine. 2011;65(4):964–972. doi: 10.1002/mrm.22847. [DOI] [PMC free article] [PubMed] [Google Scholar]
- 27.Nguyen TD, de Rochefort L, Spincemaille P, Cham MD, Weinsaft JW, Prince MR, Wang Y. Effective motion-sensitizing magnetization preparation for black blood magnetic resonance imaging of the heart. Journal of magnetic resonance imaging. 2008;28(5):1092–1100. doi: 10.1002/jmri.21568. [DOI] [PMC free article] [PubMed] [Google Scholar]
- 28.Balu N, Yarnykh VL, Chu B, Wang J, Hatsukami T, Yuan C. Carotid plaque assessment using fast 3D isotropic resolution black-blood MRI. Magnetic resonance in medicine. 2011;65(3):627–637. doi: 10.1002/mrm.22642. [DOI] [PMC free article] [PubMed] [Google Scholar]
- 29.Edelman RR, Chien D, Kim D. Fast selective black blood MR imaging. Radiology. 1991;181(3):655–660. doi: 10.1148/radiology.181.3.1947077. [DOI] [PubMed] [Google Scholar]
- 30.Felmlee JP, Ehman RL. Spatial presaturation: a method for suppressing flow artifacts and improving depiction of vascular anatomy in MR imaging. Radiology. 1987;164(2):559–564. doi: 10.1148/radiology.164.2.3602402. [DOI] [PubMed] [Google Scholar]
- 31.Chow K, Flewitt JA, Green JD, Pagano JJ, Friedrich MG, Thompson RB. Saturation recovery single-shot acquisition (SASHA) for myocardial T(1) mapping. Magnetic resonance in medicine. 2014;71(6):2082–2095. doi: 10.1002/mrm.24878. [DOI] [PubMed] [Google Scholar]
- 32.Peters DC, Thorn SL, Bregazi A, Hawley C, Stacy MR, Sinusas AJ. Towards high-resolution fat-suppressed T1-mapping of atrial fibrosis in the left atrium: a fit-free three-point method. Journal of Cardiovascular Magnetic Resonance. 2015;17(1):1–2. [Google Scholar]
- 33.He T, Gatehouse PD, Kirk P, Tanner MA, Smith GC, Keegan J, Mohiaddin RH, Pennell DJ, Firmin DN. Black-blood T2* technique for myocardial iron measurement in thalassemia. Journal of magnetic resonance imaging. 2007;25(6):1205–1209. doi: 10.1002/jmri.20929. [DOI] [PubMed] [Google Scholar]
- 34.Fitts M, Breton E, Kholmovski EG, Dosdall DJ, Vijayakumar S, Hong KP, Ranjan R, Marrouche NF, Axel L, Kim D. Arrhythmia insensitive rapid cardiac T1 mapping pulse sequence. Magnetic resonance in medicine. 2013;70(5):1274–1282. doi: 10.1002/mrm.24586. [DOI] [PubMed] [Google Scholar]
Associated Data
This section collects any data citations, data availability statements, or supplementary materials included in this article.
Supplementary Materials
Supporting Table S1: Summary of the three MSDE modules, with the employed RF pulses and corresponding timing.
Supporting Figure S1: Bland-Altman analysis of phantom T1 times assessed with conventional and black-blood SAPPHIRE. TEMSDE=11ms was used in the black-blood sequence. Good agreement with minimal average deviation is shown between the two sequences.