Abstract
We present the Simulation Enabled Estimation of Kinetic Rates (SEEKR) package, a suite of open-source scripts and tools designed to enable researchers to perform multi-scale computation of the kinetics of molecular binding, unbinding, and transport using a combination of molecular dynamics, Brownian dynamics, and milestoning theory. To demonstrate its utility, we compute the kon, koff, and ΔGbind for the protein trypsin with its noncovalent binder, benzamidine, and examine the kinetics and other results generated in the context of the new software, and compare our findings to previous studies performed on the same system. We compute a kon estimate of 2.1±0.3•107 M−1s−1, a koff estimate of 83±14 s−1, and a ΔGbind of −7.4±0.2 kcal•mol−1, all of which compare closely to the experimentally measured values of 2.9•107 M−1s−1, 600±300 s−1, and −6.7 kcal•mol−1, respectively.
Graphical abstract

Introduction
Elucidating the kinetics and thermodynamics of binding and unbinding processes between a biomolecule and a substrate remains an important challenge in the field of molecular biophysics. Countless processes within the cell involve the association of a biomolecule with a metabolite, signaling molecule, toxin, drug, or another biomolecule.1–2 Many of these interactions have important kinetic considerations: for instance, the speed of reactions or the residence time of an intermolecular encounter.2–3
Significant effort has been expended to accurately estimate the thermodynamics of binding using a variety of methods, particularly in the field of drug discovery, where the identification of a tight binder is an integral step towards obtaining a potential drug molecule that would accomplish a desired medical result.4–8 While the thermodynamics of binding, encapsulated in the quantity of the free energy ΔGbind of receptor-ligand complex formation, is an important factor in the binding process, a comprehensive understanding of the binding process requires consideration of binding kinetics and reaction rates.
Many theoretical approaches and simulation methods have been used to estimate both the thermodynamics and kinetics of binding. For instance, specialized machinery and long molecular dynamics (MD) simulations can be used in a ‘brute force’ approach, although it is relatively costly compared to other methods.9–12 Markov models13–19 can also be used to investigate the kinetics of binding,20–22 as can milestoning.7 Additional clever methodologies can be used to speed the computation using MD.6, 8, 23–25 Brownian dynamics (BD) can also be used to approach the problem of binding kinetics,5, 26–29 as can Smoluchowski equation solvers.30
Our past work31–33 has focused on using a multi-scale combination of MD and BD, unified through the theoretical framework of milestoning. In our previous study, we presented a hybrid MD/BD/milestoning methodology to conduct our investigations into the kinetics of binding between superoxide dismutase and its natural substrate, the superoxide anion, and between troponin C and its natural substrate, the calcium ion.31 Here, we make available a software package, SEEKR, that implements this method with significant improvements in automation, usability, and analysis. We demonstrate the utility of SEEKR by applying it to estimate the kon, the koff, and ΔGbind between the serine protease trypsin and its ligand, benzamidine. In addition to the SEEKR software to perform milestoning calculations on any receptor-ligand system, we also make available a user guide, tutorial, and workflow to allow users to repeat our simulations and analysis for the trypsin-benzamidine system, and compute kinetics and thermodynamics for additional receptor-ligand systems.
Theory
The rationale and methodology behind our usage of milestoning to estimate kinetics using both MD and BD has been described recently in detail31 for multiple applications. Our implementation to the trypsin-benzamidine receptor-ligand system in this study was adapted with few changes, the majority consisting of improvements in software efficiency.
In the case of bimolecular association, the kinetics of binding and unbinding can be represented respectively by two quantities, kon and koff, which are frequently depicted according to the following equation:
| Eq. 1 |
Which is shorthand for specifying that the values kon and koff function as parameters within the following differential equations:
| Eq. 2 |
| Eq. 3 |
| Eq. 4 |
Where [A], [B], and [AB] represent the concentrations of chemical species A, B, and their complex AB. The kon and koff relate to the dissociation constant KD, and by extension, a free energy of association ΔGbind:6
| Eq. 5 |
Where R is the gas constant, T is temperature, and K⊝ is a factor equal to one, in units of concentration.
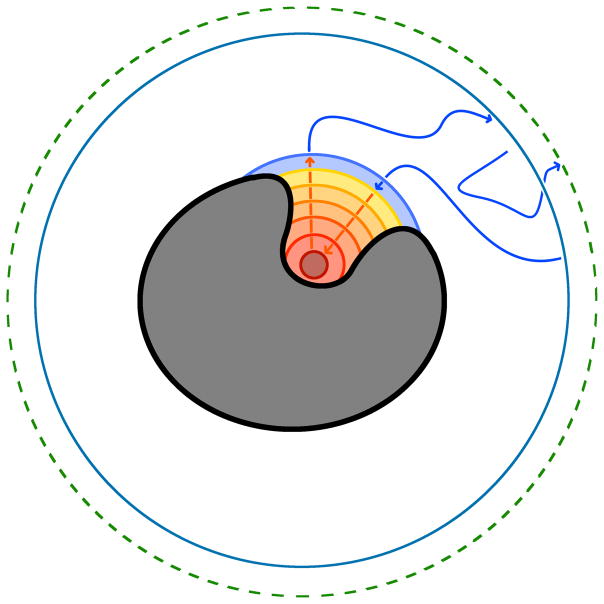
The theory of milestoning has been formulated to compute kinetic and thermodynamic details of a process if the states of that process are represented as carefully chosen surfaces in phase space. These surfaces are known as “milestones”.34 In this study, the milestones are represented as concentric spherical shells (figure 1) that encapsulate the binding site of the receptor. These spherical milestones are used for the computation of kon, koff, and ΔGbind. Milestoning theory allows us to approach the problem of kinetics by utilizing a multi-scale strategy. We use highly-detailed, but computationally expensive MD simulations to observe transitions between milestones closer to the binding site so that molecular flexibility will be a component of the transitions between milestones. We then use BD for the larger and more widely-spaced milestones far from the binding site, where fast sampling of long trajectories is required and rigid body dynamics and implicit solvent are adequate21, 28, 35 to model transition times and probabilities. In this way, we take advantage of fully flexible MD where molecular flexibility is required, and also take advantage of the computation efficiency of BD where molecular flexibility is less important. Milestoning is the theory that combines the MD and BD components, by allowing statistics to be obtained in each regime independently, and then unifying the statistics through a rigorous theory that is agnostic to the method that was used to obtain them. Since the statistics of each milestone are obtained independently from the others, and since milestoning theory is a robust framework that can utilize information obtained by either Brownian or Newtonian dynamics,36 we can choose whichever simulation method is most appropriate and convenient for that milestone.
Figure 1.
A cartoon schematic of trypsin (grey shape) with the concentric spherical milestones (orange and blue circular curves) surrounding the binding site. Also, the b- and q-surfaces are represented as the outer blue and dashed green curves, respectively, that sit away from the molecule. Blue arrows represent BD trajectories, and orange arrows represent MD trajectories. Any surface with a blue arrow coming from or going to it represents the starting or ending surface for BD trajectories, respectively. Similarly, a surface with an orange arrow coming from or going to it represents the starting or ending surface for MD simulations, respectively.
By sampling transition statistics and times between the milestones using numerous short simulations, one can construct a transition kernel K that represents the transition probabilities and an incubation time vector 〈t〉 that represents the average times of a system traversing the milestones.37–38
The transition kernel K is a square matrix whose elements are constructed according to the following formula:
| Eq. 6 |
Where ni → j is the number of trajectories that begin at a given milestone i and end at an adjacent milestone j. And the incubation time vector 〈t〉 has elements that are constructed according to the following formula:
| Eq. 7 |
Where tl is the time of the l’th successful forward trajectory starting at milestone i, and ni → k, as before, is the number of trajectories beginning at milestone i and ending at milestone k. Therefore, 〈t〉i represents the average time spent by the system after crossing i and before crossing any other milestone.
In order to compute a free energy profile along the milestones, we must first obtain the stationary flux vector qstat along the milestones by computing the principle eigenvector of K.
| Eq. 8 |
Then qstat must be multiplied elementwise by 〈t〉 to find the stationary probability vector pstat.
| Eq. 9 |
Finally, pstat,i relates to the relative free energy ΔGi at milestone i according to the following:
| Eq. 10 |
Where the index of pstat,ref is any reference state, such as the lowest energy, bound state. The value of pstat,ref is found by applying Eq. 9 to the chosen reference state.
To compute the kon, we utilize the formula that is also used in BD theory26:
| Eq. 11 |
Where k(b) is computed using the following formula:
| Eq. 12 |
The value k(b) represents the rate constant at which the ligand particles are crossing the b-surface, W(r) and D(r) are the potential of mean force and diffusion coefficient, respectively, that the ligand experiences at a distance r from the center of the receptor beyond the b-surface.26 D(r) is computed by generating a Rotne-Prager diffusion tensor to approximate the hydrodynamics of a two body interaction in a viscous medium.39 The value k(b) is computed automatically in BrownDye.
To find β, which represents the proportion of ligands crossing the b-surface that continue on to bind to the receptor, a starting probability vector q0 must be obtained in BD simulations by running a large number of conventional BD simulations where ligand molecules are started on a b-surface surrounding a receptor molecule. As the simulations run, and the proportion of trajectories that touch the outermost milestone(s) that encompasses a binding site on the biomolecule, rather than escaping to an infinite distance, are counted. In this case, q0 becomes:
| Eq. 13 |
Where i and j are the indices of one or more of these outermost site-encompassing milestones, q0,i, q0,j, are the probabilities that a BD trajectory started on the b-surface descend and touch these milestones, and q0,∞ is the probability that a trajectory diffuses away to an infinite distance. All the entries in q0 must be normalized such that their sum equals a value of one. An “infinity” state in both vector q0 and in matrix K, represents the condition in which the ligand has escaped to an infinite distance from the receptor.
Next the transition matrix K must be modified to a new matrix K̂ such that the milestones representing the bound and “infinity” states are sink states. That is, they all must have a probability of one that they transition only to themselves, and a zero probability to transition to anything else.
| Eq. 14a |
| Eq. 14b |
Once K̂ and q0 are properly defined, we compute the static flux vector21 q∞.
| Eq. 15 |
Finally, we obtain β:
| Eq. 16 |
Where i is the index of one of the bound states.
To compute the koff, we must return to the initial definition of matrix K as specified in Eq. 6. But it must be modified by introducing a “draining” state i by changing K into a draining matrix K̃ according to the following:
| Eq. 17 |
That is, once we have decided that i is the draining state, we set that entire column of the matrix K̃ to zeros, while all other columns are kept the same as they were in K. In the SEEKR implementation, the outermost non-infinite milestone is considered to be the draining state. Then, we compute a mean first passage time (MFPT) τ:
| Eq. 18 |
Where p0 is a starting distribution of probabilities along each milestone, and K̃T is the transpose of matrix K̃. We set p0,i to be 1 if i was a bound state, and set p0,i to be equal to 0 otherwise. The MFTP τ is equivalent to a residence time of the ligand within the binding site, and can be related to the koff according to the following relation:
| Eq. 19 |
Materials and Methods
Description of the SEEKR package
SEEKR is a collection of scripts and files designed to automate the preparation and analysis of ligand-receptor kinetic calculations that use a multi-scale MD/BD/milestoning framework.
SEEKR does not run the simulations themselves, but instead relies on the well-established NAMD40 and BrownDye41 programs. In this case, SEEKR is more of a specialist interface or tool that automates the cumbersome process of preparing, running, and analyzing a particular type of multi-scale milestoning calculation so that researchers will be able to run them more easily than if the process were done manually.
SEEKR programs are classified into three general categories:
Preparation: These scripts and modules accept input from the user in order to construct all the necessary files needed by both NAMD and BrownDye to run their respective simulations. The files are organized into a file tree whose branches represent the various independent milestones, which simulation method is being used (MD or BD), and the various stages of the calculations. When run, the user will have all the required files arranged and poised for simulation and milestoning calculations.
Running: Other scripts aid the user in running the MD and BD simulations locally and on supercomputers. For instance, SEEKR contains a script to prepare the submission of the computationally-intensive MD simulation jobs to a SLURM supercomputer queue, and when the allotted time runs out, the script prepares all the necessary resubmission files for one, some, or all of the milestones with a single command. Other scripts use previous BD trajectory output to prepare and run ensembles of BD simulations from first hitting point distributions (FHPD).
Analysis: When all the simulations are complete, the user can run an analysis script that descends into the file tree, gathering all the simulation output. It then combines this information to construct the milestoning model, and performs all the milestoning and error calculations, providing the user with kinetic and thermodynamic information, including kon, koff, and the free energy profile. It also has the option to perform convergence analysis on these values. Additional analysis scripts can be utilized to generate a single file containing the ligand equilibrium distribution or FHPD of each milestone for easy visualization.
The Python scripts have been tested using Python 2.7 and can be safely run in any version of Python 2 at version 2.7 or later. The remainder of the scripts are written in TCL, particularly those interfacing with NAMD, which has a TCL-based interface. SEEKR also uses the Numpy, Scipy, and MDAnalysis python libraries. The Adaptive Poisson-Boltzmann Solver (APBS)42 is used to generate the electrostatic potential maps for input to BrownDye, and the AmberTools program LEaP43 is also used to prepare structures for MD simulation.
Trypsin structure preparation and SEEKR creation of milestoning structures
Atomic coordinates of the trypsin-benzamidine system were obtained from the high resolution crystal structure Protein Databank (PDB) ID: 3PTB.44 Hydrogens were added using Molprobity with ring flips allowed.45–46 The system was then further prepared using LEaP with the Amber forcefield, ff14SB.47 Disulfide bonds were added manually. The appropriate protonation states of ASP, GLU, and HIS residues at a pH of 7.7 were determined using PROPKA.48–49 This pH was selected to align with the experimental conditions of Guillian and Thusius50. The structure was then solvated in a truncated octahedron of TIP4Pew51–52 waters and eight Cl− ions were added to neutralize the overall charge. The benzamidine ligand was parameterized using Antechamber with the GAFF force field.52–53 The total size of the system was approximately 23,000 atoms. To allow for relaxation from the crystallographic starting structure, the benzamidine ligand was removed and a 20 ns simulation of the apo structure was performed at a constant temperature of 298 K using the Langevin thermostat and a constant pressure of 1 atm using the Langevin piston with a damping coefficient of 5 ps−1. A representative structure from this simulation was then used as the SEEKR input structure to generate all the necessary inputs for the MD simulations to be run using NAMD, and the BD simulations using Browndye.
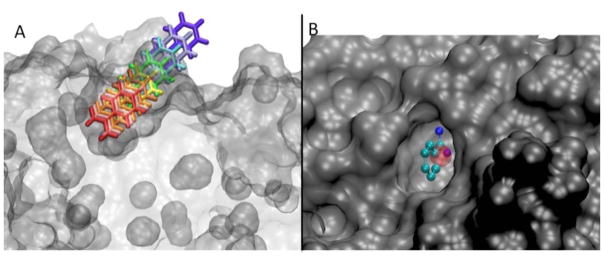
The benzamidine bound-state coordinates were defined from the center of mass of the alpha carbons of residues 190, 191, 192, 195, 213, 215, 216, 219, 220, 224, 228 of PDB: 3PTB because these residues form the binding pocket in the bound-state crystal structure by manual inspection. Spherical milestones were defined with radii of 1, 1.5, 2, 3, 4, 6, 8, 10, 12, 14 Å, with the origin being the bound state coordinates defined above. This spacing of the milestones was chosen to facilitate the simulation of transitions between milestones while still ensuring the Markov assumptions required by formal milestoning theory. Ten copies of the apo structure were generated, each with the benzamidine ligand inserted on one of the ten spherical milestones (figure 2A). Water molecules that clashed with the ligand structure were removed. The first nine milestones correspond to the MD simulation regime, with the innermost milestone (1 Å) representing the bound state, as the center of mass of the bound benzamidine ligand falls well within the 1 Å sphere that defines this milestone (figure 2B). Furthermore, in a ~170 ns unrestrained MD simulation with the ligand in the bound pose, the 1 Å sphere contained the center of mass of the ligand over 71% of the simulation. The tenth and outermost milestone (14 Å) corresponds to the BD simulation regime. The distribution along any milestone where BD was started was constructed by first running conventional BD simulations and obtaining the distribution of hitting points along that milestone.
Figure 2.
Panel A: before beginning the simulations, benzamidine has been placed along each of the milestones in gradually increasing distances from the center of the binding site on trypsin. Panel B: The center-of-mass of the benzamidine molecule in the trypsin 3PTB crystal structure lies within the lowest 1Å milestone (red sphere), which we define as the bound state
The b-surface is a relatively large spherical shell that encloses the entire receptor molecule, with a radius of sufficient size that the entire surface sits well out into the bulk solvent where forces between the ligand and receptor would be largely unaffected by molecular orientation, and are therefore centrosymmetric.
MD simulations
A modified version of NAMD 2.11 was used for all MD calculations. The numerous MD inputs, including input files, integrator parameters, boundary conditions, temperature and pressure controls, etc. are either defined by the user or set by SEEKR to default values. Relevant settings and procedures implemented for each milestone in the MD regime are described here.
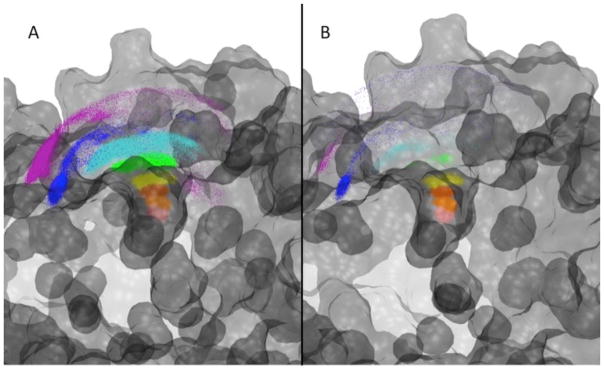
For each milestone system generated by SEEKR as described above, the solvent molecules were allowed to relax around the newly placed benzamidine ligand by minimizing for 5000 steps with both the ligand and receptor restrained. The solvent was then further relaxed through a series of 2 ps heating simulations, where the temperature was increased from 298 K to 350 K and then cooled back to 298 K in 10 K increments, keeping the atoms of the ligand and receptor restrained. Following this relaxation of the solvent, an equilibrium distribution of the ligand on the milestone surface was obtained from 1 μs of constant volume simulation at a temperature of 298 K where a harmonic spring force of 90 kcal•mol−1•Å−2 was imposed to restrain the ligand at the appropriate radius from the binding site center for each milestone to generate an equilibrium distribution (figure 3A). This is also known as the umbrella sampling stage. From this equilibrium distribution, a FHPD (figure 3B) was obtained by selecting 4700 position and velocity configurations from times 60 ns – 1 μs of the equilibrium trajectory and allowing them to propagate backwards in time by reversing their velocities at constant energy and volume (reverse stage). Any trajectories that struck another milestone before re-crossing the milestone from which they originated were counted as part of the FHPD. All members of the FHPD were then brought back to their original positions and velocities and subsequently allowed to propagate forward in time at constant energy and volume (forward stage). When a simulation crossed its starting milestone again, it was then monitored for transitions to adjacent milestones and the incubation time for these transitions was also recorded. Once a trajectory crossed an adjacent milestone, the simulation was terminated. Any trajectories in this forward stage that crossed adjacent milestones before re-crossing their starting milestone were rejected. The 1, 1.5, 2, 4, and 10 Å milestones produced results with significantly fewer transitions than the other milestones. Therefore, to improve the robustness of our statistics, we performed additional reverse and forward simulations where 10 more trajectories were initiated at random Maxwell-Boltzmann velocities from each equilibrium distribution point, in addition to the one described above (a total of 470,000 reversals for each of these milestones), increasing the number of transitions observed. For each milestone, successful forward stage statistics were inserted into the transition kernel K and incubation time vector 〈t〉.
Figure 3.
Panel A: The equilibrium distribution of the center of mass of benzamidine generated along all of the milestones from 2 Å (red) to 12 Å (green) at the end of the umbrella sampling. No umbrella sampling is performed for the BD stages, so there are no points representing the 14 Å milestone. Panel B: The FHPD of benzamidine centers of mass generated from the equilibrium distribution that succeeded in the reverse stage. The milestones between 1 Å (red) and 12 Å (green) were generated during the MD simulations. In addition, the blue distribution at 14 Å represents the FHPD obtained from the BD simulation. This FHPD is used to start forward stage trajectories for generating milestoning statistics.
BD simulations
All BD calculations were conducted with BrownDye, a software package specializing in the rigid-body diffusion of two biological molecules in an implicit solvent.41 The electric potential map used as input for the BD simulation was calculated with the APBS version 1.4. All BD inputs, as well as the necessary APBS inputs for creation of the electrostatics map, are user defined in the SEEKR input file or generated as SEEKR default values.
In an attempt to recreate the ionic conditions used in the experiment,50 a nonlinear APBS calculation was run at 298 K, with a solvent dielectric of 78 and a solute dielectric of 2, with the following ions: Ca2+ at a concentration of 0.02 mM with a charge of +2.0 e and a radius of 1.14 Å, Cl− at a concentration of 0.10 mM with a charge of −1.0 e and a radius of 1.67 Å, and tris at a concentration of 0.06 mM with a charge of +1.0 e and a radius of 4.0 Å.54 At the specified concentrations, these ions generate a Debye length of 8 Å, which is used as input to BrownDye. Both the b-surface BD simulations and BD trajectories starting from a milestone ran with a solvent dielectric 78 and a solute dielectric of 2, at 298 K. We ran three additional sets of BD simulations at different ionic concentrations to examine the effect of ionic strength in the BD simulations on the kon. Therefore, three additional simulations were run: one with an ion concentration of zero, another with half of the ion concentrations of the experimental procedure, and another with double the ion concentration of the experimental procedure. Although an electrolyte solution technically has a Debye length equal to infinity, we approximated the Debye length with a value of 99 Å in the BrownDye program.
For each kon calculation, we performed 106 BD simulations initiated at random points distributed on the b-surface, which were used to construct the vector q0 in Eq. 13. Once these simulations completed, the trajectories that successfully reached the outermost milestone were used as that milestone’s FHPD. From that FHPD, an additional 106 BD trajectories were run until reaching the second-outermost milestone or escaping to the q-surface. These statistics were also included in the transition kernel K and incubation time vector 〈t〉.
Milestoning calculations
Using the statistics obtained from all the milestones in both the MD and BD regimes, the SEEKR software was used to construct the milestoning model and compute the kon, koff, ΔGbind, and other quantities of interest. Additional scripts used to generate some of the figures and data are also included in the SEEKR package. Error estimates were computed according to our previously defined procedure31.
The vast majority of the procedure outlined in the Materials and Methods section is automated within the SEEKR software package.
Results
Using the MD/BD/milestoning methodology through the SEEKR interface yielded a kon of 2.1±0.3•107 M−1s−1 for the trypsin-benzamidine system. This value deviates from the experimentally measured kon for the same system at 2.9•107 M−1s−1 by a factor of ~1.5 (no experimental error margins were reported). We also estimate a koff of 83±14 s−1, which is within an order of magnitude of the experimentally determined value of 600±300 s−1 though our value is slower than expected. similar phenomenon is observed in other computational koff estimations of this system. An examination of the effect of ionic concentration on the kon convergence of the rate constants as a function of the length of umbrella sampling performed is provided in the SI. Using Eq. 5, we obtain a ΔGbind estimate of −7.3±0.2 kcal•mol−1 from a Kd of 4.3±1.2•10−6 M compared to the experimental ΔGbind of −6.71±0.05 kcal•mol−1, computed at 298 K using Eq. 5 and an experimental Kd of 1.2±0.1•10−5 M.50
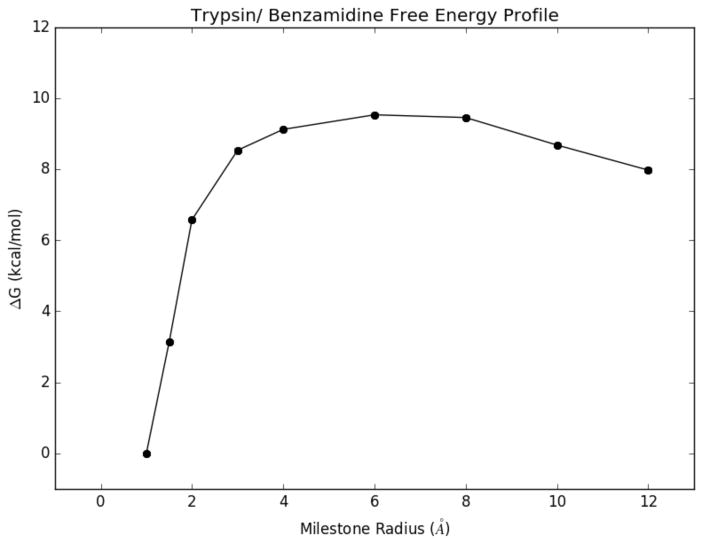
In addition, we obtained a relative free energy at each of the milestones along the binding pathway using the vector pstat in combination with Eq. 10. This free energy profile is displayed in figure 4.
Figure 4.
The free energy profile of benzamidine along each of the milestones leading to the binding site. The free energy barrier peaks around the milestone located at 6 Å.
Aside from the predicted thermodynamic and kinetic quantities, we used the trajectories generated during the SEEKR run to make other observations about the system during the binding and unbinding process.
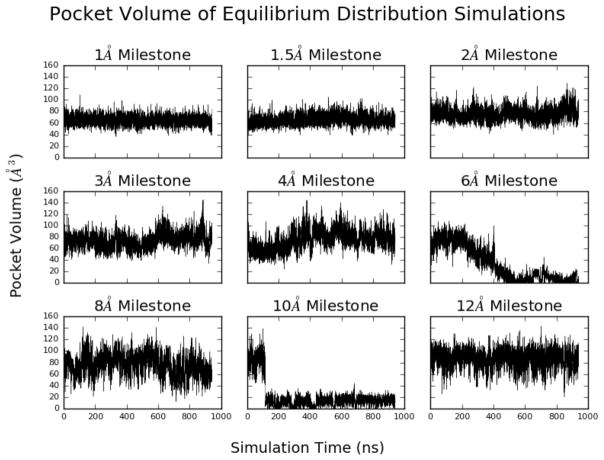
By removing the benzamidine molecule and the solvent, we used POVME255 to provide pocket volume measurement and characterization during the course of the MD runs. The same origin and radius of the inclusion region that defined the binding pocket were used for all umbrella sampling trajectories. The pocket itself remains relatively rigid when the benzamidine is deep in the binding site during the umbrella sampling stage, however, more variation in volume was observed when the benzamidine was constrained to a milestone nearer to the entrance of the opening of the binding site (figure 5).
Figure 5.
The volume of the S1 binding site with benzamidine restrained to the milestones as computed using the POVME2 program. Stabilization of the binding site pocket volume is observed as the ligand moves closer to the binding site.
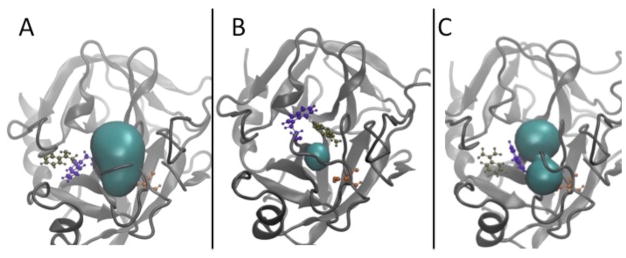
Closer analysis of the umbrella sampling trajectories for the 6, 10, and 12 Å milestones in conjunction with the POVME data indicates sampling of multiple conformations of the trypsin S1 binding pocket (figure 6A, 6B, and 6C). The binding pocket conformation is primarily dependent on the motion of two loops; the loop containing TRP215 and the loop containing ASP189, a critical residue for benzamidine recognition. The opening and closing of the S1 pocket is greatly influenced by the orientation of TRP215 When oriented downward as in figure 6A, the S1 pocket is open. This is the conformation observed in the crystal structure 3PTB with benzamidine bound. When TRP215 rotates upwards as in figure 6B, the binding pocket is closed, and pocket volume significantly decreases. The dramatic change in pocket volume for the 10 Å milestone also occurs when TRP215 moves to close the S1 binding site.
Figure 6.
Dynamics of the apo trypsin S1 binding pocket umbrella sampling simulations. Pocket conformations are significantly influenced by the motions of the loop containing TRP215 (violet) and the loop containing ASP189 (orange), which is important for benzamidine recognition. Benzamidine is shown in tan. POVME calculated volumes are shown in cyan. A) The open S1 pocket, where TRP215 is pointed in a downward orientation. B) Closed conformation of the S1 pocket as a result of TRP215 rotating to an upward pointing conformation. C) Formation of the S1* pocket where benzamidine can approach via an alternate pathway and interact with ASP189 from a different angle.
We also observe the formation of an S1* pocket, that results from the motion of these two loops (figure 6C). This pocket provides an alternate binding pathway, in which benzamidine can approach ASP189 from a different orientation. These observations are in agreement with the study of Plattner and Noé22 where these results were observed through several hundred independent MD trajectories totaling over 100 μs of aggregate simulation time.
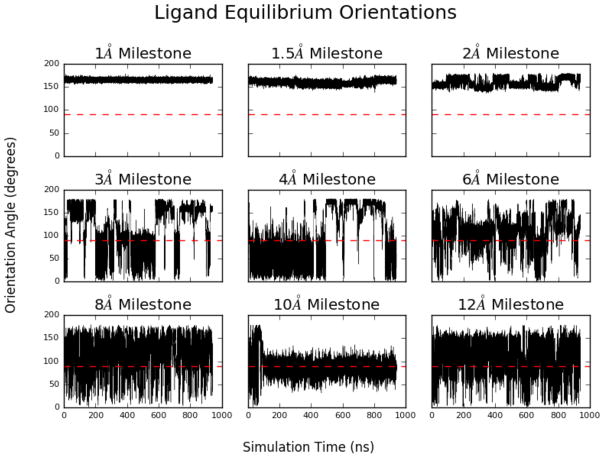
We also observed significant positional and rotational sampling by the benzamidine along most of the milestones during the umbrella sampling stages. This information can provide an idea for the likelihood of pathways that benzamidine follows on its route to binding. Figure 3A shows the equilibrium distribution along each of the milestones, and figure 3B shows the FHPD for each of the milestones. Figure 7 shows the angle between a vector pointing along the amidine group and a vector pointing out from the opening of the binding site as a function of time during the equilibrium simulations. Several flips are observed in all but the lowest milestones, where benzamidine rotation was restricted because these milestones are located deep within the binding pocket. The 10 Å also experiences a decrease in rotational sampling because benzamidine is interacting extensively with TRP215 and thus adopts an orientation that favors stacking of the aromatic rings.
Figure 7.
The angle of benzamidine along the center-of-mass/amidine axis compared to a vector pointing outward from the binding site. An angle larger than 90° represents a conformation where the amidine group is pointing toward the binding site. Several flips were observed in all milestones above 2 Å, implying that the orientation of the ligand is well sampled along all of the milestones except for those deepest in the binding pocket, where the orientation found in the crystal structure is preferred, and the amidine group is pointing down into the site.
The crystal structure of the trypsin/benzamidine complex shows the amidine group pointing downward toward the binding site (figure 2B). This structural feature is confirmed by our own simulations, and a relatively narrow arrangement of ligand orientations are observed along the lowest milestone.
The entire calculation cost approximately 1.4 million CPU hours on the Stampede supercomputer and local machines, with a total MD cost of approximately 19 μs of simulation.
Discussion
Compared to the experimental kon, our estimated kon is slower by about a factor of 1.3, but falls well within an order of magnitude. We attempted to closely recreate the experimental ionic conditions within our simulations, which has a pronounced effect on the kon (details in the SI). Our kon of 2.2±0.3•107 M−1s−1 is much closer to the experimental value of 2.9•107 M−1s−1 than the kons obtained by Buch et. al.20 (15±2•107 M−1s−1) and comparable to what was obtained by Plattner et. al.22 (6.4±1.6•107 M−1s−1), although ours was obtained with significantly less computational resources, smaller by an order of magnitude. Our result is also very close to what was obtained by Tiwary et. al.25 (1±1•107 M−1s−1). Our estimated koff of 83±14 s−1 is within an order of magnitude of the experimental koff, far closer than the value obtained by Buch et. al. (9.5±3.3•104s−1), and comparable to the values obtained by Plattner et. al. (131±109 s−1), Teo et. al.24 (260±240 s−1), and Tiwary et. al (9.1±2.5 s−1). To our knowledge, this is the first successful estimate of koff using a hybrid MD/BD/milestoning model.
An advantage of our approach is that both koff and kon can be determined from the same calculation. We can use our calculated koff and kon values in Eq. 5 to obtain an entirely computationally-determined dissociation constant KD of 3.8±0.8•10−6 M, and by extension a free energy of binding ΔGbind estimate of −7.4±0.2 kcal•mol−1. This is in good agreement with the experimental KD of 1.2•10−5 M, which when put through eq. 5 at a temperature of 298 K, yields a free energy of −6.7 kcal•mol−1.
The accurate determination of kinetics using milestoning requires the proper generation of equilibrium and FHPD distributions. It is important to ensure adequate sampling in the generation of equilibrium distributions. Figure 3A shows the equilibrium distribution of benzamidine center-of-mass along the 1 Å to 12 Å milestones in the MD regime. The benzamidine appears to have explored all solvent-accessible regions along the milestones. Along with positional sampling, the observed diversity of benzamidine orientation in figure 7 indicates that the ligand orientational degree of freedom is well-sampled in all but the lowest milestones. In addition to the ligand, it is important that receptor conformations that may affect ligand binding are also well sampled. By using POVME2, we observed conformational states that have been observed in other studies such as the S1* pocket (figure 6).22 We do not however observe any complete binding events via the S1* pocket, presumably as a result of our simplified spherical milestoning model. This may provide some explanation as to why our calculated rates are somewhat slower than experiment, as we do not capture this alternate pathway. However, we may reasonably assume that we are capturing most of the effects of slower receptor conformational changes and subsequently, that our kinetics predictions are reasonable.
While, of course, verification of SEEKR as a computational kinetics and thermodynamics estimator will need to be performed on additional systems, this similarity between experimental and theoretical free energies and rate constants in our accessible and highly parallel framework is encouraging.
Conclusions
In this work, we use our multi-scale MD/BD/milestoning methodology to examine ligand-protein binding events with a larger, more complex, and more drug-like ligand than in our previous work. Furthermore, we present the first successful koff calculation to within one order of magnitude of experiment using this approach. Using the obtained values of kon and koff, and entirely computational estimate of KD and ΔGbind in good agreement with experiment were obtained. These results are further evidence that the MD/BD/milestoning methodology can be successfully applied to the investigation of binding and unbinding kinetics in receptor-ligand systems. We also present the SEEKR software package, which automates much of the preparation, submission, and analysis of these types of calculations. We have made SEEKR freely available and open-source on Github, and hope that it will be used and improved by the community to run predictive multi-scale milestoning calculations. SEEKR downloads, tutorials, and the user guide may be found at http://amarolab.ucsd.edu/seekr.
Supplementary Material
Acknowledgments
We would like to thank Jim Philips, Wen Ma, Jamie Schiffer, Gary Huber, Robert Malmstrom, Rob Swift, J. Andrew McCammon, and Carlos Simmerling for their assistance to the SEEKR project. We dedicate this work to the memory of Klaus Schulten, a pioneer who inspired so many.
LWV acknowledges support from the National Science Foundation Graduate Research Fellowship Program (DGE-1144086). BRJ acknowledges support from the NIH Molecular Biophysics Training Program (T32-GM008326). REA acknowledges the NIH Directors New Innovator Award DP2 OD007237, the National Biomedical Computation Resource (NBCR) NIH P41 GM103426, and supercomputing resources provided by XSEDE (NSF TG-CHE060073).
REA is a co-founder of Actavalon, Inc.
References
- 1.Bar-Even A, Noor E, Savir Y, Liebermeister W, Davidi D, Tawfik DS, Milo R. The Moderately Efficient Enzyme: Evolutionary and Physicochemical Trends Shaping Enzyme Parameters. Biochemistry-Us. 2011;50(21):4402–4410. doi: 10.1021/bi2002289. [DOI] [PubMed] [Google Scholar]
- 2.Copeland RA, Pompliano DL, Meek TD. Drug-Target Residence Time and Its Implications for Lead Optimization (Vol 5, Pg 730, 2006) Nat Rev Drug Discov. 2007;6(3):249–249. doi: 10.1038/nrd2082. [DOI] [PubMed] [Google Scholar]
- 3.Copeland RA, Pompliano DL, Meek TD. Opinion - Drug-Target Residence Time and Its Implications for Lead Optimization. Nat Rev Drug Discov. 2006;5(9):730–739. doi: 10.1038/nrd2082. [DOI] [PubMed] [Google Scholar]
- 4.Jorgensen WL. Foundations of Biomolecular Modeling. Cell. 2013;155(6):1199–1202. doi: 10.1016/j.cell.2013.11.023. [DOI] [PMC free article] [PubMed] [Google Scholar]
- 5.Held M, Noe F. Calculating Kinetics and Pathways of Protein-Ligand Association. Eur J Cell Biol. 2012;91(4):357–364. doi: 10.1016/j.ejcb.2011.08.004. [DOI] [PubMed] [Google Scholar]
- 6.Swegat W, Schlitter J, Kruger P, Wollmer A. Md Simulation of Protein-Ligand Interaction: Formation and Dissociation of an Insulin-Phenol Complex. Biophys J. 2003;84(3):1493–1506. doi: 10.1016/S0006-3495(03)74962-5. [DOI] [PMC free article] [PubMed] [Google Scholar]
- 7.Yu TQ, Lapelosa M, Vanden-Eijnden E, Abrams CF. Full Kinetics of Co Entry, Internal Diffusion, and Exit in Myoglobin from Transition-Path Theory Simulations. J Am Chem Soc. 2015;137(8):3041–3050. doi: 10.1021/ja512484q. [DOI] [PMC free article] [PubMed] [Google Scholar]
- 8.Cavalli A, Spitaleri A, Saladino G, Gervasio FL. Investigating Drug-Target Association and Dissociation Mechanisms Using Metadynamics-Based Algorithms. Accounts Chem Res. 2015;48(2):277–285. doi: 10.1021/ar500356n. [DOI] [PubMed] [Google Scholar]
- 9.Dror RO, Pan AC, Arlow DH, Borhani DW, Maragakis P, Shan YB, Xu HF, Shaw DE. Pathway and Mechanism of Drug Binding to G-Protein-Coupled Receptors. P Natl Acad Sci USA. 2011;108(32):13118–13123. doi: 10.1073/pnas.1104614108. [DOI] [PMC free article] [PubMed] [Google Scholar]
- 10.Shan YB, Eastwood MP, Zhang XW, Kim ET, Arkhipov A, Dror RO, Jumper J, Kuriyan J, Shaw DE. Oncogenic Mutations Counteract Intrinsic Disorder in the Egfr Kinase and Promote Receptor Dimerization. Cell. 2012;149(4):860–870. doi: 10.1016/j.cell.2012.02.063. [DOI] [PubMed] [Google Scholar]
- 11.Shan YB, Kim ET, Eastwood MP, Dror RO, Seeliger MA, Shaw DE. How Does a Drug Molecule Find Its Target Binding Site? J Am Chem Soc. 2011;133(24):9181–9183. doi: 10.1021/ja202726y. [DOI] [PMC free article] [PubMed] [Google Scholar]
- 12.Pan AC, Borhani DW, Dror RO, Shaw DE. Molecular Determinants of Drug-Receptor Binding Kinetics. Drug Discov Today. 2013;18(13–14):667–673. doi: 10.1016/j.drudis.2013.02.007. [DOI] [PubMed] [Google Scholar]
- 13.Chodera JD, Noe F. Probability Distributions of Molecular Observables Computed from Markov Models. Ii. Uncertainties in Observables and Their Time-Evolution. J Chem Phys. 2010;133(10) doi: 10.1063/1.3463406. [DOI] [PubMed] [Google Scholar]
- 14.Noe F. Probability Distributions of Molecular Observables Computed from Markov Models. J Chem Phys. 2008;128(24) doi: 10.1063/1.2916718. [DOI] [PubMed] [Google Scholar]
- 15.Prinz JH, Wu H, Sarich M, Keller B, Senne M, Held M, Chodera JD, Schutte C, Noe F. Markov Models of Molecular Kinetics: Generation and Validation. J Chem Phys. 2011;134(17) doi: 10.1063/1.3565032. [DOI] [PubMed] [Google Scholar]
- 16.Sarich M, Noe F, Schutte C. On the Approximation Quality of Markov State Models. Multiscale Model Sim. 2010;8(4):1154–1177. [Google Scholar]
- 17.Pande VS, Beauchamp K, Bowman GR. Everything You Wanted to Know About Markov State Models but Were Afraid to Ask. Methods. 2010;52(1):99–105. doi: 10.1016/j.ymeth.2010.06.002. [DOI] [PMC free article] [PubMed] [Google Scholar]
- 18.Lane TJ, Bowman GR, Beauchamp K, Voelz VA, Pande VS. Markov State Model Reveals Folding and Functional Dynamics in Ultra-Long Md Trajectories. J Am Chem Soc. 2011;133(45):18413–18419. doi: 10.1021/ja207470h. [DOI] [PMC free article] [PubMed] [Google Scholar]
- 19.Schutte C, Noe F, Lu J, Sarich M, Vanden-Eijnden E. Markov State Models Based on Milestoning. J Chem Phys. 2011;134(20):204105. doi: 10.1063/1.3590108. [DOI] [PubMed] [Google Scholar]
- 20.Buch I, Giorgino T, De Fabritiis G. Complete Reconstruction of an Enzyme-Inhibitor Binding Process by Molecular Dynamics Simulations. P Natl Acad Sci USA. 2011;108(25):10184–10189. doi: 10.1073/pnas.1103547108. [DOI] [PMC free article] [PubMed] [Google Scholar]
- 21.Luty BA, Elamrani S, Mccammon JA. Simulation of the Bimolecular Reaction between Superoxide and Superoxide-Dismutase - Synthesis of the Encounter and Reaction Steps. J Am Chem Soc. 1993;115(25):11874–11877. [Google Scholar]
- 22.Plattner N, Noe F. Protein Conformational Plasticity and Complex Ligand-Binding Kinetics Explored by Atomistic Simulations and Markov Models. Nat Commun. 2015:6. doi: 10.1038/ncomms8653. [DOI] [PMC free article] [PubMed] [Google Scholar]
- 23.Pan AC, Sezer D, Roux B. Finding Transition Pathways Using the String Method with Swarms of Trajectories. J Phys Chem B. 2008;112(11):3432–3440. doi: 10.1021/jp0777059. [DOI] [PMC free article] [PubMed] [Google Scholar]
- 24.Teo I, Mayne CG, Schulten K, Lelievre T. Adaptive Multilevel Splitting Method for Molecular Dynamics Calculation of Benzamidine-Trypsin Dissociation Time. J Chem Theory Comput. 2016;12(6):2983–2989. doi: 10.1021/acs.jctc.6b00277. [DOI] [PMC free article] [PubMed] [Google Scholar]
- 25.Tiwary P, Limongelli V, Salvalaglio M, Parrinello M. Kinetics of Protein-Ligand Unbinding: Predicting Pathways, Rates, and Rate-Limiting Steps. P Natl Acad Sci USA. 2015;112(5):E386–E391. doi: 10.1073/pnas.1424461112. [DOI] [PMC free article] [PubMed] [Google Scholar]
- 26.Northrup SH, Allison SA, Mccammon JA. Brownian Dynamics Simulation of Diffusion-Influenced Bimolecular Reactions. J Chem Phys. 1984;80(4):1517–1526. [Google Scholar]
- 27.Zhou HX. On the Calculation of Diffusive Reaction-Rates Using Brownian Dynamics Simulations. J Chem Phys. 1990;92(5):3092–3095. [Google Scholar]
- 28.Mccammon JA, Northrup SH, Allison SA. Diffusional Dynamics of Ligand Receptor Association. J Phys Chem-Us. 1986;90(17):3901–3905. [Google Scholar]
- 29.Lindert S, Kekenes-Huskey PM, McCammon JA. Long-Timescale Molecular Dynamics Simulations Elucidate the Dynamics and Kinetics of Exposure of the Hydrophobic Patch in Troponin C. Biophys J. 2012;103(8):1784–1789. doi: 10.1016/j.bpj.2012.08.058. [DOI] [PMC free article] [PubMed] [Google Scholar]
- 30.Cheng YH, Suen JK, Zhang DQ, Bond SD, Zhang YJ, Song YH, Baker NA, Bajaj CL, Holst MJ, McCammon JA. Finite Element Analysis of the Time-Dependent Smoluchowski Equation for Acetylcholinesterase Reaction Rate Calculations. Biophys J. 2007;92(10):3397–3406. doi: 10.1529/biophysj.106.102533. [DOI] [PMC free article] [PubMed] [Google Scholar]
- 31.Votapka LW, Amaro RE. Multiscale Estimation of Binding Kinetics Using Brownian Dynamics, Molecular Dynamics and Milestoning. Plos Comput Biol. 2015;11(10) doi: 10.1371/journal.pcbi.1004381. [DOI] [PMC free article] [PubMed] [Google Scholar]
- 32.Boras BW, Hirakis S, Votapka L, Malmstrom RD, Amaro RE, McCulloch AD. Bridging Scales through Multiscale Modeling: A Case Study on Protein Kinase A. Front Physiol. 2015:6. doi: 10.3389/fphys.2015.00250. [DOI] [PMC free article] [PubMed] [Google Scholar]
- 33.Votapka LW. Numerical and Computational Solutions for Biochemical Kinetics, Druggability, and Simulation. 2016 [Google Scholar]
- 34.Kirmizialtin S, Elber R. Revisiting and Computing Reaction Coordinates with Directional Milestoning. J Phys Chem A. 2011;115(23):6137–48. doi: 10.1021/jp111093c. [DOI] [PMC free article] [PubMed] [Google Scholar]
- 35.Ermak DL, Mccammon JA. Brownian Dynamics with Hydrodynamic Interactions. J Chem Phys. 1978;69(4):1352–1360. [Google Scholar]
- 36.Faradjian AK, Elber R. Computing Time Scales from Reaction Coordinates by Milestoning. J Chem Phys. 2004;120(23):10880–9. doi: 10.1063/1.1738640. [DOI] [PubMed] [Google Scholar]
- 37.Vanden-Eijnden E, Venturoli M, Ciccotti G, Elber R. On the Assumptions Underlying Milestoning. J Chem Phys. 2008;129(17) doi: 10.1063/1.2996509. [DOI] [PMC free article] [PubMed] [Google Scholar]
- 38.Votapka LW, Lee CT, Amaro RE. Two Relations to Estimate Membrane Permeability Using Milestoning. J Phys Chem B. 2016;120(33):8606–8616. doi: 10.1021/acs.jpcb.6b02814. [DOI] [PMC free article] [PubMed] [Google Scholar]
- 39.Skolnick J. Perspective: On the Importance of Hydrodynamic Interactions in the Subcellular Dynamics of Macromolecules. J Chem Phys. 2016;145(10) doi: 10.1063/1.4962258. [DOI] [PMC free article] [PubMed] [Google Scholar]
- 40.Phillips JC, Braun R, Wang W, Gumbart J, Tajkhorshid E, Villa E, Chipot C, Skeel RD, Kale L, Schulten K. Scalable Molecular Dynamics with Namd. J Comput Chem. 2005;26(16):1781–1802. doi: 10.1002/jcc.20289. [DOI] [PMC free article] [PubMed] [Google Scholar]
- 41.Huber GA, McCammon JA. Browndye: A Software Package for Brownian Dynamics. Comput Phys Commun. 2010;181(11):1896–1905. doi: 10.1016/j.cpc.2010.07.022. [DOI] [PMC free article] [PubMed] [Google Scholar]
- 42.Baker NA, Sept D, Joseph S, Holst MJ, McCammon JA. Electrostatics of Nanosystems: Application to Microtubules and the Ribosome. P Natl Acad Sci USA. 2001;98(18):10037–10041. doi: 10.1073/pnas.181342398. [DOI] [PMC free article] [PubMed] [Google Scholar]
- 43.Pearlman DA, Case DA, Caldwell JW, Ross WS, Cheatham TE, Debolt S, Ferguson D, Seibel G, Kollman P. Amber, a Package of Computer-Programs for Applying Molecular Mechanics, Normal-Mode Analysis, Molecular-Dynamics and Free-Energy Calculations to Simulate the Structural and Energetic Properties of Molecules. Comput Phys Commun. 1995;91(1–3):1–41. [Google Scholar]
- 44.Marquart M, Walter J, Deisenhofer J, Bode W, Huber R. The Geometry of the Reactive Site and of the Peptide Groups in Trypsin, Trypsinogen and Its Complexes with Inhibitors. Acta Crystallogr B. 1983;39(Aug):480–490. [Google Scholar]
- 45.Davis IW, Leaver-Fay A, Chen VB, Block JN, Kapral GJ, Wang X, Murray LW, Arendall WB, Snoeyink J, Richardson JS, Richardson DC. Molprobity: All-Atom Contacts and Structure Validation for Proteins and Nucleic Acids. Nucleic Acids Res. 2007;35:W375–W383. doi: 10.1093/nar/gkm216. [DOI] [PMC free article] [PubMed] [Google Scholar]
- 46.Chen VB, Arendall WB, Headd JJ, Keedy DA, Immormino RM, Kapral GJ, Murray LW, Richardson JS, Richardson DC. Molprobity: All-Atom Structure Validation for Macromolecular Crystallography. Acta Crystallogr D. 2010;66:12–21. doi: 10.1107/S0907444909042073. [DOI] [PMC free article] [PubMed] [Google Scholar]
- 47.Maier JA, Martinez C, Kasavajhala K, Wickstrom L, Hauser KE, Simmerling C. Ff14sb: Improving the Accuracy of Protein Side Chain and Backbone Parameters from Ff99sb. J Chem Theory Comput. 2015;11(8):3696–3713. doi: 10.1021/acs.jctc.5b00255. [DOI] [PMC free article] [PubMed] [Google Scholar]
- 48.Dolinsky TJ, Nielsen JE, McCammon JA, Baker NA. Pdb2pqr: An Automated Pipeline for the Setup of Poisson-Boltzmann Electrostatics Calculations. Nucleic Acids Res. 2004;32:W665–W667. doi: 10.1093/nar/gkh381. [DOI] [PMC free article] [PubMed] [Google Scholar]
- 49.Dolinsky TJ, Czodrowski P, Li H, Nielsen JE, Jensen JH, Klebe G, Baker NA. Pdb2pqr: Expanding and Upgrading Automated Preparation of Biomolecular Structures for Molecular Simulations. Nucleic Acids Res. 2007;35:W522–W525. doi: 10.1093/nar/gkm276. [DOI] [PMC free article] [PubMed] [Google Scholar]
- 50.Guillain FTD. The Use of Proflavin as an Indicator in Temperature-Jump Studies of the Binding of a Competitive Inhibitor to Trypsin. J Am Chem Soc. 1970;92(18):5534–5536. doi: 10.1021/ja00721a051. [DOI] [PubMed] [Google Scholar]
- 51.Horn HW, Swope WC, Pitera JW, Madura JD, Dick TJ, Hura GL, Head-Gordon T. Development of an Improved Four-Site Water Model for Biomolecular Simulations: Tip4p-Ew. J Chem Phys. 2004;120(20):9665–9678. doi: 10.1063/1.1683075. [DOI] [PubMed] [Google Scholar]
- 52.Wang JM, Wolf RM, Caldwell JW, Kollman PA, Case DA. Development and Testing of a General Amber Force Field. J Comput Chem. 2004;25(9):1157–1174. doi: 10.1002/jcc.20035. [DOI] [PubMed] [Google Scholar]
- 53.Wang JM, Wang W, Kollman PA, Case DA. Automatic Atom Type and Bond Type Perception in Molecular Mechanical Calculations. J Mol Graph Model. 2006;25(2):247–260. doi: 10.1016/j.jmgm.2005.12.005. [DOI] [PubMed] [Google Scholar]
- 54.Schindler P, Robinson RA, Bates RG. Solubility of Tris(Hydroxymethyl)Aminomethane in Water-Methanol Solvent Mixtures and Medium Effects in Dissociation of Protonated Base. J Res Nbs a Phys Ch. 1968;A 72(2):141-+. doi: 10.6028/jres.072A.014. [DOI] [PMC free article] [PubMed] [Google Scholar]
- 55.Durrant JD, Votapka L, Sorensen J, Amaro RE. Povme 2.0: An Enhanced Tool for Determining Pocket Shape and Volume Characteristics. J Chem Theory Comput. 2014;10(11):5047–5056. doi: 10.1021/ct500381c. [DOI] [PMC free article] [PubMed] [Google Scholar]
Associated Data
This section collects any data citations, data availability statements, or supplementary materials included in this article.


