

Abstract
Background
The potential harm from exposure to nonessential metals, particularly mercury (Hg) and lead (Pb), has been the focus of research for years. Initial interest focused on relatively high exposures; however, recent evidence suggests that even high normal exposures might have adverse consequences for child development. Identifying the extent of these consequences is now a priority.
Methods
We assessed blood Pb and Hg levels in a biracial sample of 9–11 year-old children (N = 203). Neurodevelopment and psychological functioning assessments included hostility, disruptive behaviors, emotion regulation, and autism spectrum disorder behaviors. Parasympathetic (vagal) responses to acute stress were indexed by heart rate variability (HRV) at rest and during stress.
Results
With increasing Pb levels, children exhibit higher levels of hostile distrust and oppositional defiant behaviors, were more dissatisfied and uncertain about their emotions, and had difficulties with communication. These significant associations were found within a range of blood Pb levels from 0.19 to 3.25 μg/dL, well below the “reference value” for children of >5 μg/dL. Vagal reactivity interacted with Hg such that increasing Hg was associated with increasing autism spectrum behaviors for those children with sustained vagal tone during acute stress.
Conclusions
This study is the first to demonstrate an association between very low-level Pb exposure and fundamental psychological mechanisms that might explain prior associations with more complex outcomes such as delinquency. Analyses of vagal reactivity yielded entirely novel associations suggesting that Hg may increase autism spectrum behaviors in children with sustained vagal tone during acute stress. The novelty of these later findings requires additional research for confirmation and the cross-sectional nature of the data caution against assumptions of causality without further research.
Keywords: Lead (Pb), Mercury (Hg), Development/Behavioral Issues, Children
The adverse effects of elevated blood lead (Pb) on children’s development have been studied extensively in the domain of cognitive functioning (1), even at concentrations below those deemed to be elevated (>5 μg/dL) by the Centers for Disease Control and Prevention (CDC) in 2012 (2). Effects of Pb exposure also have been examined for behaviors such as delinquency (3); however, much of this work has focused on children with identified exposure routes (e.g., proximity to a battery factory) and thereby higher Pb levels (4). In contrast, high normal metal exposures would likely occur through less clear routes and as a result of relatively minor differences in diet (5, 6), dust exposure (7), and ambient air pollution (8). More needs to be learned about possible consequences of high normal Pb exposure. Exposure at these low levels is of particular importance to public health, as high normal exposures would affect a much larger proportion of children.
One pair of neurodevelopmental disorders that have been evaluated, and happen to have some overlap of symptoms, are Attention Deficit and Hyperactivity Disorder (ADHD) and Autism Spectrum Disorder (ASD). A study of 4,704 children in the National Health and Nutrition Examination Survey 1999–2002 (9) revealed that higher blood Pb levels are associated with a significantly higher risk of ADHD. Notably, this association was found in children with relatively low levels of blood Pb (nearly 80% of this population had blood Pb levels <2 μg/dL). ASD has been less consistently associated with Pb or other non-essential metal exposures. Most studies have considered metal levels in blood, hair, and urine for those with diagnosed ASD compared to controls. This research has yielded inconsistent results with respect to Pb and Hg, with most studies finding non-significant differences (10, 11) or even a reduced level of some non-essential metals (Pb) in those with ASD (12).
The other category of neurodevelopmental impairments that has been studied includes disruptive behaviors and found associations with delinquency (3) and disruptive classroom behavior (13). Despite these findings, very little attention has been given to the possible underlying psychological mechanisms that may contribute to the observed associations. For example, little is known about how Pb exposure may undermine children’s ability to regulate their emotions and develop supportive social relationships. One of the few studies investigating Pb and emotion regulation abilities (14) did find that higher Pb was associated with poor emotion regulation in very young children; however, the children in the study had relatively high levels of Pb exposure (comparing exposed, with levels >10 μg/dL to less exposed, with levels <10 μg/dL).
It seems likely that higher blood Pb levels adversely affect core mechanisms of psychological and social functioning, and that such outcomes can be manifested to varying degrees in clinical diagnoses. The present study considers behavioral correlates of relatively low-levels of blood Pb and blood Hg in a biracial sample of 9–11 year old children who together with their parents completed a battery of neuropsychological assessments. These assessments were designed to advance understanding beyond diagnostic dichotomies by measuring underlying functional process dimensions. Based on prior research, we hypothesized that these low-level Pb exposures would be positively associated with evidence of impairments in psychological, social, and physiological regulatory mechanisms.
The role of postnatal Hg exposure in neurodevelopment has been studied as well; but the evidence thus far does not support firm conclusions. ADHD has not shown significant associations with postnatal Hg exposure (15); however, there may be an association with ASDs (16, 17). One explanation for the divergent findings may be that differences in the strength or presence of associations between Hg and neurodevelopmental disorders result from a combination of Hg exposure and underlying genetic/biological susceptibility (16). One such neurobiological system that might affect the risk linked to Hg exposure is parasympathetic (vagal) regulation (18). Recent research has demonstrated how environmental factors might have differential impact as a function of underlying individual differences in vagal responses to acute stress (19).
Therefore, in the present study we considered the role of parasympathetic (vagal) responses to acute stress in the associations between low-level metal exposures and neuropsychological outcomes. The focus on the parasympathetic system has been a result of efforts to integrate mechanisms of physiological control (18) with psychological/behavioral regulation (20, 21). Specifically, vagal activity when an organism is at rest is regarded as a mechanism for maintaining homeostasis (22). On the other hand, during changing or demanding situations (e.g., stress) the vagal system is thought to function as a sort of “brake” to facilitate control (23). According to this theory, greater vagal tone (“braking”) during a stress episode indicated better behavioral control, whereas decreasing vagal tone during challenging/attentional tasks reflects impaired vagal braking which undermines behavioral control and may impair social interactions (23). Environmental burdens may be particularly harmful to those with poor vagal control during challenges. A number of studies have yielded evidence that is consistent with this hypothesis (24, 25). On the other hand, an excessively controlled vagal system may also be associated with neurodevelopmental disorders. For instance, relative to children who exhibited “normal” vagal withdrawal responses during stress, autistic children did not display this response but instead exhibited continued vagal tone (26). Therefore, in addition to considering the potential “main effects” of nonessential metal exposures on neurodevelopment, the present study also examined the possibility that this environmental burden may impair neurodevelopment depending on underlying differences in vagal responses to acute stress.
Methods
Participants
The participants were drawn from the ongoing Environmental Exposures and Child Health Outcomes (EECHO) study, a research project investigating the relationships among exposures to environmental toxicants and cardiovascular risk indices in 9–11 year old children living in low- to middle-income neighborhoods in a midsize city in upstate New York. The EECHO sample contains an approximately equal number of Black/African American and White/European American, male and female children. The study excludes any children who are not self identified as either Black or White, are not 9–11 years old, do not meet zip code residence selection criteria (designed to target low SES neighborhoods and roughly equal numbers of Black and White children), those with serious medical or developmental disabilities, and those who were on medications that might affect their cardiovascular system. We have currently recruited 210 children; however, a programming error in the online survey tool at the beginning of the study resulted in missing questionnaire data for 7 children. Therefore, the data for this paper were from 203 children (representing 170 families) recruited into EECHO thus far. With respect to joint participation, 134 children participated alone, 54 children participated with 1 sibling, and 15 children participated with 2 siblings. As we describe below, the data analysis plan reflected the nested nature of the data. The parent/caregiver informant was usually the mother (86%); in some cases the informant was a father (9%), grandmother (2%), or other custodian (e.g., aunt; 3%).
Procedure
Participants arrived at our laboratory and blood draw center located on the Syracuse University campus and signed an assent form while a parent signed a separate consent form approved by the Institutional Review Board of Syracuse University. As part of a more extensive blood draw protocol, a certified phlebotomist drew 5-mL venous blood into a plastic lavender-top (EDTA), certified by the analyzing laboratory for measurement of blood levels of Pb and (total) Hg concentrations. Blood specimens were immediately placed on ice and within 2 hours of the blood draw the samples were transferred into 5-mL cryovials (certified by the analyzing laboratory) and frozen at −80°C pending shipment to the trace elements section of the Laboratory for Inorganic and Nuclear Chemistry at the New York State Department of Health’s Wadsworth Center, Albany, NY. During the initial laboratory visit and a subsequent visit 1.5 weeks later, questionnaires were administered using iPads and Qualtrics Survey software (Quatrics, Provo, UT). Because blood specimens were not analyzed prior to testing, all EECHO staff was blind to exposure during this extensive testing protocol.
Measures
Exposure to Nonessential Metals: Child’s Blood Pb and Hg Levels
Whole blood was analyzed for Pb and total Hg using a well-established biomonitoring method optimized for a Thermo XSeries2 Inductively Coupled Plasma-Mass Spectrometer (ICP-MS), which was used throughout this study (Thermo Fischer Scientific, MA). A complete description of the biomonitoring method has been described elsewhere (27). The ICP-MS instrument was calibrated for each of the metals using a matrix-matched (blood) protocol, with calibration standards traceable to the National Institute of Standards and Technology (NIST, Gaithersburg, MD). Method detection limits were calculated during the study using the IUPAC recommendations for each metal in a blood matrix: 0.10 μg/dL for Pb; and 0.12 μg/L for Hg. Internal quality control (IQC) materials (four levels) covering the range of exposures expected in the US population were analyzed at the beginning, end and throughout each analytical run. All IQC samples were prepared in-house from whole blood obtained from Pb-dosed animals, and supplemented with inorganic salts of Hg, and methylmercury chloride. Typical repeatability, or between-run imprecision, was 2.6% for Pb; and 4.0% for Hg. Method accuracy was assessed throughout the study by analyzing NIST Standard Reference Material (SRM) 955c – Toxic Metals in Caprine Blood. Method performance was monitored through successful participation in six external quality assessment schemes for trace elements that included these two metals in whole blood. The analysis was repeated for any elevated value: >5 μg/dL for Pb, and >10 μg/L for Hg. In addition, 2.5% of all blood specimens were randomly selected for re-analysis.
Hostility and other Disruptive Behaviors
The Cook-Medley Hostility Index – Youth Version was administered to participants and consisted of 26 items in a true/false response format (28, 29) created from the adult version (30) to assess hostile attitudes among children (α = 0.79 in the current sample). In addition to a total score, subscales included Cynical Distrust (“I think most people lie to get ahead”), Angry Affect (“I don’t get angry easily” -reverse scored), and Aggression (“At times, I have had to get rough with people who were rude or ‘bugging’ me”). Internal consistencies for the Cynical Distrust and Aggression subscales were reasonable (αs = 0.69 and 0.57, respectively); however, the internal consistency for the Angry Affect subscale (α = 0.32) was too low and therefore this subscale was not analyzed further.
Disruptive Behaviors were measured using the 26-item Disruptive Behavioral Disorders (DBD) scale (31) administered to the parent. This measure includes items such as “Argues with adults” and “Doesn’t pay attention” with responses made on a 4-point Likert scale from 0=Not at all to 3=Very much. The measure provides scores for Oppositional Defiant Disorder behaviors (α = 0.92 in the current sample), ADHD-inattentive type behaviors (α = 0.93), and ADHD-hyperactivity type behaviors (α = 0.89), as well as clinical cut-points for each of these scores.
Emotion Regulation
The 36-item Difficulties in Emotion Regulation Scale (DERS(32)) was administered to participants; it measures a variety of emotion regulation difficulties and have been validated among adolescents(33). This measure has items prefaced with “When I am upset…” and includes such statements as “I lose control over my behaviors” and “it takes me a long time to feel better;” responses are made on a 5-point Likert scale ranging from “almost never” to “almost always”. In addition to a total score, subscales include Nonacceptance of Emotional Responses, Difficulties Engaging in Goal-Directed Behavior, Impulse Control Difficulty, Lack of Emotional Awareness, Limited Access to Emotional Regulation Abilities, and Lack of Emotional Clarity. The total score had good internal consistency in the current sample (α = 0.88), with acceptable but slightly lower internal consistency among the subscales listed above (α’s = 0.81, 0.80, 0.65, 0.76, 0.79, and 0.55, respectively).
ASD Symptoms
The Autism Spectrum Quotient (ASQ) – Adolescent Version (34) is a 50-item parent-rated questionnaire that assesses symptoms of ASD in children. This questionnaire has demonstrated construct validity in previous research (34); internal consistency in the current sample was acceptable (α = 0.72). ASQ subscales for this measure include Social Skills, Attention Switching, Attention to Detail, Communication, and Imagination. In a study validating the ASQ(34), approximately 90% of the adolescents with Asperger’s Syndrome (AS)/High Functioning Autism had scores above 30, whereas all of the controls had lower scores. A score of 30 thus was used to generate a dichotomous ASQ outcome (yes/no) index for statistical analyses.
HRV (Vagal Reponses to Acute Stress)
We measured inter-beat intervals (IBI; the times between successive heart beats) generated and stored from ECG data generated at a sampling rate of 500 Hz, well within the sampling frequency recommended by the Task Force of the European Society of Cardiology that published guidelines for the collection and interpretation of HRV data (35). These measurements were made during a 10-minute baseline period (during which participants watched a relaxing video about Hawaii, cf. (36)) followed by 3 acute stress tasks – reaction time, mirror image tracing, signal detection – which were presented in a counterbalanced order using the E-Prime™ program (37). We have previously reported details on these tasks (38). HRV was calculated using the Nevrokard™ HRV program (Nevrokard Kiauta, k.d., Slovenia). Before computing HRV, missing or noisy segments and ectopic beats were replaced by visual inspection and linear interpolation and by research staff who were blind to exposures. The HRV distributions were skewed and consequently were natural log transformed (ln). Task levels were normalized (z-scored) and averaged across tasks. HRV responses were then calculated by subtracting baseline levels from task levels. Components of HRV were assessed in the low frequency (LF) and high frequency (HF) power spectrum, both indices of parasympathetic activity (39). The LF/HF ratio was calculated from these measures and may reflect some degree of sympathetic-parasympathetic balance (35); however, this assumption has been recently challenged (39). Negative scores (particularly for HF) represent greater vagal withdrawal during the stressors. Positive scores represent greater vagal augmentation during stressors.
Covariates
Potential confounding variables were identified a priori by selecting a small set of variables that prior research has shown to be correlated with the study outcomes (40). This approach avoids over-fitting a model that occurs when “cherry picking” covariates from a larger set of potential confounds (41). The justification for the inclusion of 4 covariates and the measurement method are as follows. Gender differences have been reported for disruptive behaviors (42). Participant gender and race was obtained by self-report. Race differences have also been reported for hostility (43); however, this difference has been shown to be a product of differences in SES (43). Participants’ parents reported their annual household income and the occupation and education level of both the participants’ parents (when known or available), as described in Hollingshead (44). Parental income was based on a 1–10 scale and adjusted by dividing income by the square root of the number of people living in the household (45). The income, education, and occupation data were each converted into a z-score and averaged. As such, missing data (n = 1 for income and education, n = 3 for occupation) was based on available data with the exception of one subject whose mother refused to compete the survey and therefore this participant was assigned a 0 z-score (mean substitution). Given that developmental changes in disruptive behaviors and emotion regulation are well documented (46), the child’s age was also included as a covariate.
Statistical Analyses
All statistical analyses were conducted using SAS 9.4. All statistical models were considered without covariates as well as with the inclusion of 4 covariates outlined above: sex, race, age, and SES. Because the distribution of blood Pb and Hg levels were not normally distributed and showed a positive skew (skewness = 1.41 and 9.50, respectively), these measures were log transformed. Although blood Pb and Hg levels were not correlated (p > 0.20), to be conservative and to create the most accurate models of independent effects we included both simultaneously in all models. Because some siblings participated from the same family and therefore had a shared family environment, we used PROC MIXED (for continuous outcomes) and GENMOD (for nominal outcomes) to test generalized linear models with fixed and random effects. In these models, we used a single random factor (labeled family) to account for any family nesting effects among the siblings participating in the study (47). Although PROC MIXED and GENMOD produce only unstandardized estimates, we converted all variables to standard scores in an additional step and were thereby able to report standardized estimates in Tables 2 and 3. To reduce the probability of a Type I error, the analysis of subscales is only included if the total score was significant.
Table 2.
Standardized estimates (with 95% confidence intervals) for blood Pb and Hg predicting hostility, disruptive behaviors, emotion regulation, and autism spectrum behaviors (N = 206) are reported. Estimates are shown for Model 1 (no covariates) as well as estimates from Model 2 that controlled for gender, race, age, and socioeconomic status, All models included both Pb and Hg.
| Pb | Hg | |||
|---|---|---|---|---|
| Model 1 | Model 2 | Model 1 | Model 2 | |
| Hostility | ||||
| Total Score | 0.22** (0.08, 0.36) | 0.17* (0.02 – 0.31) | 0.04 (−0.10, 0.18) | 0.02 (−0.12 – 0.16) |
| Aggression | 0.16* (0.01, 0.30) | 0.10 (−0.15, 0.14) | 0.01 (−0.14, 0.15) | 0.11 (−0.03, 0.25) |
| Hostile Distrust (“Cynicism” scale) | 0.27** (0.13, 0.41) | 0.22** (0.08, 0.36) | 0.03 (−0.11, 0.16) | 0.01 (−0.13, 0.14) |
| Disruptive Behaviors | ||||
| Oppositional Defiant Disorder (Score) | 0.16* (0.02, 0.31) | 0.18* (0.02, 0.33) | 0.02 (−0.12, 0.16) | 0.02 (−0.12, 0.17) |
| ADHD-Inattention (Score) | 0.01 (−0.14, 0.15) | −0.01 (−0.15, 0.14) | 0.12 (−0.03, 0.26) | 0.11 (−0.03, 0.25) |
| ADHD-Hyperactivity (Score) | 0.16* (0.02, 0.30) | 0.11 (−0.04, 0.26) | 0.05 (−0.09, 0.19) | 0.05 (−0.09, 0.19) |
| Emotion Regulation | ||||
| Total Score | 0.20** (0.06, 0.34) | 0.13# (−0.02, 0.28) | −0.05 (−0.19, 0.09) | −0.06 (−0.20, 0.08) |
| Nonacceptance of Emotional Responses | 0.19** (0.05, 0.33) | 0.12 (−0.03, 0.27) | −0.05 (−0.19, 0.09) | −0.06 (−0.20, 0.08) |
| Difficulties Engaging in Goal-Directed Behavior | −0.04 (−0.19, 0.10) | −0.06 (−0.21, 0.09) | 0.02 (−0.12, 0.17) | 0.03 (−0.12, 0.17) |
| Impulse Control Difficulty | 0.16* (0.02, 0.30) | 0.08 (−0.07, 0.22) | 0.02 (−0.12, 0.16) | 0.01 (−0.14, 0.14) |
| Lack of Emotional Awareness | 0.17* (0.02, 0.32) | 0.17* (0.02, 0.32) | −0.06 (−0.20, 0.08) | −0.06 (−0.20, 0.08) |
| Limited Access to Emotion Regulation Abilities | 0.06 (−0.08, 0.20) | 0.08 (−0.07, 0.23) | 0.02 (−0.13, 0.16) | −0.07 (−0.22, 0.07) |
| Lack of Emotional Clarity | 0.18* (0.04, 0.32) | 0.18* (0.02, 0.33) | 0.12 (−0.02, 0.26) | −0.09 (−0.23, 0.05). |
| Autism-Spectrum Quotient (ASQ) | ||||
| Total Score | 0.08 (−0.06, 0.23) | 0.12 (−0.03, 0.28) | 0.01 (−0.14, 0.14) | 0.06 (−0.09, 0.20) |
p < 0.10;
p < 0.05;
p < .01
Table 3.
Analysis of Autism-Spectrum Quotient (ASQ) as a function of the interaction between Hg and HRV (N = 195). Reported are standardized estimates (with 95% confidence intervals) for Hg associations with ASQ for differing (low vs. high) levels of HRV responses to acute stress. Results with significant or marginally significant interactions are shown in bold. All models include controls for age, gender, race, SES, and Pb.
| Vagal Reactivity* Hg | |||
|---|---|---|---|
| LF* Hg | HF* Hg | LF/HF* Hg | |
| Autism-Spectrum Quotient (ASQ) | Hg (Low LF)/Hg (High LF) | Hg (Low HF)/Hg (High HF) | Hg (Low LF/HF)/Hg (high LF/HF) |
| Total Score | −0.12 (−0.33, 0.09)/0.22* (0.01, 0.44) | −0.01 (−0.24, 0.21)/0.12 (−0.09, 0.34) | −0.13 (−0.36, 0.10); 0.24* (0.01, 0.46) |
| Social Skills | −0.09 (−0.31, 0.12)/0.18# (−0.03, 0.40) | 0.04 (−0.19, 0.27)/0.05 (−0.17, 0.26) | −0.18 (−0.40, 0.05)/0.26* (0.04, 0.49) |
| Attention Switching | −0.04 (−0.26, 0.18)/0.03 (−0.19, 0.25) | −0.02 (−0.25, 0.21)/0.02 (−0.20, 0.23) | −0.09 (−0.32, 0.14)/0.09 (−0.13, 0.32) |
| Attention to Detail | −0.10 (−0.32, 0.11)/0.18# (−0.03, 0.40) | −0.11 (−0.34, 0.12)/0.18# (−0.03, 0.39) | 0.06 (−0.17, 0.29)/0.02 (−0.21, 0.24) |
| Communication | 0.02 (−0.19, 0.23)/0.13 (−0.08, 0.34) | 0.12 (−0.10, 0.34)/0.05 (−0.17, 0.26) | −0.03 (−0.25, 0.19)/0.19# (−0.02, 0.41) |
| Imagination | −0.13 (−0.33, 0.07)/0.11 (−0.10, 0.31) | −0.05 (−0.27, 0.16)/0.04 (−0.16, 0.24) | −0.19# (−0.41, 0.02)/0.15 (−0.06, 0.36) |
p < 0.10;
p < 0.05;
p < .01
Results
Sample Characteristics
The sample consisted of 203 children with an average age of 10.59 (SD = 0.89), 57.2% were Black, 42.8% were White, and 47.1% were female (see Table 1). The sample was low-middle SES in terms of household income and parental education, as expected based on targeted zip codes. Thirty-four percent of the participants’ families made less than $15,000 per year, 19% made between $15,000 and $35,000, 34% made above $35,000, and 12% were missing income data.
Table 1.
Characteristics (Mean and SD, or %) of participants (N = 203)
| Mean (SD)
|
||
|---|---|---|
| or % | Range | |
| Measure | ||
| Child age (yrs) | 10.58 (0.88) | 9.05 – 11.99 |
| Gender | 47.1 % Female | |
| Race (White/Black) | 57.2 % Black | |
| Socioeconomic Status1 | ||
| Education (average if 2 parents)2 | 5.10 (1.67) | 1.00 – 8.00 |
| Occupation (score) | 5.16 (2.25) | 1.00 – 9.00 |
| Income3 | 6.34 (2.87) | 1.00 – 10.00 |
| Blood Pb (μg/dL) | 0.98 (0.61) | 0.19 – 3.25 |
| Blood Hg (μg/L) | 0.46 (1.02) | 0.01 – 11.65 |
As indicated in the methods section, the three measures of socioeconomic status (education, occupation, and income) were converted to z-scores and combined to yield a single measure of SES.
On this education scale, a score of five corresponds to “some college”. As outlined in the methods section, education was averaged across parents.
On this income scale, a score of six corresponds to “$20,000 – 25,000”. As outlined in the methods section, this income was subsequently adjusted for the number of persons living in the household.
Exposure to low-level Pb and Hg in Relation to Children’s Behavior
As shown in Table 2, each measure of the children’s behavior was analyzed in models without covariates (Model 1) and then controlling for gender, race, age, and SES (Model 2). Without covariates, increasing Pb was associated with higher levels of hostile distrust (t (35) = 3.10, p < .01) and increasing total hostility (t (35) = 3.22, p < .01). After controlling covariates, these associations remained significant with increasing blood Pb associated with significantly higher levels of hostile distrust (t (31) = 3.10, p = 0.004) and increasing total hostility (t (31) = 2.39, p = 0.04), as reported by the child. Without covariates, increasing Pb was also significantly associated with higher levels of aggression (t (35) = 2.23, p < .05); however, this association was no longer significant after inclusion of covariates (p > 0.10). In the analysis of parent-reported disruptive behaviors (using scores rather than clinical cut-points), increasing blood Pb was associated with increasing ODD behaviors in the model without covariates (t (34) = 2.16, p = .04) as well as with covariates (t (30) = 2.20, p = 0.03; see Figure 1). Increasing Pb was also associated with significantly greater ADHD-hyperactivity in the base model (t (34) = 2.31, p < 0.05) but was no longer significant after controlling for covariates (t (30) = 1.50, p > 0.10). For the analysis of the child reported emotion regulation in models without covariates, increasing blood Pb was associated with significantly greater total difficulties (t (35) = 2.90, p < 0.01), less acceptance of one’s emotional responses (t (35) = 2.79, p < 0.01), difficulty with impulse control (t (35) = 2.29, p < 0.05), poorer awareness of one’s own emotions (e.g., “I’m attentive to my feelings” – reverse scored; t (35) = 2.99, p < 0.01), and less clarity about one’s emotions (e.g., “I have no idea how I’m feeling”; t (35) = 2.54, p < 0.05). For the analysis of the child reported emotion regulation in models with the inclusion of covariates, increasing blood Pb was associated with marginally greater total difficulties (t (31) = 1.82, p < 0.10), poorer awareness of one’s own emotions (e.g., “I’m attentive to my feelings” – reverse scored; t (31) = 2.35, p < 0.05), and less clarity about one’s emotions (e.g., “I have no idea how I’m feeling”; t (31) = 2.37, p < 0.05). In the analysis of ASQ scores, the total score was not significant associated with Pb or Hg in base models and in models with covariates (p values > 0.10).
Figure 1.
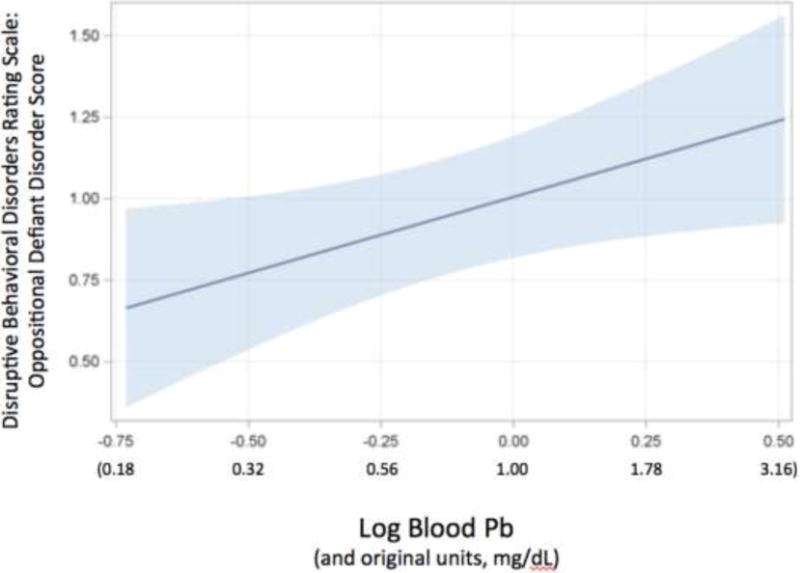
Oppositional Defiant Disorder (ODD) scores from Disruptive Behavioral Disorders Rating Scale as a function of blood Pb (p < 0.05). ODD scores are residuals having controlled for our standard set of covariates. Pb was analyzed as a log-transformed value but is reported in the original units as well.
Based on clinical cut-points for some measures, the frequency of neurodevelopmental disorders in this sample were 15.9%, 15.4%, 11.0%, and 4.9% for ODD, ADHD-inattention type, ADHD-hyperactivity/impulsive type, and Asperger’s/High Functioning Autism, respectively. Blood Pb and Hg levels were not associated with ODD (p values > 0.15), ADHD-inattention type (p values > 0.25), ADHD-hyperactive/impulsive type (p values > 0.25), and Asperger’s/High Functioning Autism (p values > 0.25).
Role of Vagal Response to Acute Stress
Before examining HRV responses to acute stress (task-induced changes from resting baseline), we examined the relationships of Pb and Hg with the baseline levels of ln LF, ln HF, and ln LF/HF. After entering our standard covariates in the statistical models, neither Hg nor Pb were significantly related to baseline HRV indices (ps > 0.25). Based on our hypotheses, we then considered the interaction between nonessential metals and HRV indices in the prediction of psychological and behavioral outcomes. No significant interactions were found with Pb and full scale (total) scores. In addition, no significant interactions (p values > 0.05) were found for total scores of hostility, disruptive behaviors, and emotional regulation. However, a number of significant interactions were found between Hg and ASD total scores as well as subscales (see Table 3 and Figure 2). For ASD total symptom scores, a significant Hg*LF HRV interaction (t (30) = 2.34, p < 0.05) and Hg*LF/HF HRV interaction (t (30) = 2.39, p < 0.05) revealed that increasing Hg was associated with greater autism spectrum symptoms specifically for those children with low HRV withdrawal (continued vagal tone) during acute stress (see Table 3 and interaction for total ASQ illustrated in Figure 2). An analysis of ASQ subscales revealed significant or marginally significant interactions for social skills (t (26) = 1.87, p < 0.10, for Hg*LF HRV, and t (26) = 2.75, p < 0.05, for Hg*LF/HF HRV), attention to detail (t (26) = 1.94, p < 0.10, for Hg*LF HRV, and t (26) = 1.90, p < 0.10, for Hg*HF HRV), and imagination (t (26) = 2.26, p < 0.05). The patterns of these interactions are similar to that for the total ASD score and are show in Table 3.
Figure 2.
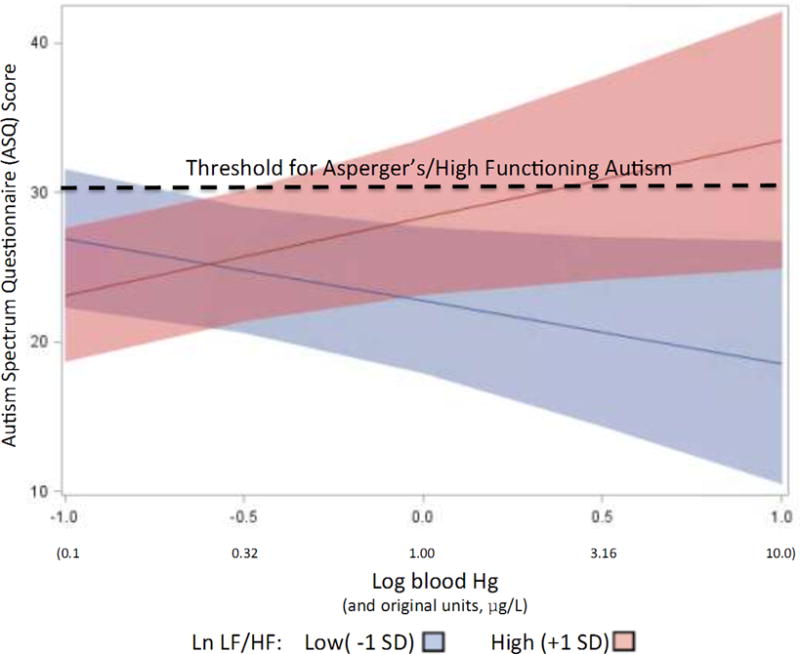
Autism Spectrum Questionnaire (ASQ) scores as a function of blood Hg levels for children with low LF/HF change (high “reactivity”) and high LF/HF change (low “reactivity”). Dashed line represents threshold of 30 for classification as Asperger’s/High Functioning Autism.
Discussion
Much evidence connects high levels of environmental Pb exposure with neurodevelopmental risks in children. The present study suggest that harmful neuro-behavioral effects of blood Pb may occur at levels of exposure that are significantly lower than the levels usually studied, and that they may be detected across the different physiological, psychological, and social regulatory systems that underlie and enable competent everyday functioning. The pattern of significant associations observed here suggests that Pb is significantly associated with impairments in a child’s ability to regulate emotions, form trusting and supportive interpersonal relationships, and regulate aggressive and oppositional behaviors that undermine adjustment in family, neighborhood, and school settings. Greater Pb exposure, even within a relatively low range of levels, was associated with a tendency to be more suspicious and distrusting of others, more aggressive, to display ODD behaviors, to feel uncomfortable and uncertain about one’s emotional responses, and to have difficulties with communication. It is important to note that these significant associations between Pb and psychological variables are found within a range of blood Pb levels from 0.19 to 3.25 g/dL, well below the reference value of 5 μg/dL, defined as 97.5th percentile for children in NHANES set by the CDC in 2012 (2). However, it is also important to note that we found no significant associations using clinical cut-points.
We found no evidence of simple associations between blood Hg exposure and neurodevelopmental/psychological impairments. In addition, although some prior research has shown an association between Hg and baseline HRV (48–50), we found no such associations in our data. However, significant interactions between Hg and vagal responses to acute stress were found in predicting ASQ. This interaction revealed a significant positive association between Hg and ASQ specifically for children with greater HRV during acute stress. In other words, children who responded to the stress tasks with greater increases in vagal tone (indexed by greater HRV) also showed higher frequencies of ASD symptoms with increasing Hg levels. This suggests that an excessive vagal “brake” during stress may put children at an increased risk from exposure to Hg and thereby a greater frequency of autism spectrum symptoms. This finding is consistent with evidence that perhaps autism is associated with greater vagal tone during stress (26); however, the role of vagal responses to acute stress remains poorly studied and some research suggests that greater vagal tone during acute stress serves as a protective factor for children faced with adverse family environments (51).
There are notable limitations with the present study. First, the cross-sectional study design makes it difficult to establish causality. For example, it is possible that children’s behaviors (hostile distrust, aggressiveness, poor emotion regulation) produced behaviors that increased exposure to Pb. Despite this logical possibility, we are unaware of any specific means by which these particular behaviors might increase blood Pb levels. In addition, although we did control for some potential confounds, there may have been other unmeasured confounds. For example, although exposure to Hg and Pb was controlled for in all our analyses (in other words, all models included both of these toxicants), other toxicants such as perfluorochemicals (PFCs) and polybrominated diphenyl ethers (PBDEs) may covary with Pb and Hg and be associated with the outcomes we measured (52, 53). We plan to seek funding to measure these additional toxicants. Second, we conducted numerous tests of associations and therefore might have inflated Type I error. However, the consistency of findings (identifying problems with relevance to social processes) across informant sources (child and parent) and the number of significant associations relative to analyses enhances confidence in the validity of our findings.
Conclusions
Although a number of studies have demonstrated associations between Pb exposure and delinquent behavior(54), cognitive functioning(55), and classroom behavior(13), the present study is the first to demonstrate an association between very low-level blood Pb levels (all <3.25 μg/dL) and fundamental psychological mechanisms (i.e., increased hostile distrust and impaired emotion regulation) that might explain these more complex outcomes. With respect to Hg exposure, we found entirely novel associations suggesting that Hg exposure might affect neurodevelopmental outcomes differently as a function of underlying differences in HRV responses to acute stress. Specifically, Hg exposure may increase autism spectrum behaviors for those children showing sustained vagal tone during acute stress (i.e., a lack of the typical increase in HRV and corresponding vagal withdrawal during acute stress). The novelty of these later findings requires additional research to confirm them.
Highlights.
Pb and Hg, psychological outcomes, and vagal responses were measured in children.
Pb levels were associated with hostility, ODD, and poor emotional regulation.
Hg was associated with autism spectrum for those with sustained vagal tone.
Acknowledgments
This work was supported by Grant ES023252 from the National Institutes of Health. We are grateful to Aylonna Whitney, Nicole Lynk, and Rachel Zajdel for their assistance in data collection. In addition, we are very grateful for the assistance of Barbara Samson and Jessica Flemming (phlebotomists) for their help with blood specimen collection.
Funding Source
Funded by the National Institutes of Health (NIH), grant number ES023252.
Abbreviations
- ADHD
Attention Deficit and Hyperactivity Disorder
- ASD
Autism Spectrum Disorder
- BMI
body mass index
- CDC
Centers for Disease Control and Prevention
- CDI
Child Depression Inventory
- CVD
cardiovascular diseases
- DBD
Disruptive Behavioral Disorders
- DERS
Difficulties in Emotion Regulation Scale
- EECHO
Environmental Exposures and Child Health Outcomes
- ECG
electrocardiogram
- HF-HRV
high frequency component of HRV
- LF-HRV
high frequency component of HRV
- Hg
mercury
- IBI
interbeat interval
- MDL
method detection limits
- Pb
lead
- SES
socioeconomic status
Footnotes
Publisher's Disclaimer: This is a PDF file of an unedited manuscript that has been accepted for publication. As a service to our customers we are providing this early version of the manuscript. The manuscript will undergo copyediting, typesetting, and review of the resulting proof before it is published in its final citable form. Please note that during the production process errors may be discovered which could affect the content, and all legal disclaimers that apply to the journal pertain.
Conflict of Interest
The other authors have indicated they have no potential conflicts of interest to disclose.
References
- 1.Lanphear B, Hornung R, Khoury J, Yolton K, Baghurst P, Bellinger D, et al. Low-level environmental lead exposure and children’s intellectual function: an international pooled analysis. Environ Health Perspect. 2005;113(7):894–9. doi: 10.1289/ehp.7688. [DOI] [PMC free article] [PubMed] [Google Scholar]
- 2.Canfield RL, Henderson CR, Cory-Slechta DA, Cox C, Jusko TA, Lanphear BP. Intellectual impairment in children with blood lead concentrations below 10 ug per deciliter. N Eng J Med. 2003;348:1517–1526. doi: 10.1056/NEJMoa022848. [DOI] [PMC free article] [PubMed] [Google Scholar]
- 3.Needleman H, Riess J, Tobin M, Biesecker G, Greenhouse J. Bone lead levels and delinquent behavior. JAMA. 1996;275(5):363–369. [PubMed] [Google Scholar]
- 4.Wasserman GA, Staghezza-Jaramillo B, Shrout P, Popovac D, Graziano J. The effect of lead exposure on behavior problems in preschool children. Am J Public Health. 1998;88(3):481–6. doi: 10.2105/ajph.88.3.481. [DOI] [PMC free article] [PubMed] [Google Scholar]
- 5.Davidson PW, Leste A, Benstrong E, Burns CM, Valentin J, Sloane-Reeves J, et al. Fish consumption, mercury exposure, and their associations with scholastic achievement in the Seychelles Child Development Study. Neurotoxicology. 2010;31(5):439–47. doi: 10.1016/j.neuro.2010.05.010. [DOI] [PMC free article] [PubMed] [Google Scholar]
- 6.Falco G, Llobet JM, Bocio A, Domingo JL. Daily intake of arsenic, cadmium, mercury, and lead by consumption of edible marine species. J Agric Food Chem. 2006;54(16):6106–12. doi: 10.1021/jf0610110. [DOI] [PubMed] [Google Scholar]
- 7.Fergusson JE, Kim ND. Trace elements in street and house dusts: sources and speciation. Sci Total Environ. 1991:100. doi: 10.1016/0048-9697(91)90376-p. Spec No:125–50. [DOI] [PubMed] [Google Scholar]
- 8.Boehmer TK, Foster SL, Henry JR, Woghiren-Akinnifesi EL, Yip FY, Centers for Disease C et al. Residential proximity to major highways - United States, 2010. MMWR Surveill Summ. 2013;62(Suppl 3):46–50. [PubMed] [Google Scholar]
- 9.Braun J, Froehlich T, Daniels J, Dietrich K, Hornung R, Auinger P, et al. Association of environmental toxicants and conduct disorder in US children: NHANES 2001–2004. Environmental Health Perspectives. 2008;116(7):956–962. doi: 10.1289/ehp.11177. [DOI] [PMC free article] [PubMed] [Google Scholar]
- 10.Macedoni-Luksic M, Gosar D, Bjorklund G, Orazem J, Kodric J, Lesnik-Musek P, et al. Levels of metals in the blood and specific porphyrins in the urine in children with autism spectrum disorders. Biol Trace Elem Res. 2015;163(1–2):2–10. doi: 10.1007/s12011-014-0121-6. [DOI] [PubMed] [Google Scholar]
- 11.Fuentes-Albero M, Puig-Alcaraz C, Cauli O. Lead excretion in spanish children with autism spectrum disorder. Brain Sci. 2015;5(1):58–68. doi: 10.3390/brainsci5010058. [DOI] [PMC free article] [PubMed] [Google Scholar]
- 12.Yorbik O, Kurt I, Hasimi A, Ozturk O. Chromium, cadmium, and lead levels in urine of children with autism and typically developing controls. Biol Trace Elem Res. 2010;135(1–3):10–5. doi: 10.1007/s12011-009-8494-7. [DOI] [PubMed] [Google Scholar]
- 13.Needleman HL. The neurobehavioral consequences of low lead exposure in childhood. Neurobehav Toxicol Teratol. 1982;4(6):729–32. [PubMed] [Google Scholar]
- 14.Mendelsohn AL, Dreyer BP, Fierman AH, Rosen CM, Legano LA, Kruger HA, et al. Low-level lead exposure and behavior in early childhood. Pediatrics. 1998;101(3):E10. doi: 10.1542/peds.101.3.e10. [DOI] [PubMed] [Google Scholar]
- 15.Kim S, Arora M, Fernandez C, Landero J, Caruso J, Chen A. Lead, mercury, and cadmium exposure and attention deficit hyperactivity disorder in children. Environ Res. 2013;126:105–10. doi: 10.1016/j.envres.2013.08.008. [DOI] [PMC free article] [PubMed] [Google Scholar]
- 16.Geier DA, Audhya T, Kern JK, Geier MR. Blood mercury levels in autism spectrum disorder: Is there a threshold level? Acta Neurobiol Exp (Wars) 2010;70(2):177–86. doi: 10.55782/ane-2010-1789. [DOI] [PubMed] [Google Scholar]
- 17.Hertz-Picciotto I, Green PG, Delwiche L, Hansen R, Walker C, Pessah IN. Blood mercury concentrations in CHARGE Study children with and without autism. Environ Health Perspect. 2010;118(1):161–6. doi: 10.1289/ehp.0900736. [DOI] [PMC free article] [PubMed] [Google Scholar]
- 18.Porges SW. Orienting in a defensive world: Mammalian modification of our evolutionary heritage. A polyvagal theory. Psychophysiology. 1995;32:301–318. doi: 10.1111/j.1469-8986.1995.tb01213.x. [DOI] [PubMed] [Google Scholar]
- 19.Hagan MJ, Roubinov DS, Adler NE, Boyce WT, Bush NR. Socioeconomic Adversity, Negativity in the Parent Child-Relationship, and Physiological Reactivity: An Examination of Pathways and Interactive Processes Affecting Young Children’s Physical Health. Psychosom Med. 2016;78(9):998–1007. doi: 10.1097/PSY.0000000000000379. [DOI] [PMC free article] [PubMed] [Google Scholar]
- 20.Suess PE, Porges SW, Plude DJ. Cardiac vagal tone and sustained attention in school-age children. Psychophysiology. 1994;31:17–22. doi: 10.1111/j.1469-8986.1994.tb01020.x. [DOI] [PubMed] [Google Scholar]
- 21.Calkins SD. Cardiac vagal tone indices of temperamental reactivity and behavioral regulation in young children. Dev Psychobiol. 1997;31(2):125–35. doi: 10.1002/(sici)1098-2302(199709)31:2<125::aid-dev5>3.0.co;2-m. [DOI] [PubMed] [Google Scholar]
- 22.Richards JE. Infant visual sustained attention and respiratory sinus arrhythmia. Child Dev. 1987;58(2):488–96. [PubMed] [Google Scholar]
- 23.Porges SW, Doussard-Roosevelt JA, Portales AL, Greenspan SI. Infant regulation of the vagal “brake” predicts child behavior problems: a psychobiological model of social behavior. Dev Psychobiol. 1996;29(8):697–712. doi: 10.1002/(SICI)1098-2302(199612)29:8<697::AID-DEV5>3.0.CO;2-O. [DOI] [PubMed] [Google Scholar]
- 24.Obradovic J, Bush NR, Boyce WT. The interactive effect of marital conflict and stress reactivity on externalizing and internalizing symptoms: the role of laboratory stressors. Dev Psychopathol. 2011;23(1):101–14. doi: 10.1017/S0954579410000672. [DOI] [PubMed] [Google Scholar]
- 25.Treadwell MJ, Alkon A, Quirolo KC, Boyce WT. Stress reactivity as a moderator of family stress, physical and mental health, and functional impairment for children with sickle cell disease. J Dev Behav Pediatr. 2010;31(6):491–7. doi: 10.1097/DBP.0b013e3181e2830f. [DOI] [PMC free article] [PubMed] [Google Scholar]
- 26.Toichi M, Kamio Y. Paradoxical autonomic response to mental tasks in autism. J Autism Dev Disord. 2003;33(4):417–26. doi: 10.1023/a:1025062812374. [DOI] [PubMed] [Google Scholar]
- 27.Palmer CD, Lewis ME, Jr, Geraghty C, Barbosa F, Jr, Parsons PJ. Determination of lead, cadmium and mercury in blood for assessment of environmental and occupational exposures: A comparison between inductively coupled plasma-mass spectrometry and atomic absorption spectrometry. Spectrochimica Acta B-Atomic Spectrometry. 2006;61:980–990. [Google Scholar]
- 28.Woodall K, Matthews K. Familial environment associated with type A behaviors and psychophysiological responses to stress in children. Health Psychol. 1989;8(4):403–26. doi: 10.1037//0278-6133.8.4.403. [DOI] [PubMed] [Google Scholar]
- 29.Raikkonen K, Matthews KA, Salomon K. Hostility predicts metabolic syndrome risk factors in children and adolescents. Health Psychology. 2003;22:279–286. doi: 10.1037/0278-6133.22.3.279. [DOI] [PubMed] [Google Scholar]
- 30.Cook WW, Medley DM. Proposed hostility and pharisaic-virtue scores for the MMPI. Journal of Applied Psychology. 1954;38:414–418. [Google Scholar]
- 31.Pelham WJ, Gnagy E, Greenslade K, Milich R. Teacher ratings of DSM-III-R symptoms for the disruptive behavior disorders. J Am Acad Child Adolesc Psychiatry. 1992;31(2):210–8. doi: 10.1097/00004583-199203000-00006. [DOI] [PubMed] [Google Scholar]
- 32.Gratz KL, Roemer L. Multidimensional assessment of emotional regulation and dysregulation: Development, factor structure, and initial validation of the difficulties in emotion regulation scale. Journal of Psychopathology & Behavioral Assessment. 2004;26(1):41–54. [Google Scholar]
- 33.Neumann A, van Lier PA, Gratz KL, Koot HM. Multidimensional assessment of emotion regulation difficulties in adolescents using the Difficulties in Emotion Regulation Scale. Assessment. 2010;17(1):138–49. doi: 10.1177/1073191109349579. [DOI] [PubMed] [Google Scholar]
- 34.Baron-Cohen S, Hoekstra RA, Knickmeyer R, Wheelwright S. The autism-spectrum quotient (AQ)—Adolescent version. Journal of autism and developmental disorders. 2006;36(3):343–350. doi: 10.1007/s10803-006-0073-6. [DOI] [PubMed] [Google Scholar]
- 35.Cardiology TFotESo. Heart rate variability: Standards of measurement, physiological interpretation, and clinical use. Eur Heart J. 1996;17:354–381. [PubMed] [Google Scholar]
- 36.Gump BB, Matthews KA. Do background stressors influence reactivity and recovery from acute stressors? Journal of Applied Social Psychology. 1999;29(3):469–494. [Google Scholar]
- 37.Schneider W, Eschman A, Zuccolotto A. E-Prime User’s Guide. Pittsburgh: Psychology Software Tools, Inc; 2012. [Google Scholar]
- 38.Gump BB, MacKenzie JA, Bendinskas K, Morgan R, Dumas AK, Palmer CD, et al. Low-level Pb and cardiovascular responses to acute stress in children: The role of cardiac autonomic regulation. Neurotoxicology and Teratology. 2011;33:212–219. doi: 10.1016/j.ntt.2010.10.001. [DOI] [PMC free article] [PubMed] [Google Scholar]
- 39.Billman GE. The LF/HF ratio does not accurately measure cardiac sympatho-vagal balance. Front Physiol. 2013;4:26. doi: 10.3389/fphys.2013.00026. [DOI] [PMC free article] [PubMed] [Google Scholar]
- 40.Ewout W, Harrell FE., Jr . Statistical models for prognostication. In: Max MB, Lynn J, editors. Symptom research: Methods and Opportunities. Bethesda: National Insitutes of Health; 2009. [Google Scholar]
- 41.Babyak M. What you see may not be what you get: a brief, nontechnical introduction to overfitting in regression-type models. Psychosom Med. 2004;66(3):411–21. doi: 10.1097/01.psy.0000127692.23278.a9. [DOI] [PubMed] [Google Scholar]
- 42.Ringoot AP, Jansen PW, Steenweg-de Graaff J, Measelle JR, van der Ende J, Raat H, et al. Young children’s self-reported emotional, behavioral, and peer problems: the Berkeley Puppet Interview. Psychol Assess. 2013;25(4):1273–85. doi: 10.1037/a0033976. [DOI] [PubMed] [Google Scholar]
- 43.Gump BB, Matthews KA, Raikkonen K. Modeling relationships among socioeconomic status, hostility, cardiovascular reactivity, and left ventricular mass in African American and White children. Health Psychology. 1999;18:140–150. doi: 10.1037//0278-6133.18.2.140. [DOI] [PubMed] [Google Scholar]
- 44.Hollingshead AB. Four factor index of social status. New Haven, CT: Hollingshead; 1975. [Google Scholar]
- 45.Rognerud M, Zahl P. Social inequalities in mortality: changes in the relative importance of income, education and household size over a 27-year period. The European Journal of Public Health. 2006;16(1):62–68. doi: 10.1093/eurpub/cki070. [DOI] [PubMed] [Google Scholar]
- 46.Loeber R, Burke JD, Pardini DA. Development and etiology of disruptive and delinquent behavior. Annu Rev Clin Psychol. 2009;5:291–310. doi: 10.1146/annurev.clinpsy.032408.153631. [DOI] [PubMed] [Google Scholar]
- 47.Wolfinger RD, Chang M. Proceedings of the Twentieth Annual SAS Users Group Conference. Cary, NC: SAS Institute, Inc; 1995. Comparing the SAS GLM and MIXED procedures for repeated measures. [Google Scholar]
- 48.Valera B, Dewailly E, Poirier P, Counil E, Suhas E. Influence of mercury exposure on blood pressure, resting heart rate and heart rate variability in French Polynesians: a cross-sectional study. Environ Health. 2011;10:99. doi: 10.1186/1476-069X-10-99. [DOI] [PMC free article] [PubMed] [Google Scholar]
- 49.Periard D, Beqiraj B, Hayoz D, Viswanathan B, Evans K, Thurston SW, et al. Associations of baroreflex sensitivity, heart rate variability, and initial orthostatic hypotension with prenatal and recent postnatal methylmercury exposure in the Seychelles Child Development Study at age 19 years. Int J Environ Res Public Health. 2015;12(3):3395–405. doi: 10.3390/ijerph120303395. [DOI] [PMC free article] [PubMed] [Google Scholar]
- 50.Valera B, Dewailly E, Poirier P. Cardiac autonomic activity and blood pressure among Nunavik Inuit adults exposed to environmental mercury: a cross-sectional study. Environ Health. 2008;7:29. doi: 10.1186/1476-069X-7-29. [DOI] [PMC free article] [PubMed] [Google Scholar]
- 51.El-Sheikh M, Whitson SA. Longitudinal relations between marital conflict and child adjustment: vagal regulation as a protective factor. J Fam Psychol. 2006;20(1):30–9. doi: 10.1037/0893-3200.20.1.30. [DOI] [PubMed] [Google Scholar]
- 52.Gump B, Wu Q, Dumas A, Kannan K. Perfluorochemical (PFC) exposure in children: associations with impaired response inhibition. Environ Sci Technol. 2011;45(19):8151–9. doi: 10.1021/es103712g. [DOI] [PMC free article] [PubMed] [Google Scholar]
- 53.Gump BB, Yun S, Kannan K. Polybrominated diphenyl ether (PBDE) exposure in children: possible associations with cardiovascular and psychological functions. Environmental research. 2014;132:244–250. doi: 10.1016/j.envres.2014.04.009. [DOI] [PMC free article] [PubMed] [Google Scholar]
- 54.Needleman HL, Mcfarland C, Ness R, Tobin M, Greenhouse J. Bone lead levels in adjudicated delinquents: A case-control study. Pediatric Research. 2000;47:155A. doi: 10.1016/s0892-0362(02)00269-6. [DOI] [PubMed] [Google Scholar]
- 55.Bellinger DC, Needleman HL, Eden AN, Donohoe MT, Canfield RL, Henderson CRJ, et al. Intellectual impairment and blood lead levels. NEJM. 2003;349:500–502. doi: 10.1056/NEJM200307313490515. [DOI] [PubMed] [Google Scholar]