Abstract
We used the PCR to study the presence of two plant pathogens in archived wheat samples from a long-term experiment started in 1843. The data were used to construct a unique 160-yr time-series of the abundance of Phaeosphaeria nodorum and Mycosphaerella graminicola, two important pathogens of wheat. During the period since 1970, the relative abundance of DNA of these two pathogens in the samples has reflected the relative importance of the two wheat diseases they cause in U.K. disease surveys. Unexpectedly, changes in the ratio of the pathogens over the 160-yr period were very strongly correlated with changes in atmospheric pollution, as measured by SO2 emissions. This finding suggests that long-term, economically important, changes in pathogen populations can be influenced by anthropogenically induced environmental changes.
Keywords: Mycosphaerella graminicola, quantitative PCR, Phaeosphaeria nodorum, septoria diseases, sulfur
Diseases such as plague (1) or Dutch elm disease (2) break out and disappear unpredictably. Understanding of factors governing long-term disease dynamics is hampered by a lack of long time-series data because surveys are generally short-term responses to immediate problems. Wheat disease survey data from England and Wales (1970–2003) suggest that the relative importance of the two septoria blotch diseases, caused by Phaeosphaeria nodorum or Mycosphaerella graminicola, changed in the 1980s, with P. nodorum more prevalent in the 1970s and M. graminicola now more common (3–5). These two diseases cause losses of millions of tonnes of grain worldwide every season, and changes in their relative importance have also been reported elsewhere in the world (6). The two fungal pathogens frequently coexist on leaves, and both damage plants by decreasing photosynthetic areas of upper leaves that fill grain. Several explanations for these changes in the relative abundance of P. nodorum and M. graminicola have been suggested, including changes in cultivar resistance (7) and fungicide use (8), but a predictive understanding has not been achieved.
Detection of ancient microbial DNA in historical samples has proved valuable for studying infectious diseases of humans, animals (9), and plants (10, 11). An opportunity to investigate the long-term dynamics of P. nodorum and M. graminicola populations is provided by the availability of PCR assays and the existence of an archive of samples from the long-term Broadbalk winter wheat experiment (12). This experiment, run continuously at Rothamsted (Harpenden, United Kingdom) since autumn 1843, contains a series of plots, each receiving distinct fertilizer inputs. Wheat straw samples (chopped/crushed leaves and stems) have been archived at harvest in almost all years since 1844. Samples were oven-dried, usually at 80°C, stored in sealed containers, and maintained above 5°C. Symptoms of septoria diseases are visible on archived leaf specimens; extensive data on cultural practices and climate are available. This paper describes work to examine agronomic and environmental factors affecting long-term fungal pathogen population dynamics. Quantitative real-time PCR assays were used to determine the amounts of M. graminicola, P. nodorum, and wheat DNA present in a set of samples covering a 160-yr period of wheat production.
Materials and Methods
Sample Selection. Samples from one plot were not available in all harvest years during the 160-yr period. To obtain consistent runs of data from the archive, we used wheat straw samples from two plots: plot 10 [receiving only 96 kg of N per hectare (ha) each year] from 1844 to 1864, and plot 8 (receiving 144 kg of N per ha, 35 kg of P per ha, 90 kg of K per ha, and 12 kg of Mg per ha each year) from 1872 to 2003. Few samples were available between 1864 and 1892. Samples were available for both plots 8 and 10 in 1844, 1862, and 1872. These samples were used to check for consistency between the two plots.
DNA Extraction, Purification, and Quantification. Approximately 2 g of chopped leaf and stem material per sample was taken from archive containers with sterile forceps. The samples were powdered in liquid nitrogen by using cleaned, autoclaved pestles and mortars. DNA was extracted and quantified as described (13), except that extraction buffer was amended to include 5 mM 1,10-phenanthroline monohydrate and 2% (wt/vol) polyvinylpyrrolidone to clean up DNA (14). Aerosol-protected pipette tips were used at all stages during DNA extraction and PCR amplification to prevent contamination.
PCR Assay Development. This assay used 5′→3′ nuclease activity of Taq DNA polymerase to cleave a probe, labeled with both a quencher (3′ end) and a fluorescent reporter dye (5′ end). To overcome the problems of DNA degradation associated with ancient DNA (10), minor groove binder-conjugated probes (15) targeting small DNA fragments were used. The primers and Taq Man minor groove binder probes were designed by using primer express software (version 7.1, Applied Biosystems). To detect M. graminicola, 0.1 μM 6-carboxyfluorescein-labeled probe (5′-TTACGCCAAGACATTC-3′) and 0.4 μM of the primers 5′-GCCTTCCTACCCCACCATGT-3′ and 5′-CCTGAATCGCGCATCGTTA-3′ were used to target a 63-bp fragment of the β-tubulin gene (GenBank accession no. AY547264). For P. nodorum, 0.1 μM VIC-labeled probe (5′-TCCGCCGCTCATTGA-3′), 0.3 μM 5′-AGACCGGTCAATGCGTAAGC-3′, and 0.5 μM 5′-ACCCTGCGAGCTGTTAGATTTTC-3′ were used to amplify a 69-bp fragment of the β-tubulin gene (GenBank accession no. S56922). For Triticum aestivum (wheat), a 66-bp fragment of ATP synthase α-subunit DNA sequence (GenBank accession no. M16842) was targeted by using 0.1 μM tetrachloro-6-carboxyfluorescein-labeled probe (5′-CCTCTTCAAACAGGGCT-3′), 0.6 μM 5′-AATTTCCAGGCGTTCCGTATAC-3′, and 0.2 μM 5′-GGGATCATCGAATCGATAGCAA-3′. Specificity of target sequences, mostly pathogen-specific variable β-tubulin intron sequences, was confirmed both by blast nucleotide database searches and by testing against genomic DNA of seven other fungal pathogens of cereals. Conservation of the targets was confirmed by alignment of sequences from several different P. nodorum or M. graminicola isolates and various wheat cultivars in selected recent/ancient samples. Simultaneous detection of P. nodorum and M. graminicola targets was unreliable, and tests were done with single targets. Presence or absence of the two pathogens in archive samples was also confirmed by amplification of different targets, e.g., partial sequences of ATP synthase α-subunit, β-tubulin, and cytochrome b (GenBank accession no. AY247213), using conventional PCR, indicating that the target sequence had not changed significantly over time.
PCR Assays. PCR assays were done in 25-μl reaction volumes (capped MicroAmp Optical 96-well reaction plates, Applied Biosystems), consisting of 5 μl of sample (50 ng of total DNA), 0.5 μl of carboxy-X-rhodamine reference dye (Invitrogen), 12.5 μl of platinum quantitative PCR supermix-uracil DNA glycosylase (Invitrogen), and 7 μl of sterile distilled water containing primers and probes at various concentrations. Uracil DNA glycosylase and dUTP (instead of dTTP) were included in the PCR mixture to prevent reamplification of carry-over PCR products between reactions (16). Reactions were run on a Prism 7700 sequence detection system (Applied Biosystems) for 2 min at 50°C, 2 min at 95°C, followed by 50 cycles of 15 s at 95°C and 1 min at 60°C. The increase in fluorescence from probes was registered at every temperature step and cycle during the reaction, and data were analyzed with sequence detector software (version 1.9, Applied Biosystems). For each sample, threshold cycles (Ct, cycle at which the increase of fluorescence exceeded the background) were determined. Standard curves for each target were generated by plotting known amounts of DNA against Ct values. The resulting regression equations were used to calculate amounts of DNA in “unknown” samples. No-template and autoclaved archive samples both gave negative results, and samples spiked with target DNA gave positive results. All reactions were run at least twice, and samples detected earlier than no-template controls were regarded as positive. Agreement between replicates was poor for a few samples where small amounts of target DNA were detected; for these samples the threshold detection value was used (0.2 pg for both P. nodorum and M. graminicola). Where only one pathogen was absent, a value of one-half the detection threshold was used to calculate the ratio. The values were transformed with natural logarithms to ensure the data reflected changes in abundance of the two pathogens symmetrically and because causal factors are more likely to affect relative values than absolute values of the ratio.
Correlations. We compared the DNA data for each pathogen and the ratio of P. nodorum to M. graminicola DNA to climatic and agronomic factors implicated as affecting the prevalence of the two septoria diseases by previous wheat disease surveys or experimental studies. These factors included changes in cultivar grown (7) and harvesting technique, sowing date (17), rainfall in May and June (18), temperature in November and December (19), sunshine in August before sowing (20), the proportion of the cereal growing area sown to wheat (21), and the introduction of fungicide seed treatments and foliar fungicide sprays (8). Agronomic information on the Broadbalk experiment (sowing date, application of seed treatments, and foliar fungicides) was obtained from the Broadbalk “white book” record series and national cereal area data from the Department for Environment, Food and Rural Affairs (York, United Kingdom). Meteorological data were obtained from the Rothamsted Electronic Archive for 1879–2003; data for 1843–1878 came from the Central England Temperature Database maintained by the Hadley Centre for Climate Prediction and Research at the Meteorological Office, Bracknell, United Kingdom. The two datasets were very closely correlated, but the average winter temperature was ≈1.4°C greater in the Central England Temperature series than in the Rothamsted series. Central England Temperature data were therefore corrected by this off-set to produce a combined meteorological data series for Rothamsted back to autumn 1843.
Because pollutants are known to affect plant pathogens (22), including P. nodorum (23), we also compared the Broadbalk data with available long-term data for pollutants, including atmospheric emissions of sulfur dioxide (SO2) (24, 25), lead (26), cadmium (27), polychlorinated biphenyls, and polyaromatic hydrocarbons (28).
Results and Discussion
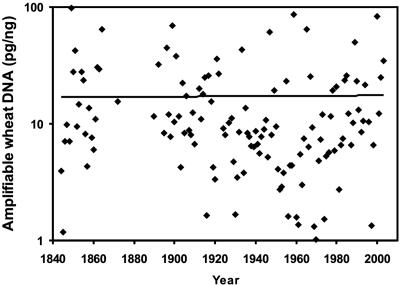
Validity of PCR Data. Where samples were available from both plots 8 and 10 (1844, 1862, and 1872), results agreed well. Furthermore, differences in nitrogen fertilization between these two plots were considered too small to influence these two pathogens (29), and reduced phosphate availability may equally decrease abundance of both (30). For the purposes of the long-term pathogen dataset, the data from the two plots were therefore combined into a single series. Over the 160-yr period, only samples from 1923 and 1926 showed some partial inhibition of PCR, as shown by spiking experiments and amplification curves for different targets. These years were omitted from the analysis. There was generally good agreement between six independently extracted replicate samples taken at regular intervals over the whole period (1852, 1872, 1900, 1925, 1950, 1975, and 2000) [SEM (loge scale) 0.21, P. nodorum; 0.28, M. graminicola]. Amounts of target wheat DNA detected did not change systematically with sample age but varied between years (Fig. 1), possibly because the preservation of leaf/stem tissues at harvest differed between years.
Fig. 1.
Time series of amplifiable wheat DNA from Broadbalk harvest samples, 1844–2003. Wheat DNA amplified from Broadbalk samples relative to a fresh wheat sample of the same total DNA amount (50 ng) is shown.
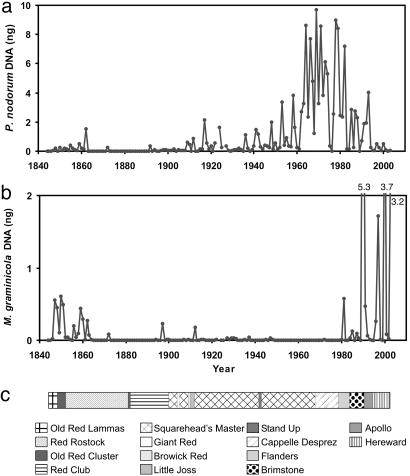
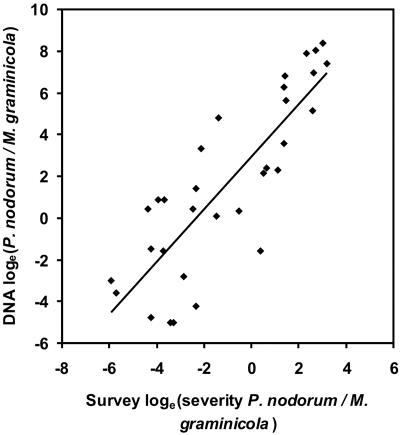
Pathogen Abundance. Changes in amounts of DNA of the two pathogens (Fig. 2 a and b) show that M. graminicola, the most abundant pathogen since the 1980s, was also abundant in the mid-19th century. P. nodorum DNA was more abundant than M. graminicola DNA for much of the 20th century, with a peak ≈1970. The ratio of P. nodorum to M. graminicola DNA was unaffected by differences between years in the preservation of pathogen DNA, and our analysis is therefore concentrated on this ratio. The ratio of the DNA of the two pathogens correlated well with the ratio of severity of the two septoria diseases, estimated from survey data in England and Wales during the period 1970–2003 (Fig. 3). This observation confirmed that trends in Broadbalk pathogen data were representative of national disease trends, as expected from population genetic and epidemiological evidence that single genetic populations of these pathogens cover large geographical areas (31, 32). Furthermore, this observation suggests that changes in relative importance of the two diseases observed in the 1980s (3–5) were part of a long-term pattern (Fig. 2).
Fig. 2.
Changes in amplifiable pathogen DNA in harvest leaf/stem samples from the Broadbalk experiment over the period 1844–2003. (a) P. nodorum. (b) M. graminicola.(c) Changes in cultivars; Cappelle Desprez had straw ≈40 cm shorter than cultivars that preceded it. Flanders and subsequent cultivars were ≈20 cm shorter than Cappelle Desprez. Fungicide seed treatments were started in 1923, and foliar fungicide sprays were started in 1979. Crops were harvested by hand (1844–1900), self-binder (1901–1956), or combine harvester (1957–2003).
Fig. 3.
Relationship between Broadbalk and national survey data over the period 1970–2003. Broadbalk data are ratios of P. nodorum to M. graminicola DNA from winter wheat leaves/stems at harvest of the Broadbalk experiment. National disease survey data were collated from 300–400 randomly selected commercial crops in England and Wales in each year (including crops with different cultivars, agronomic regimes, and geographical variation in soil types and meteorology) (refs. 3–5 and the Department for Environment, Food and Rural Affairs, Central Science Laboratory). These data are ratios of visual severity of diseases caused by P. nodorum and M. graminicola on penultimate leaves of winter wheat at grain-fill (growth stage 73–75). Linear regression, r = 0.84; P < 0.001.
Correlations. Of agronomic and weather variables tested initially, harvest technique accounted for a significant proportion of the variance in the ratio of the two pathogens in the Broadbalk samples over the 160-yr period (Table 1). However, this correlation is unlikely to reflect a causal relationship, because very large changes in the ratio occurred during both the hand-harvest (1844–1900) and combine-harvest (since 1957) periods; the fit is probably simply due to dividing the 160-yr series into three parts and fitting separate means to each. There is a weak correlation with winter (December–February) temperature, but this explains only a small proportion of the year-to-year variation, leaving the major trends in the data unexplained. National changes in wheat area sown (21), cultivar susceptibility to M. graminicola (7), and the introduction of foliar fungicides in the late 1970s (8) coincided with an increase in abundance of M. graminicola in Broadbalk samples (Fig. 2a). However, it is unlikely that foliar fungicides could have caused the changes, given the previous abundance of M. graminicola in the mid-19th century, before fungicides were introduced. The relationship between area sown to wheat and M. graminicola abundance (21) is significant and biologically plausible, because shorter distances between wheat fields will increase the impact of ascospores as a primary inoculum source. However, this relationship explains only a small proportion of the variation in the ratio of the pathogens.
Table 1. Relationships between ratio of P. nodorum to M. graminicola DNA (loge-transformed) in harvest samples from the Broadbalk experiment, 1844–2003, and agronomic or environmental factors suggested as explanations for changes in prevalence of the two septoria diseases in England and Wales in the early 1980s.
| Factor (ref.) | df | P | R2 |
|---|---|---|---|
| August sunshine before sowing (20)* | 1 | NS | 0 |
| Sowing date in autumn (17)† | 1 | 0.14 | 0.4 |
| Use of fungicide seed treatment† | 1 | NS | 0 |
| December-February temperature, seedling stage* | 1 | 0.03 | 6.2 |
| Use of foliar fungicide, spring (8)† | 1 | 0.06 | 2 |
| May-June rainfall, adult plant stage (18)* | 1 | NS | 0 |
| Crop height at harvest† | 1 | 0.07 | 1.7 |
| Harvest technique† | 2 | 0.001 | 25 |
| Wheat cultivar (7)† | 13 | 0.06 | 44 |
| England and Wales area sown to wheat (21)‡ | 1 | 0.001 | 11 |
| Interpolated SO2 deposition (24, 25) | 1 | 0.001 | 61 |
Relationships were assessed by linear regression (percentage of variance accounted for R2). NS, not significant.
All meteorological data are from the Electronic Rothamsted Meteorological Database (1879-2003) or Central England Temperature Database at the Hadley Centre for Climate Prediction and Research, Bracknell, United Kingdom (autumn 1843-1878; adjusted for systematic differences from Rothamsted).
Data are from Broadbalk “white book” record series. See Fig. 2 for more details.
Data are from the Department for Environment, Food and Rural Affairs, Economics and Statistics Department.
Cultivar explains a substantial, but not quite significant, proportion of the variation in the ratio. This observation has to be interpreted cautiously because cultivars will automatically provide a moderately good fit because (with the exception of Squareheads Master, Fig. 2c) they were not used in the experiment over long periods, so fitting them corresponds to fitting averages for different time periods and can automatically reproduce any long-term trend in the data. An increase in cultivar susceptibility to M. graminicola associated with introduction of semidwarf cultivars cannot explain the prevalence of M. graminicola in the mid-19th century, when crops were tall. The cultivar Cappelle Desprez, with good resistance to M. graminicola but susceptibility to P. nodorum, dominated national wheat production from the mid-1950s to the early 1970s. However, P. nodorum abundance began to increase before this time, during a 64-yr period when only Squareheads Master was grown on Broadbalk, and did not decrease until some years after the introduction of semidwarf cultivars very susceptible to M. graminicola in the late 1970s. In the 1990s there was a long period of selection for M. graminicola resistance in wheat cultivars, yet the relative abundance of the pathogen was greater then than in the early 1980s when very susceptible cultivars were widely grown.
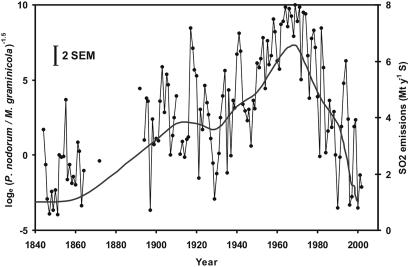
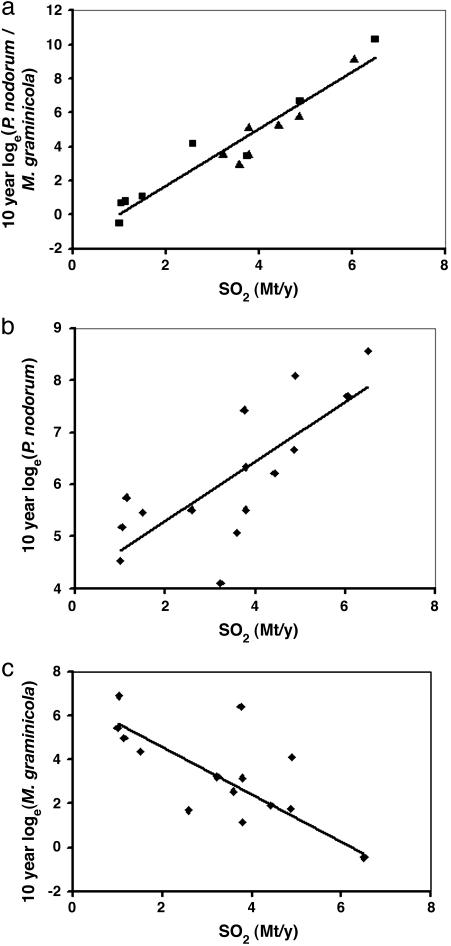
There was no relationship between changes in the pathogen DNA ratio and changes in lead (26), cadmium (27), polychlorinated biphenyls, or polyaromatic hydrocarbons (28). There was, however, a close relationship between changes in the ratio of the two pathogens and changes in U.K. atmospheric SO2 emissions (24, 25) over the 160-yr period (Fig. 4). There was a significant correlation between the 10-yr mean values for the ratio of the pathogens and SO2 emissions over the 160-yr period, including the 64-yr period when only Squareheads Master was grown (r = 0.96, P < 0.001) (Fig. 5a). These changes in U.K. SO2 emission have been directly related to changes in the ratio of stable sulfur isotopes (δ34S) in Broadbalk grain and straw over the 160-yr period, suggesting that national and local SO2 values are correlated (33). This relationship for the ratio reflects both a positive correlation between abundance of P. nodorum DNA and SO2 emissions (Fig. 5b) and a negative correlation between abundance of M. graminicola and SO2 emissions (Fig. 5c), but is much closer than either separately.
Fig. 4.
Relationship between ratio of P. nodorum to M. graminicola DNA in harvest samples from the Broadbalk experiment (1844–2003) and smoothed estimates of atmospheric SO2 emissions [megatonnes (Mt) of sulfur per year, gray line] (23, 24). Vertical bar (2 × SEM) is based on interreplicate variability for 7 yr with six replicate samples.
Fig. 5.
Relationships between changes in P. nodorum DNA and M. graminicola DNA in Broadbalk harvest samples and changes in atmospheric SO2 emissions over the period 1844–2003. (a) Relationship between ratio of P. nodorum to M. graminicola DNA and SO2 emissions (10-yr average values). Data are for Squareheads Master (▴) and other cultivars (▪). Linear regression, r = 0.96; P < 0.001. (b) Relationship between P. nodorum DNA and atmospheric SO2 emissions [10-yr average values (23, 24)]. Linear regression, r = 0.76; P < 0.001. (c) Relationship between M. graminicola DNA and SO2 emissions (10-yr average values). Linear regression, r = –0.76; P < 0.003.
These correlations might be explained by links between pathogen infection and SO2 or any factor well correlated with SO2. Correlations between SO2 and the agronomic and meteorological variables considered were very low, except with area sown to wheat (r = –0.43). However, the relationship between the pathogen DNA ratio and wheat area was much worse than that with SO2, so it seems more likely to have been related to changes in SO2 than to those in wheat area. Concentrations of tropospheric ozone, SO2, volatile organic compounds, ammonia, carbon, and nitrogen oxides all increased during the 20th century. These substances are known to affect physiological processes in plants (34) and may impair disease resistance mechanisms. Only recent ozone data are available. The average ozone concentrations have not declined in parallel with the pathogen data, but peak concentrations have decreased since the mid-1980s. SO2 has declined more rapidly than the other pollutants (35) and is much better correlated with the Broadbalk pathogen DNA data. It may act alone (36) or in a mixture with other pollutants (37) such as ozone, which is considered to favor infection by necrotrophic pathogens such as P. nodorum (23), presumably by inducing premature senescence of wheat tissues and nutrient leakage. By contrast, the hemibiotrophic M. graminicola, which penetrates leaves through stomata rather than directly through the cuticle and has a longer latent period than P. nodorum (6), might be adversely affected by SO2 pollution, like other hemibiotrophs (38, 39).
Conclusions
These data provide a unique insight into pathogen population dynamics over a 160-yr period. We suggest that the long-term pattern of changes in the ratio of abundance of P. nodorum [necrotrophic (6)] to M. graminicola [hemibiotrophic (6)] in the United Kingdom is linked to changes in atmospheric SO2 pollution, with absolute abundances of the two pathogens, short-term fluctuations, and seasonal variations within the overall pattern affected by meteorological, host, and agronomic factors. This link suggests an unexpected impact of anthropogenically induced environmental changes on the dynamics of pathogen populations. The study also shows the importance of long-term data for understanding and investigating factors affecting the dynamics of pathogens. Similar research on a range of natural systems is needed to assess the impact of a changing environment on biodiversity and to predict future disease outbreaks (40).
Acknowledgments
We thank the Rothamsted Farm and Field Experiments Committee for permission to use Broadbalk archive samples and the farm staff for collecting samples over 160 yr. We thank F. J. Zhao for assistance with SO2 data, P. Poulton for interpretation of archive information, and L. Castle for producing Fig. 2c and preparing all figures for publication. Data on disease severity for 1999–2003 were sourced from the cereals disease survey, which is funded by the Department for Environment, Food, and Rural Affairs and maintained by the Central Science Laboratory, York, United Kingdom. This work was funded by the Biotechnological and Biological Sciences Research Council, with additional funding from Syngenta, University of Reading, and the British Society for Plant Pathology.
Author contributions: S.J.B., M.W.S., B.A.F., and B.D.L.F. designed research; S.J.B. and B.A.F. performed research; S.J.B., M.W.S., and B.A.F. analyzed data; and S.J.B., B.A.F., M.W.S., and B.D.L.F. wrote the paper.
References
- 1.Keeling, M. J. & Gilligan, C. A. (2000) Nature 407, 903–906. [DOI] [PubMed] [Google Scholar]
- 2.Gilbert, G. S. (2002) Annu. Rev. Phytopathol. 40, 13–43. [DOI] [PubMed] [Google Scholar]
- 3.King, J. E. (1977) Plant Pathol. 26, 8–20. [Google Scholar]
- 4.Polley, R. W. & Thomas, M. R. (1991) Ann. Appl. Biol. 119, 1–20. [Google Scholar]
- 5.Hardwick, N. V., Jones, D. R. & Slough, J. E. (2001) Plant Pathol. 50, 453–462. [Google Scholar]
- 6.Eyal, Z. (1999) Eur. J. Plant Pathol. 105, 629–641. [Google Scholar]
- 7.Bayles, R. A. (1991) Plant Var. Seeds 4, 177–183. [Google Scholar]
- 8.Royle, D. J., Parker, S. R., Lovell, D. J. & Hunter, T. (1995) in A Vital Role for Fungicides in Cereal Production, eds. Hewitt, H. G., Tyson, D., Hollomon, D. W., Smith, J. M., Davies, W. P. & Dixon, K. R. (BIOS Scientific, Oxford), pp. 105–115.
- 9.Zink, A. R., Reischl, U., Wolf, H. & Nerlich, A. G. (2002) FEMS Microbiol. Lett. 213, 141–147. [DOI] [PubMed] [Google Scholar]
- 10.Ristaino, J. B., Groves, C. T. & Parra, G. R. (2001) Nature 411, 695–697. [DOI] [PubMed] [Google Scholar]
- 11.May, K. J. & Ristaino, J. B. (2004) Mycol. Res. 108, 471–479. [DOI] [PubMed] [Google Scholar]
- 12.Goulding, K. W. T., Poulton, P. R., Webster, C. P. & Howe, M. T. (2000) Soil Use Manage. 16, 244–250. [Google Scholar]
- 13.Fraaije, B. A., Lovell, D. J., Rohel, E. A. & Hollomon, D. W. (1999) J. Appl. Microbiol. 86, 701–708. [Google Scholar]
- 14.Zhang, J. & Stewart, J. M. (2000) J. Cotton Sci. 4, 193–201. [Google Scholar]
- 15.Afonina, I., Zivarts, M., Kutyavin, I. V., Lukhtanov, E. A., Gamper, H. & Meyer, R. B. (1997) Nucleic Acids Res. 25, 2657–2660. [DOI] [PMC free article] [PubMed] [Google Scholar]
- 16.Lindahl, T., Ljungquist, S., Siefert, W., Nyberg, B. & Sperens, B. (1977) J. Biol. Chem. 252, 3286–3294. [PubMed] [Google Scholar]
- 17.Gladders, P., Paveley, N. D., Barrie, I. A., Hardwick, N. V., Hims, M. J., Langton, S. & Taylor, M. C. (2001) Ann. Appl. Biol. 138, 301–311. [Google Scholar]
- 18.Tyldesley, J. B. & Thompson, N. (1980) Plant Pathol. 29, 9–20. [Google Scholar]
- 19.Parker, S. R., Lovell, D. J., Royle, D. J. & Paveley, N. D. (1999) in Septoria on Cereals: A Study of Pathosystems, eds. Lucas, J. A., Bowyer, P. & Anderson, H. M. (CABI, Wallingford, U.K.), pp. 96–107.
- 20.Daamen, R. A. & Stol, W. (1992) Neth. J. Plant Pathol. 98, 369–376. [Google Scholar]
- 21.Shaw, M. W. (1999) in Septoria on Cereals: A Study of Pathosystems, eds. Lucas, J. A., Bowyer, P. & Anderson, H. M. (CABI, Wallingford, U.K.), pp. 82–95.
- 22.Bell, J. N. B., McNeill, S., Houlden, G., Brown, V. C. & Mansfield, P. J. (1993) Parasitology 106, S11–S24. [Google Scholar]
- 23.von Tiedemann, A. (1991) J. Phytopathol. 134, 177–186. [Google Scholar]
- 24.United Kingdom Review Group on Acid Rain (1983) Acid Deposition in the United Kingdom (Warren Spring Laboratory, Stevenage, U.K.).
- 25.National Expert Group on Transboundary Air Pollution (2001) Transboundary Air Pollution: Acidification, Eutrophication and Ground Level Ozone in the UK (Dept. Environment, Food and Rural Affairs, London).
- 26.Jones, K. C., Symon, C. & Johnston, A. E. (1987) Sci. Total Environ. 61, 131–144. [DOI] [PubMed] [Google Scholar]
- 27.Johnston, A. E. & Jones, K. C. (1995) The Origin and Fate of Cadmium in Soil (Fertiliser Society, London).
- 28.Jones, K. C., Sanders, G., Wild, S. R., Burnett, V. & Johnston, A. E. (1992) Nature 356, 137–140. [Google Scholar]
- 29.Simon, M. R., Cordo, C. A., Perello, A. E. & Struik, P. C. (2003) J. Phytopathol. 151, 283–289. [Google Scholar]
- 30.Leath, S., Scharen, A. L., Lund, R. L. & Dietz-Holmes, M. E. (1993) Plant Dis. 77, 1266–1270. [Google Scholar]
- 31.Caten, C. E. & Newton, A. C. (2000) Plant Pathol. 49, 219–226. [Google Scholar]
- 32.Linde, C., Zhan, J. & McDonald, B. A. (2002) Phytopathology 92, 946–955. [DOI] [PubMed] [Google Scholar]
- 33.Zhao, F. J., Knights, J. S., Hu, Z. Y. & McGrath, S. P. (2003) J. Environ. Quality 32, 33–39. [DOI] [PubMed] [Google Scholar]
- 34.Darrall, N. M. (1989) Plant Cell Environ. 12, 1–30. [Google Scholar]
- 35.Goodwin, J. W. L., Salway, A. G., Murrells, T. P., Dore, C. J., Passant, N. R. & Eggleston, H. S. (2000) UK Emissions of Air Pollutants 1970–1998 (Atomic Energy Authority, Harwell, U.K.).
- 36.Smilanick, J. L., Hartsell, P. L., Henson, D., Fouse, D. C., Assemi, M. & Harris, C. M. (1990) Phytopathology 80, 217–220. [Google Scholar]
- 37.Adaros, G., Weigel, H. J. & Jäger, H. J. (1991) New Phytol. 118, 581–591. [Google Scholar]
- 38.Heagle, A. S. (1973) Annu. Rev. Phytopathol. 11, 365–388. [Google Scholar]
- 39.Mansfield, P. J., Bell, J. N. B., McLeod, A. R. & Wheeler, B. E. J. (1991) Agric. Ecosyst. Environ. 33, 215–232. [Google Scholar]
- 40.Harwell, C. D., Mitchell, C. E., Ward, J. R., Altizer, S., Dobson, A. P., Ostfield, R. S. & Samuel, M. D. (2002) Science 296, 2158–2162. [DOI] [PubMed] [Google Scholar]


