

Abstract
Alphonso is known as the “King of mangos” due to its unique flavor, attractive color, low fiber pulp and long shelf life. We analyzed the transcriptome of Alphonso mango through Illumina sequencing from seven stages of fruit development and ripening as well as flower. Total transcriptome data from these stages ranged between 65 and 143 Mb. Importantly, 20,755 unique transcripts were annotated and 4,611 were assigned enzyme commission numbers, which encoded 142 biological pathways. These included ethylene and flavor related secondary metabolite biosynthesis pathways, as well as those involved in metabolism of starch, sucrose, amino acids and fatty acids. Differential regulation (p-value ≤ 0.05) of thousands of transcripts was evident in various stages of fruit development and ripening. Novel transcripts for biosynthesis of mono-terpenes, sesqui-terpenes, di-terpenes, lactones and furanones involved in flavor formation were identified. Large number of transcripts encoding cell wall modifying enzymes was found to be steady in their expression, while few were differentially regulated through these stages. Novel 79 transcripts of inhibitors of cell wall modifying enzymes were simultaneously detected throughout Alphonso fruit development and ripening, suggesting controlled activity of these enzymes involved in fruit softening.
Introduction
Mango (Mangifera indica L.) is one of the most popular and highly favored fruit. Global mango production was reported to be 43.3 million metric tons in 2013 preceding banana, apple, grape and orange. (https://www.statista.com/statistics/237064/top-world-producers-of-selected-fresh-fruit-by-value-2009/). There are thousands of mango cultivars worldwide, among which Alphonso, Keitt, Kent, Lilli, Zill, Osteen, Haden, Kesar, Pairi, Dashehari, Langra and Banganapalli are well known. These varieties vary in their fruit color, size, shape, flavor, taste and ripening period and pattern. To understand the composition and biosynthesis of their unique flavor and complex ripening process various studies have been carried out at metabolic1–3, proteomic4–6, genetic7–15 and post-harvest processing16–20 levels. Whole genome sequencing and RNA sequencing (RNAseq) are the two important high throughput technologies recently adopted to understand the complex cellular and physiological processes in fruits such as citrus21, tomato22 and strawberry23 as well as domestication and diseases tolerance in citrus21, 24. Although mango genome sequence is yet not available, few recent studies have described the transcriptomic analysis from various tissues of few mango cultivars. The first report from Zill mango25 provided extensive transcriptomic and proteomic profiling from pulp and skin tissues of four fruit developing stages using pooled RNA but not stage specific and differentially expressed transcripts. Another study of leaf transcriptome and chloroplast genome sequencing from cultivar Langra provided information about the production of several bioactive compounds26. Transcriptome analysis from two (raw and ripe) and three (raw, mid ripe and ripe) stages of Kent27 and Dashehari fruit pulp28, respectively provided important insights into the ripening process and flavor biogenesis in these mango cultivars.
India is the largest producer and exporter of mango with 40.6% share in international mango market (http://www.fao.org). Among the Indian mango cultivars Alphonso is globally favored and highly exported mango due to its unique and attractive flavor, low fiber containing pulp and high carotene content29, 30. The ripening duration of Alphonso mango is 15 days from harvest, which is the highest among all mango cultivars; for example, the ripening duration for Kent and Dashehari mango fruit is 10 and 6 days, respectively27, 28. Fruit ripening in Alphonso mango progresses from skin towards the stone leading to attractive skin color and easy monitoring of ripening progress. On the other hand various mango varieties, viz. Haden, Keitt, Kent, Tommy Atkins (National Mango Board, USA; http://www.mango.org) and Dashehari28 show polarity of their ripening from fruit stone to skin, making it difficult to identify ripened fruits. Longer ripening duration and shelf life of Alphonso mango provides sufficient time for its transportation globally. The mechanisms underlying these unique properties of Alphonso mango need to be explored in depth at spatial and temporal level of fruit development and ripening using transcriptomic, proteomic and metabolomic approaches as they can be correlated to the specific phenotype. In the present study, we performed transcriptome analysis of Alphonso mango through eight different tissues such as flower, whole fruit at 30 and 60 DAP (Days After Pollination), pulp and skin of 90 DAP fruit (mature raw fruit) and pulp from three fruit ripening stages i.e. 5 DAH (Days After Harvest): table green stage; 10 DAH: mid ripe stage and 15 DAH: ripe stage to analyze various fruit developing and ripening processes in Alphonso mango.
Results
Alphonso mango transcriptome
Alphonso mango transcriptome was screened through eight tissue samples. To map differentially expressed transcripts a merged assembly was generated from the reads of all the tissues, which reflected upon overall Alphonso mango flower and fruit transcriptome. For each tissue read numbers were more than 100 million, which were assembled using k-mers 67, 75 and 83 separately and then merged for individual tissue. Average number of unique transcripts post assembly was 76,043 and with N50 and N80 values as 1,835 and 1,008 bp, respectively (Table 1). The minimum and maximum lengths of transcript from these assemblies were 100 and 17,342 bp, respectively (Table 1). Average number of transcripts was 11,925 upon filtering for redundancy and identifying candidate coding regions with maximum 90% identity and minimum 70% coverage (Table 2).
Table 1.
Alphonso de novo transcriptome assembly statistics.
| Library | k-mer | Number of transcripts | Total Loci | Max transcript length (bp) | Min transcript length (bp) | Average transcript length (bp) | Total assembled transcript length (bp) | N (ambiguous base) in Assembly | % of N in Assembly | Transcript >100 bases | Transcript >500 bases | Transcript >1000 bases | Transcript >10000 bases | N50 | N80 |
|---|---|---|---|---|---|---|---|---|---|---|---|---|---|---|---|
| Flower | 67 | 93034 | 52657 | 11812 | 67 | 1258.42 | 117076274 | 19738 | 0.000168591 | 92734 | 65039 | 46602 | 11 | 1878 | 1038 |
| Flower | 75 | 77624 | 49072 | 9554 | 75 | 1190.5 | 92411541 | 8636 | 9.35E-05 | 77529 | 53307 | 36738 | 0 | 1767 | 948 |
| Flower | 83 | 59964 | 43216 | 8515 | 83 | 1088.82 | 65289867 | 1718 | 2.63E-05 | 59950 | 39858 | 25880 | 0 | 1607 | 819 |
| Flower | Merge | 108468 | 25968 | 11810 | 100 | 1316.51 | 142798983 | 0 | 0 | 108459 | 86918 | 57729 | 7 | 1792 | 991 |
| 30DAP | 67 | 86382 | 47302 | 15826 | 67 | 1323.05 | 114287275 | 35912 | 0.000314226 | 85831 | 60199 | 43912 | 78 | 2014 | 1101 |
| 30DAP | 75 | 72205 | 44634 | 15531 | 75 | 1258.01 | 90834866 | 12431 | 0.000136853 | 72066 | 49617 | 34935 | 41 | 1896 | 1008 |
| 30DAP | 83 | 56044 | 39936 | 12729 | 83 | 1142.61 | 64036591 | 3219 | 5.03E-05 | 56023 | 37033 | 24431 | 6 | 1720 | 858 |
| 30DAP | Merge | 101839 | 22937 | 15923 | 100 | 1379.66 | 140503210 | 0 | 0 | 101831 | 82127 | 55153 | 51 | 1895 | 1032 |
| 60DAP | 67 | 83471 | 45979 | 15420 | 67 | 1302.75 | 108741771 | 34825 | 0.000320254 | 82922 | 57930 | 41937 | 49 | 1980 | 1085 |
| 60DAP | 75 | 68994 | 42677 | 15586 | 75 | 1251.44 | 86342100 | 13325 | 0.000154328 | 68845 | 47437 | 33343 | 19 | 1885 | 1002 |
| 60DAP | 83 | 53149 | 37771 | 12269 | 83 | 1149.93 | 61117755 | 3912 | 6.40E-05 | 53112 | 35635 | 23635 | 2 | 1710 | 871 |
| 60DAP | Merge | 97639 | 22857 | 15586 | 100 | 1367.7 | 133540400 | 0 | 0 | 97625 | 78534 | 52880 | 31 | 1879 | 1030 |
| 90DAP Skin | 67 | 71479 | 41296 | 15966 | 67 | 1315.74 | 94048042 | 21996 | 0.00023388 | 71136 | 49940 | 36213 | 58 | 1990 | 1087 |
| 90DAP Skin | 75 | 60601 | 39188 | 15506 | 75 | 1239.73 | 75128774 | 11071 | 0.00014736 | 60476 | 41350 | 28762 | 30 | 1874 | 985 |
| 90DAP Skin | 83 | 47769 | 35414 | 14057 | 83 | 1114.63 | 53244933 | 3903 | 7.33E-05 | 47734 | 31184 | 20097 | 6 | 1683 | 820 |
| 90DAP Skin | Merge | 83832 | 20646 | 17342 | 100 | 1360.29 | 114035452 | 0 | 0 | 83817 | 67358 | 44798 | 47 | 1866 | 1014 |
| 90DAP Pulp | 67 | 44496 | 30174 | 15542 | 67 | 1290.02 | 57400897 | 4191 | 7.30E-05 | 44430 | 31603 | 22541 | 31 | 1903 | 1047 |
| 90DAP Pulp | 75 | 40194 | 29670 | 13653 | 75 | 1175.86 | 47262652 | 2419 | 5.12E-05 | 40166 | 27424 | 18405 | 19 | 1741 | 911 |
| 90DAP Pulp | 83 | 35021 | 28601 | 10602 | 83 | 1004.51 | 35179037 | 628 | 1.79E-05 | 35015 | 21568 | 13015 | 3 | 1530 | 704 |
| 90DAP Pulp | Merge | 50448 | 15808 | 15542 | 100 | 1297.29 | 65445727 | 0 | 0 | 50445 | 40882 | 25935 | 28 | 1742 | 945 |
| 5DAH | 67 | 53017 | 34113 | 14231 | 67 | 1243.82 | 65943359 | 6471 | 9.81E-05 | 52913 | 36300 | 25920 | 25 | 1882 | 1026 |
| 5DAH | 75 | 44560 | 31464 | 12211 | 75 | 1188.26 | 52948984 | 1539 | 2.91E-05 | 44550 | 30232 | 20738 | 15 | 1775 | 939 |
| 5DAH | 83 | 36283 | 28248 | 10605 | 97 | 1076 | 39040480 | 285 | 7.30E-06 | 36282 | 23661 | 15187 | 1 | 1595 | 798 |
| 5DAH | Merge | 58650 | 16942 | 14390 | 100 | 1306.91 | 76650373 | 0 | 0 | 58645 | 47088 | 30652 | 26 | 1769 | 969 |
| 10DAH | 67 | 49255 | 29960 | 12544 | 67 | 1335.9 | 65799836 | 7462 | 0.000113405 | 49143 | 35439 | 26041 | 7 | 1981 | 1112 |
| 10DAH | 75 | 42952 | 28652 | 9554 | 75 | 1259.87 | 54114011 | 4163 | 7.69E-05 | 42910 | 30351 | 21523 | 0 | 1863 | 1016 |
| 10DAH | 83 | 35672 | 26433 | 8215 | 83 | 1137.45 | 40575250 | 1056 | 2.60E-05 | 35665 | 24150 | 16127 | 0 | 1677 | 875 |
| 10DAH | Merge | 55433 | 15560 | 14694 | 100 | 1406.1 | 77944611 | 0 | 0 | 55431 | 45727 | 31224 | 10 | 1901 | 1060 |
| 15DAH | 67 | 46057 | 28952 | 10959 | 67 | 1294.4 | 59616054 | 5774 | 9.69E-05 | 45972 | 32815 | 23684 | 2 | 1913 | 1067 |
| 15DAH | 75 | 40136 | 27796 | 9458 | 75 | 1214.11 | 48729396 | 3030 | 6.22E-05 | 40104 | 27750 | 19219 | 0 | 1805 | 962 |
| 15DAH | 83 | 33362 | 25674 | 8195 | 86 | 1073.14 | 35801945 | 498 | 1.39E-05 | 33357 | 21850 | 13938 | 0 | 1598 | 795 |
| 15DAH | Merge | 52033 | 14787 | 10959 | 100 | 1369.58 | 71263347 | 0.00E + 00 | 0 | 52029 | 43001 | 28703 | 3 | 1838 | 1023 |
| All | Merge | 434366 | 31629 | 15967 | 100 | 1326.31 | 576104058 | 0 | 0 | 434313 | 345481 | 224075 | 170 | 1835 | 972 |
Table 2.
Number of non redundant (NR) transcripts/sample.
| Assembly | No of NR transcripts |
|---|---|
| Flower | 15778 |
| 30 DAP | 14622 |
| 60 DAP | 14090 |
| 90 DAP pulp | 9382 |
| 90 DAP skin | 12664 |
| 5 DAH | 10084 |
| 10 DAH | 9748 |
| 15 DAH | 9032 |
Unique transcripts from each assembled and filtered set were subjected to BLASTx against the non-redundant dataset from NCBI (http://www.ncbi.nlm.nih.gov). From a total of 20,755 unique transcripts from the merged assembly, 92.22% transcripts were annotated while 954 transcripts (4.59%) encoded hypothetical proteins and 661 (3.17%) remained unidentified. BLASTx statistics revealed maximum hits from Citrus sinensis and C. clementina followed by Theobroma cacao, Jatropha curcas, Vitis venifera and Ricinus communis (Fig. 1a). Total 74,330 GO terms related to various biological processes (BP), molecular functions (MF) and cellular components (CC) were assigned to these 20,755 unique transcripts. Metabolic, cellular and single organism processes followed by biological regulation and localization were the most abundant terms under the BP category; binding and catalytic activity related terms under MF category; while, organelle, membrane and macromolecular complex terms under the CC category, respectively (Fig. 1b, Supplementary Figure SF1).
Figure 1.
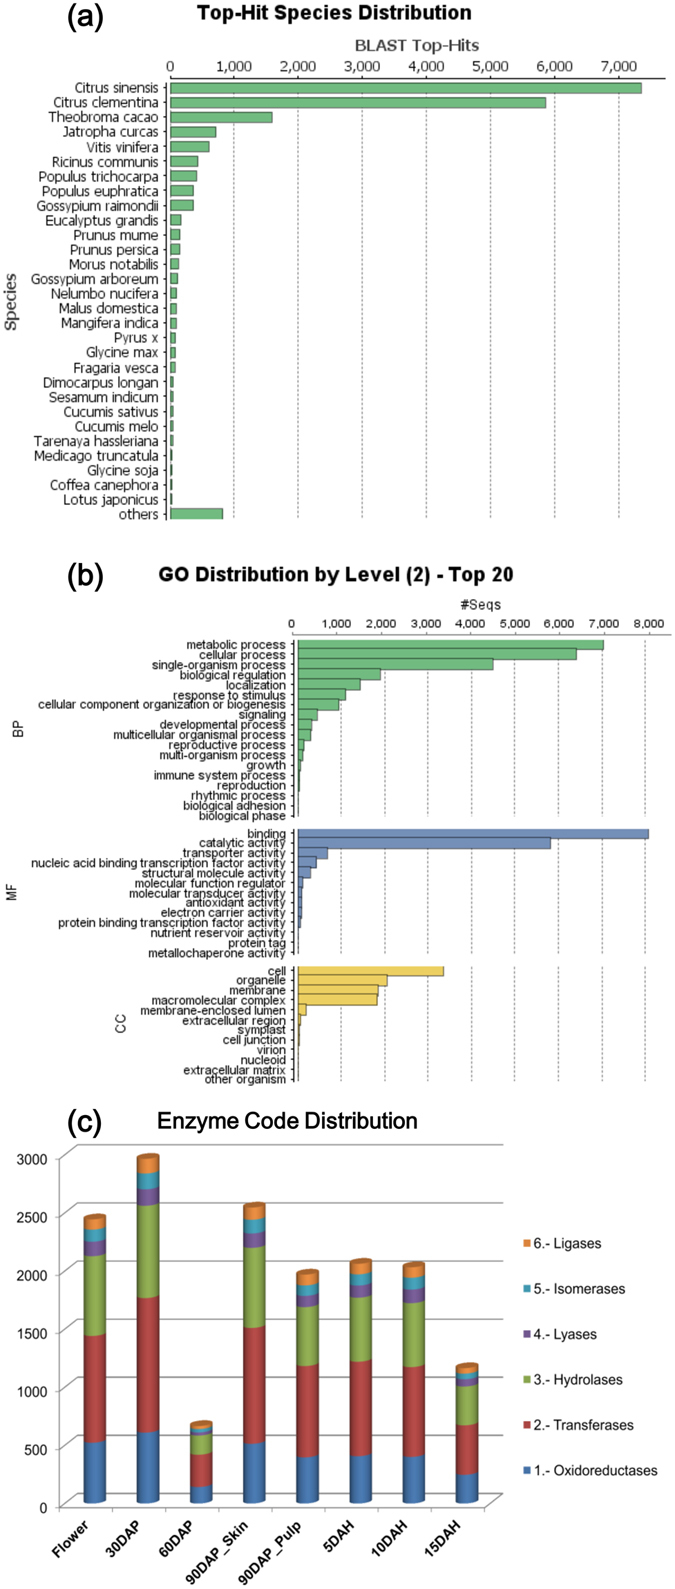
Blast statistics showing (a) distribution of top hit species, (b) distribution of top gene ontologies from BP: biological processes, MF: molecular functions and CC: cellular components and (c) Enzyme code distribution: number of transcripts (Y-axis) encoding six classes of enzymes through various stages of Alphonso mango fruit development and ripening (X-axis).
Unique transcripts were assigned enzyme commission (EC) number to determine the involvement of these transcripts in various BPs. Total 4,611 ECs were assigned from oxidoreductase, transferase, hydrolase, ligase, lyase and isomerase classes; wherein, transferases were the most abundant followed by hydrolases in all the eight tissues (Fig. 1c). These assigned ECs represented 142 known pathways from the KEGG database (http://www.genome.jp/kegg/pathway.html)31–33, which are potentially functional in Alphonso mango fruit development and ripening. Most of these pathways were saturated with higher number of annotations from transcriptome data e.g. metabolism of starch, sucrose and various amino acids including methionine and biosynthesis pathway of ethylene, phenylpropanoids and flavonoids (Supplementary Figure SF2).
Transcriptome changes through flower to fruit and fruit development to ripening
Variations in the transcriptome were studied using several parameters, such as differentially expressed transcripts, transcripts distinctive to a stage and gene ontology enrichment during flower to fruit transition and through process of fruit development and ripening.
Differentially expressed transcripts
Comparison between adjacent tissue stages was carried out to identify differentially expressed transcripts at each stage of fruit development and ripening (Table 3, Supplementary Table ST1). Flower to fruit of 30DAP, 524 transcripts were down regulated while 181 were up-regulated. Among the down-regulated transcripts alpha-amylase and subtilisin inhibitor-like (contig_6593), carbonic anhydrase (contig_5377), chitinase (contig_4907) and maternal effect embryo arrest 59 (contig_4949) exhibited the highest fold change (>2-fold); while homeodomain-like protein (contig_12912 and 12913), cytochrome p450 - cyp72a219-like (contig_4083), heat shock cognate 70 kDa protein (contig_5948) and inositol-3-phosphate synthase (contig_9620) were highly up-regulated (>2-fold).
Table 3.
Number of differentially expressed transcripts.
| Comparison | Up regulated | Down regulated |
|---|---|---|
| 30DAP vs Flower | 181 | 524 |
| 60DAP vs 30DAP | 73 | 7 |
| 90DAP pulp vs 60DAP | 31 | 158 |
| 90DAP skin vs 60DAP | 4 | 93 |
| 90DAP skin vs 90DAP pulp | 54 | 4 |
| 5DAH vs 90DAP pulp | 42 | 52 |
| 10DAH vs 5DAH | 191 | 418 |
| 15DAH vs 10DAH | 30 | 12 |
Transition from 30 DAP to 60 DAP resulted in up-regulation of 73 and down-regulation of seven transcripts. Important down-regulated transcripts were, n-acetyltransferase (contig_1261), 9-cis-epoxycarotenoid dioxygenase (contig_1680), protein reversion-to-ethylene sensitivity (contig_9164) and ethylene receptor 2 (contig_6147). While important up-regulated transcripts were nucleotide sugar transporter family protein (contig_6337), beta-xylosyltransferase (contig_4150), various cellulose synthase catalytic subunits and laccases. Comparison of 60 DAP fruit tissue with 90 DAP pulp and skin tissue, respectively revealed down-regulation of beta-xylosyltransferase, beta-d-xylosidase, cellulose synthase and galacturonosyl transferase; whereas spx and exs domain-containing protein was up-regulated in both 90 DAP pulp and skin. Up-regulation of homeobox protein sbh1, gdsl esterase lipase, caffeoyl shikimate esterase, hydroperoxide lyase, udp-rhamnose:rhamnosyl transferase and pectinesterase inhibitor was evinced from 90 DAP pulp tissue compared to that in 60 DAP fruit tissue. Evaluation of differentially expressed transcripts between pulp and skin of 90 DAP revealed very few transcripts down-regulated in skin with none of them showing change more than 2-fold, while 54 transcripts were up-regulated in 90 DAP skin tissue including the important ones as DNA mismatch repair protein msh5, acyl carrier protein, amino-acid permease, calcium-transporting ATPase, isoflavone reductase and various disease resistance proteins.
During ripening of Alphonso pulp from 90 DAP to 5 DAH, 42 transcripts were up-regulated (>2-fold) including methyltransferase, amino-acid permease, chloroplastic 9-cis-epoxycarotenoid dioxygenase, beta-galactosidase and protein phosphatase mainly, whereas 52 transcripts were down-regulated, important ones being few disease resistance proteins, peroxidase, sucrose synthase and glycerol-3-phosphate dehydrogenase. The highest level of differential expression was evinced through transition from 5 DAH to 10 DAH among all the ripening tissues wherein 418 transcripts were down and 191 were up-regulated. These stages are known for non-climacteric to climacteric transition during Alphonso fruit ripening based on metabolite analysis17, 34. Prominently down regulated transcripts were phospholipase-A LCAT3, sugar phosphate exchanger, auxin-responsive protein IAA9, abscisate β-glucosyltransferase and membrane-associated kinase regulator with more than 3-fold change, while up-regulated transcripts were aspartic proteinase nepenthesin, UDP-glucose 6-dehydrogenase, 1-aminocyclopropane-1-carboxylate oxidase, peroxidase, bidirectional sugar transporter sweet1-like, omega-6 fatty acid desaturase and squalene monooxygenase. During the transition from 10 DAH to 15 DAH stage, increased phosphate metabolism was evident. Total 30 transcripts were up-regulated mainly including phospholipase-D, inorganic pyrophosphatase, phosphate transporter, transcription factor glk2 and DNA translocase, whereas 12 transcripts were down-regulated and important ones were aspartic protease, plastocyanin-like domain protein, annexin d2-like and glucuronosyltransferase (>2-fold).
Idiosyncratic transcripts for the stage
Various transcripts unique to each of these stages (Fig. 2, Table 4, Supplementary Table ST2) representing multiple stage specific processes were identified during this comparative analysis. A total of 388 transcripts were identified as unique to flower tissue, which mostly included various transcription and translation factors, late embryogenesis abundant proteins, stress-sensitive and dehydration-responsive element-binding protein-1b and various ribosomal proteins.
Figure 2.
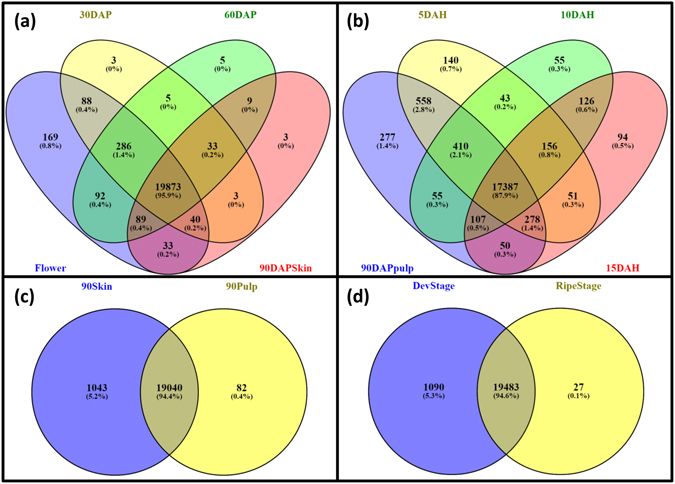
Venn diagrams representing common and distinct transcripts through various comparisons (a) Flower, 30 DAP, 60 DAP and 90 DAP skin; (b) 90 DAP pulp, 5 DAH, 10 DAH and 15 DAH; (c) 90 DAP pulp and 90 DAP skin and (d) fruit developing and ripening stages.
Table 4.
Distinct transcripts.
| Comparison | Stage/s | No. of unique transcripts |
|---|---|---|
| 30DAP vs Flower | Flower | 383 |
| 30DAP | 44 | |
| 60DAP vs 30DAP | 30DAP | 134 |
| 60DAP | 195 | |
| 90DAP pulp vs 60DAP | 60DAP | 1306 |
| 90DAP pulp | 36 | |
| 90DAPskin vs 60DAP | 60DAP | 388 |
| 90DAP skin | 79 | |
| 90DAP skin vs 90DAP pulp | 90DAP pulp | 82 |
| 90DAP skin | 1043 | |
| 5DAH vs 90DAP pulp | 90DAP pulp | 489 |
| 5DAH | 390 | |
| 10DAH vs 5DAH | 5DAH | 1027 |
| 10DAH | 343 | |
| 15DAH vs 10DAH | 10DAH | 563 |
| 15DAH | 473 | |
| Devlopment vs Ripening | Development | 1090 |
| Ripening | 27 |
Similarly, distinct transcripts specific to fruit developing and ripening stages were identified, wherein 1,090 and 27 transcripts were idiosyncratic to the fruit developing and ripening stages, respectively (Supplementary Table ST2). Various auxin and gibberellin induced and regulated proteins as well as several proteins responsible for various vacuole activities, multiple disease resistance proteins and various terpene synthases were distinct to the developing stages. Transcripts encoding for multiple transcription and translation factors during Alphonso fruit development were also detected. Interestingly multiple ethylene responsive transcription factors along with the protein reversion-to-ethylene sensitivity were uniquely revealed in the developing stages. Whereas, NIN-like protein, respiratory burst oxidase homolog protein d-like, rhamnogalacturonate lyase b-like, lectin receptor kinase, gag protein and methionine Υ-lyase were exclusive to the Alphonso ripening stages. Similarly, WRKY transcription factor 43, b3 domain-containing val3 and ap2 ERF domain-containing transcription factors were uniquely identified from the ripening stages. Several hypothetical and uncharacterized proteins were also found to be Alphonso ripening specific and their characterization might help to reveal the ripening process in Alphonso.
Gene ontology (GO) enrichment
Fisher’s exact test was performed to understand over- and down-represented GOs (p-value ≤ 0.001) during the transition, which gave an overall picture of the Alphonso mango development and ripening (Fig. 3). During the flower to 30 DAP fruit transition certain GOs were over-expressed such as post-embryonic developmental and anatomical structure morphogenesis process, response to abiotic stimulus and various plastid and thylakoid processes. At the same time, hydrolysis of O-glycosyl compounds and UDP-glycosyltransferase activity along with the methyltransferase, sucrose metabolic and lipid biosynthetic activities coding GOs were down-represented. 30 DAP to 60 DAP transition described enriched GOs for starch and sucrose metabolic process, fatty acid, cellulose and vitamin biosynthetic processes, protein glycosylation, response to oxidative stress and heat along with HSP binding. During the same event cell differentiation, growth and cell death in addition to the anatomical structure morphogenesis, secondary metabolic process and response to biotic stimulus coding GOs were observed to be decreased. Comparison between 60 DAP fruit and 90 DAP pulp revealed over-represented GOs for cell differentiation and cell growth, response to biotic stimulus, secondary metabolic process, tropism and regulation of gene expression. While, starch and sucrose metabolic processes, O-glycosyl hydrolase UDP-glucosyltransferase activities, fatty acid biosynthesis and catabolic processes along with the lipid transport, various amino acid and terpenoid biosynthesis and cell wall biogenesis were down-represented. 90 DAP pulp and skin tissues showed over-expression of various ion, ADP and sequence-specific DNA binding activities along with the response to hormone, chemical and organic substances in the skin tissue; whereas only cytoplasm and cytoplasmic part related GOs were found to be down-expressed in the skin compared to that in the pulp at 90 DAP.
Figure 3.
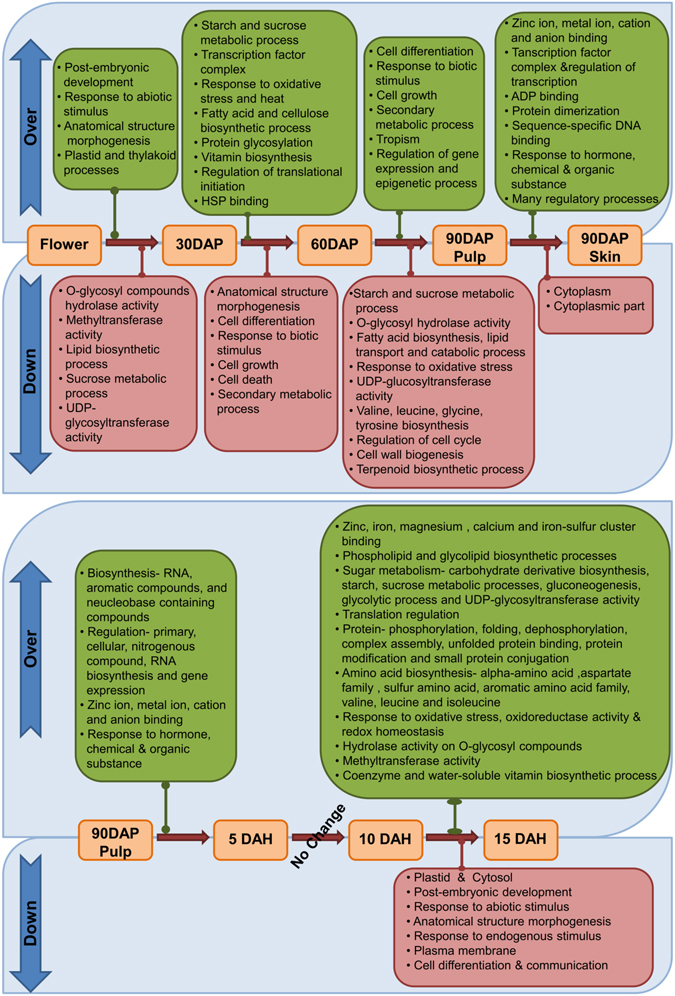
Over and down expressed gene ontologies (GO) between stages of development and ripening.
Transition of 90 DAP pulp to 5 DAH pulp revealed only over-representation of GOs such as biosynthesis of RNA, aromatic compounds, and nucleobase containing compounds; binding of various ions; regulation of primary, cellular, nitrogenous compounds, RNA biosynthesis processes and gene expression and response to hormone, chemical and organic substance. Surprisingly, none of the GOs showed significant (P-value ≤ 0.001) enrichment during the transition from 5 DAH to 10 DAH and reflected as the stationary phase of Alphonso mango ripening. The 10 DAH (mid ripe stage) to 15 DAH (ripe stage) transition showed over-expression of many GOs such as binding of various ions; phospholipid, glycolipid, amino acid, co-enzyme and water soluble vitamin biosynthetic processes; methyltransferase, UDP-glycosyltransferase and O-glycosyl hydrolase activities; starch, sucrose metabolic processes, gluconeogenesis and glycolytic process; protein phosphorylation, dephosphorylation, folding, protein modification and small protein conjugation along with the regulation and response to oxidative stress, oxidoreductase activity and redox homeostasis. While the GOs related to plastid and cytosol; post embryonic development; response to abiotic and endogenous stimulus; anatomical structure morphogenesis, plasma membrane, cell differentiation and communication were down-represented.
Spatial changes in transcriptome at 90 DAP
In case of Alphonso mango, 90 DAP stage is a mature raw stage of the fruit and is considered as the right stage of fruit harvest (0 DAH) for further artificial ripening of the fruit35. Hence transcriptome analysis of skin and pulp were separately carried out at this stage. Overall 90 DAP skin was found to be metabolically more active compared to the 90 DAP pulp with respect to differentially expressed genes (Supplementary Table ST1), unique genes (Supplementary Table ST2) and enriched GOs (Fig. 3). In the skin, 54 transcripts were up-regulated whereas only four were down-regulated compared to the pulp. Among the up-regulated transcripts (>2-fold), isoflavone reductase, transcription and translation regulatory proteins, hydrolases, methyltransferase etc. were more prominent; whereas four down-regulated transcripts were membrane and cytoplasm related GOs. Unique transcripts upon comparison between 90 DAP pulp and skin showed carotene and xanthophylls biosynthesis related contigs, beta-carotene hydroxylase (contig_5406) and anthocyanidin 3-o-glucosyltransferase, flavor related various terpene synthases and ripening related contigs such as ethylene-responsive transcription factors, pectate lyase, pectin esterase and cellulase as unique to skin compared to the pulp. Interestingly, in comparison of 5DAH stage with 90 DAP pulp few of these transcripts such as isoflavone reductase (contig_5337) and beta-carotene hydroxylase (contig_5406) were observed to be idiosyncratic to 5 DAH stage as seen in 90 DAP skin stage. Similarly, transcripts encoding enzymes involved in pectin degradation (contigs_9578, 9579, 18096 and 3603) were found to be upregulated (>2-fold) in the comparison between 10DAH vs 90 DAP pulp and 15 DAH vs 90 DAP pulp. These finding suggest progression of ripening related molecular processes in the pulp of 5 DAH and onward stages which were initiated at 90 DAP skin and highlight initiation of Alphonso ripening process from skin and its probable progress towards fruit stone.
Genes involved in the flavor biogenesis in Alphonso mango
Quantitatively mono-terpenes are abundant in Alphonso followed by sesqui-terpenes2, 35. The present data revealed six contigs encoding mono-terpene synthases (limonene synthase1, limonene synthase2, beta ocimine synthase1, beta ocimine synthase2, isoprene synthase1 and isoprene synthase2), five contigs encoding sesquiterpene synthases (germacreneD synthase1, germacreneD synthase2, nerolidol synthase1, nerolidol synthase2 and alpha farnesene synthase) and three contigs coding for di-terpene synthases (ent-kaurene synthase and casbene synthase (E,E)-geranillinalool synthase). Phylogenetic analysis (Fig. 4) of these genes along with other plant terpene synthases (TPS) showed distribution of these genes in to the TPS-a, TPS-b, TPS-e and TPS-f clades, respectively36.
Figure 4.
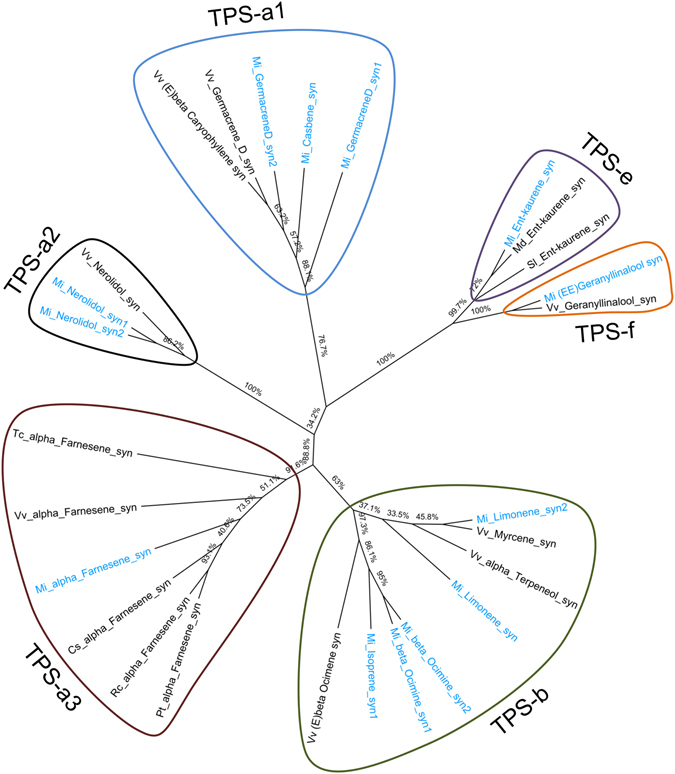
Cladogram representing phylogenetic analysis of proteins encoded by various terpene synthases identified in the present study (blue color) along with the terpene synthases from other Angiosperm plants (black color) using the neighbor-joining method. The node label is composed of two letters representing botanical name of the plant followed by name of the enzyme. Details of the plant species, enzyme and NCBI accession numbers in parenthesis are as follows Vitis vinifera_(E)-beta-caryophyllene synthase (ADR74192.1), Vitis vinifera_germacrene D synthase (ADR74198.1), Vitis vinifera_nerolidol synthase (ADR74211.1), Vitis vinifera_(E,E)-geranyl linalool synthase (ADR74219.1), Malus domestica_ent-kaurene synthase (AFG18184.1), Solanum lycopersicum_ent-kaurene synthase (AEP82778.1), Vitis vinifera_(E)-beta-ocimene synthase (ADR74204.1), Vitis vinifera_Alphaterpeneol synthase (ADR74202.1), Vitis vinifera_myrcene synthase (NP_001268009), Citrus sinensis_alpha-farnesene synthase (XP_006467948.1) Populus trichocarpa_alpha-farnesene synthase (XP_002317269.2), Ricinus communis_alpha-farnesene synthase (XP_015574261.1), Theobroma cacao_alpha-farnesene synthase (EOY28527.1) and Vitis vinifera alpha_farnesene synthase (NP_001268183.1).
Furaneol and mesifuran are the two furanones from Alphonso mango and their synthesis by enone oxidoreductase (EO) and O-methyltransferase (OMTS), respectively have been described earlier10, 11. Multiple contigs coding for quinone oxidoreductase and O-methyltransferases were detected in the present analysis. Phylogenetic analysis of these contigs with the characterized genes revealed another similar transcript variant for the MiEO (Supplementary Figure SF3), whereas none of the contigs showed similarity to the MiOMTS (Supplementary Figure SF4). Green grassy aroma of unripe fruits is due to the C6 volatiles formed during the lipoxygenase and hydroperoxide lyase (HPL) pathways. In the present study a single contig encoding the hydroperoxide lyase and six contigs encoding 13-lipoxygenase were detected. Involvement of 9-lipoxygenase (Mi9LOX) and epoxide hydrolase 2 (MiEH2) in the biogenesis of lactones from Alphonso mango was confirmed in our recent study15. One more transcript encoding 9-lipoxygenase similar to that of the characterized Mi9LOX (Supplementary Figure SF5) and three contigs coding for epoxide hydrolase 2 grouping with the MiEH2 (Supplementary Figure SF6) were additionally detected in the present study. Three more novel contigs coding for epoxide hydrolase were also detected but neither grouped with the other EH1or EH2 from different plant species (Supplementary Figure SF6).
We further analyzed the differential expression of all these flavor related genes in terms of transcript abundance in flower and fruit developing and ripening stages (Supplementary Figure SF7). Among these the contigs encoding various TPS were abundant in flower and during early developing stages. Interestingly, many contigs encoding EH (contigs 8280, 3904, 3901, 14123 and 8281), LOX (contigs 18105, 12748, 12747 and 12385) and EO (contigs 8026, 5618, 15594, 14137 and 13600) were found to be ripening specific and might be playing crucial role in generating unique aroma volatiles during Alphonso fruit ripening.
Glycosidases and cell wall degrading enzymes from Alphonso mango
Glycosidases are involved in a variety of functions such as hydrolysis of complex carbohydrates (storage and structural) to mono-saccharides, removal of sugars from various glycans including glycosidically bound aroma volatiles, which serve as storage pool for the aroma compounds. In the present study, many glycosidases acting on various sugars i.e. glucose, galactose, mannose, fructose, xylose, fucose and rhamnose, were detected. Among these, class glucosidase with the highest number of contigs (51 contigs) was observed to contain 28 and 21contigs coding for glucan β-glucosidase and general β-glucosidase, respectively. Two contigs coding for α-glucosidases were identified of which one coded for glucan α-glucosidase and the other for general α-glucosidase. Among these, at 30 DAP stage contig_7442 and contig_7857 were found to be down-regulated (>3-fold) compared to those in flower stage. Contig_16888 was down-regulated whereas contig_17138 was up-regulated at 10 DAH than those at 5 DAH. At 15 DAH contig_9072 was down-regulated (1.5-fold) compared to that at 10 DAH. Among the galactosidase class, nine contigs encoding α-galactosidase and 21 contigs encoding β-galactosidase were detected. Two of these were down-regulated (contig_1095 and contig_1096) at 30 DAP compared to those in flower. Contig_3844 was down regulated in 90 DAP pulp compared to 60 DAP.
Transition from 90 DAP to 5 DAH reflected in to up-regulation of contig_3844 (2.72-fold) whereas, contig_1525 coding for α-galactosidase was down-regulated in 10 DAH compared to that at 5 DAH. In the mannosidase class, five α-mannosidase and eight endo-β-mannosidase coding contigs were identified out of which two encoding for endo-beta-mannosidase (contig_15554 and contig_15558) were down-regulated at 10 DAH compared to 5 DAH, rest didn’t show differential regulation. Among two α-xylosidase and five β-xylosidase from Alphonso mango only contig_1633 showed differential regulation which was up-regulated at 60 DAP compared to 30 DAP and was further down-regulated in both the 90 DAP tissues. Two transcripts coding for the acid beta-fructofuranosidase (contig_12501 and contig_12502) were detected but did not show any differential regulation in various tissues analyzed. Also, seven contigs coding for the alpha-l-fucosidase were identified from Alphonso mango but did not show differential regulation.
Degradation of plant cell wall components, namely cellulose, hemi-cellulose and pectin by cellulases and glucanases in ripening fruits is responsible for the fruit softness. Cellulases encoding five contigs were identified among which one coded for acidic cellulase and found to be abundant during flower and early fruit developing stages. Total 18 contigs encoding glucanase were detected of which contig_4148 was up-regulated in flower compared to 30 DAP, whereas, four transcripts (contig_9268, contig_19283, contig_9267 and contig_17145) were down-regulated (>2-fold) at 10 DAH compared to 5 DAH stage. Pectin is another component of fruit cell wall and is degraded by a set of enzymes viz. pectate lyase (PL), pectin esterase (PE), polygalacturonase (PG) and rhamnogalacturonate lyase. In the present study 18 PL, 24 PG and 10 PE coding transcripts were detected. However, only few were differentially expressed, for example, only PL contig_7696 was down-regulated in 30 DAP fruit compared to flower and PL contig_9578 was up-regulated in 10 DAH fruit than 5 DAH fruit. PG non-catalytic subunit jp650 coding contig_9895 was down-regulated in 5 DAH pulp than in 90 DAP pulp, whereas PG contig_3471 was down regulated and PG contig_1614 was up-regulated in 10 DAH compared to 5 DAH stage. Likewise, PE contig_7997 was down-regulated and contig_9162 was up-regulated at 30 DAP stage compared to flower. Similarly, eight transcripts encoding rhamnogalacturonate lyase were detected of which two (contig_7745 and contig_7746) were distinct to the ripening stages (Supplementary Table ST2).
Transcriptome analysis identified novel enzyme inhibitors from Alphonso mango
We identified various classes of enzyme inhibitors (Supplementary Table ST3) such as α- amylase inhibitor (2 contigs), inhibitor of proliferation pds5, apoptosis inhibitor (2 contigs), bax inhibitor (4 contigs), lipid transfer protein inhibitor (6 contigs), various kinase inhibitors (16 contigs), cysteine proteinases inhibitor (4 contigs), inter-alpha-trypsin inhibitor (3 contigs), serine protease inhibitor, kunitz family trypsin and protease inhibitor, guanosine nucleotide diphosphate dissociation inhibitor, nf-kappa-b inhibitor (2 contigs), pectinesterase inhibitor (12 contigs), polygalacturonase inhibitor, proteasome inhibitor, protein transport inhibitor (4 contigs), protein phosphatase inhibitor and rho gdp-dissociation protein inhibitor (4 contigs). Along with these, contigs coding for protein reversion-to-ethylene sensitivity (3 contigs), cell wall and vascular inhibitor of beta-fructosidase (2 contigs) and macrophage migration inhibitory factor were also identified from Alphonso transcriptome. These inhibitors showed differential regulation during fruit development and ripening (Supplementary Figure SF8). Most of the inhibitors were found to be expressing throughout all the stages except for the group 4 (coding for bax inhibitor), which were abundant only during fruit ripening stages of Alphonso mango and probably played important role in ripening physiology of Alphonso mango.
Transcriptome validation through qRT PCR
Results of the transcriptomic analysis were validated by qRT PCR of 38 representative genes from various metabolic pathways such as carbohydrate metabolism (cellulose synthase: CS, chitinase: CTN, and pectate lyase: PL), fatty acid metabolism (omega 3 fatty acyl desaturase: O3FAD, omega 6 fatty acyl desaturase: O6FAD, glyceraldehyde-3-phosphate acyl transferase: G3PAT, alcohol dehydrogenase: ADH and long chain fatty acyl CoA ligase: LCFACL), terpene metabolism (mono-terpene synthases: MTPS, sesqui-terpene synthases: STPS and di-terpene synthases: DTPS) and proteins such as ethylene responsive factors: ERF and disease resistance proteins: DRP. Various transcript variants of these genes were selected wherever available to confirm the accuracy of assembly. qRT PCR analysis revealed similar differential expression pattern for almost all the transcripts through all the eight stages with correlation coefficient R ranging between 0.8 and 0.99. Few transcripts showed variation in the fold change of RNAseq and qRT PCR data at few stages but still had good correlation (R ≥ 0.7) (Figs 5–9 and Supplementary Table ST5). Transcript variants confirmed the accurate assembly and showed differential expression of these variants from each other through various tissues analyzed (Figs 5–9).
Figure 6.
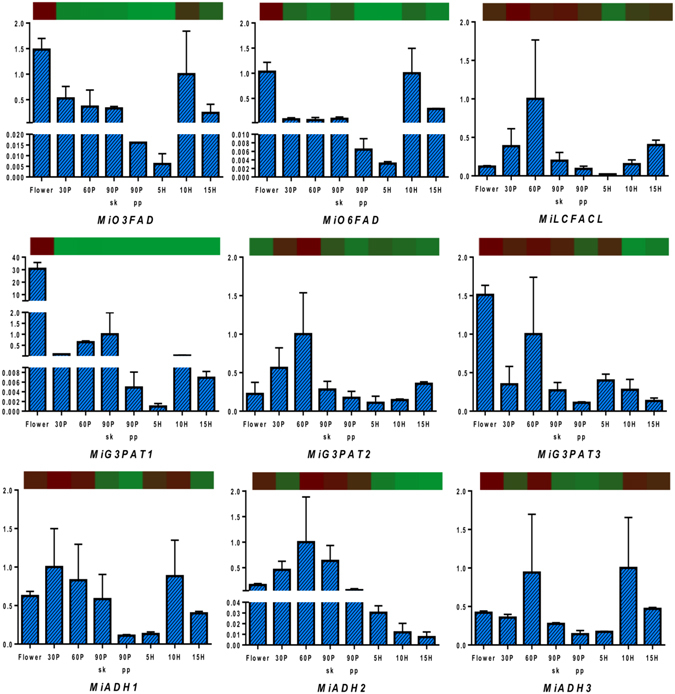
Quantitative reverse-transcriptase PCR validation of various transcripts obtained through RNAseq from lipid metabolism through various tissues (flower and fruit developing and ripening stages). Vertical bars at each data point represent standard error in the relative quantification among the three biological replicates. X-axis represents fruit development and ripening stages and Y-axis represents relative transcript abundance. The horizontal bar above each histogram represents the expression level of the same transcript as obtained through RNAseq analysis, wherein dark-red color indicates higher expression and light-green color indicates lower expression. Gene names are as referred in result section “Transcriptome validation through qRT PCR”.
Figure 7.
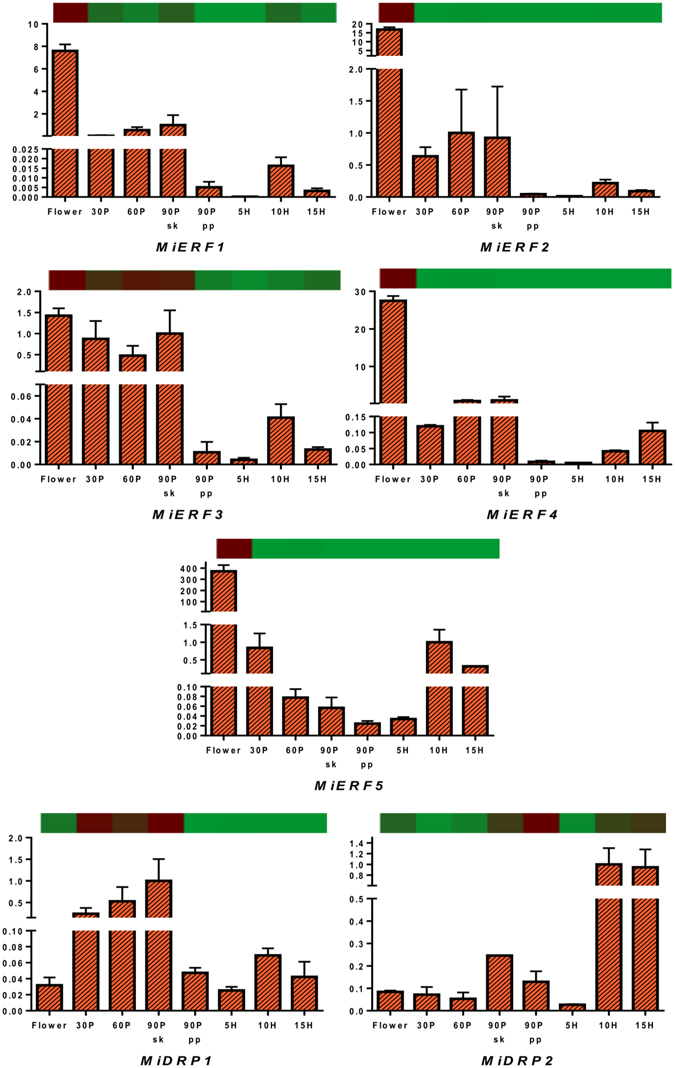
Quantitative reverse-transcriptase PCR validation of various transcripts obtained through RNAseq from ethylene responsive factors (ERF) and disease resistance proteins (DRP) through various tissues (flower and fruit developing and ripening stages). Vertical bars at each data point represent standard error in the relative quantification among the three biological replicates. X-axis represents fruit development and ripening stages and Y-axis represents relative transcript abundance. The horizontal bar above each histogram represents the expression level of the same transcript as obtained through RNAseq analysis, wherein dark-red color indicates higher expression and light-green color indicates lower expression.
Figure 5.
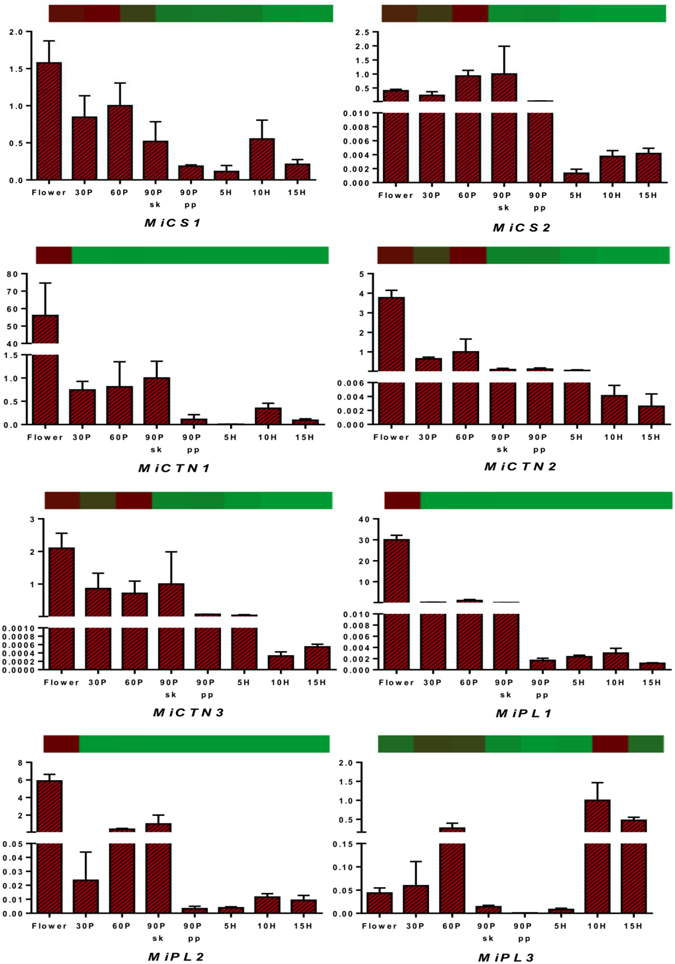
Quantitative reverse-transcriptase PCR validation of various transcripts obtained through RNAseq from carbohydrate metabolism through various tissues (flower and fruit developing and ripening stages). Vertical bars at each data point represent standard error in the relative quantification among the three biological replicates. X-axis represents fruit development and ripening stages and Y-axis represents relative transcript abundance. The horizontal bar above each histogram represents the expression level of the same transcript as obtained through RNAseq analysis, wherein dark-red color indicates higher expression and light-green color indicates lower expression. Gene names are as referred in result section “Transcriptome validation through qRT PCR”.
Figure 9.
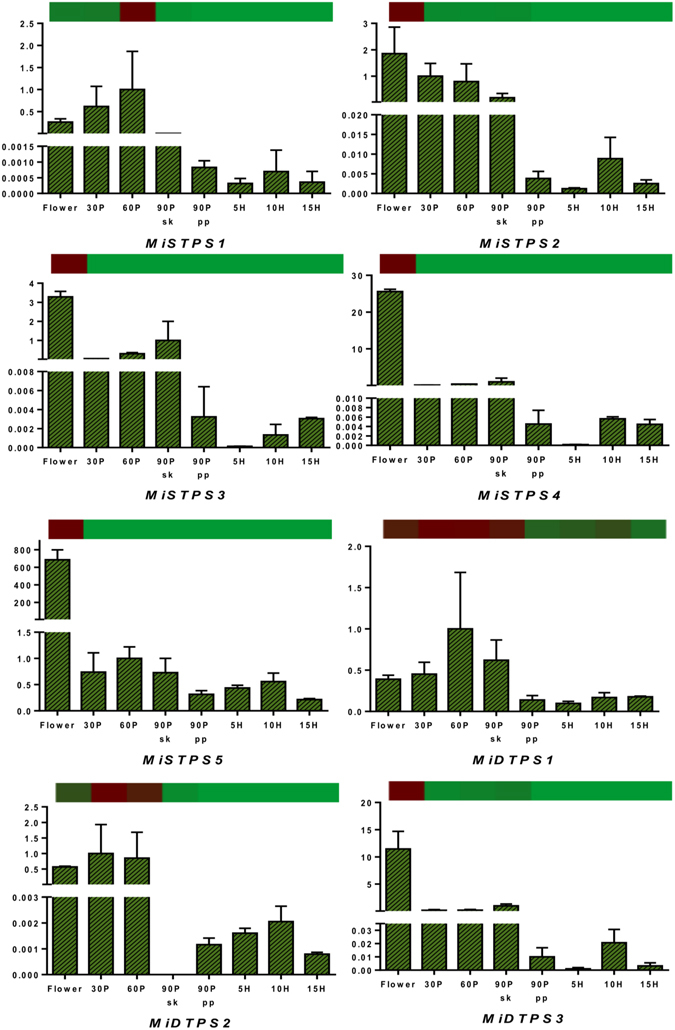
Quantitative reverse-transcriptase PCR validation of various transcripts obtained through RNAseq from sesqui-terpene and di-terpene metabolism through various tissues (flower and fruit developing and ripening stages). Vertical bars at each data point represent standard error in the relative quantification among the three biological replicates. X-axis represents fruit development and ripening stages and Y-axis represents relative transcript abundance. The horizontal bar above each histogram represents the expression level of the same transcript as obtained through RNAseq analysis, wherein dark-red color indicates higher expression and light-green color indicates lower expression. Gene names are as referred in result section “Transcriptome validation through qRT PCR”.
Discussion
Recently transcriptome studies on mango cultivars namely, Zill25, Langra26, Kent27 and Dashehari28 have put forth important information regarding the fruit and leaf physiology of mango. These studies have identified genes encoding multiple enzymes involved in various pathways of primary and secondary metabolism such as, citrate cycle, glycolysis and gluconeogenesis from carbohydrate metabolism; fatty acid biosynthesis, beta oxidation and salicylic acid biosynthesis from fatty acid metabolism; biosynthesis and degradation of various amino acids as well as ethylene biosynthesis from methionine. Genes involved in the flavonoid biosynthesis, vitamin biosynthesis (β-carotene and α-tocopherols) as well as terpenoid backbone synthesis (mevalonate pathway) have also been well explored. In the present study genes involved in all these pathways were identified and their differential expression was also evident through various stages of the Alphonso mango fruit development and ripening (Supplementary Table ST1). In addition the present study revealed some novel findings highlighting better understanding of various processes involved in mango fruit development and ripening and some were unique to the most favoured Alphonso mango fruit, which are discussed below.
Quantitative abundance of terpenes in mangos is well known2, 35, Transcriptome and gene expression studies in mango have explored the terpene biosynthesis pathway till GPP, FPP and GGPP synthesis9, 25–28. In this study, we identified six, five and three genes encoding mono-terpene synthases (MTPS), sesqui- terpene synthases (STPS) and di-terpene synthases (DTPS), respectively that are involved in biosynthesis of specific terpene molecules (Supplementary Figure SF9). These genes were abundant in the flower tissue followed by 30 DAP stage. Further, the transcript abundance of many of these terpene synthase genes in the present study has been depicted to be idiosyncratic to the developing stages, leading to their least expression in the ripening stages of Alphonso fruit (Figs 8 and 9, Supplementary Figure SF7 and Supplementary Table ST2). Previous aroma volatile analysis from Alphonso mango supports this observation wherein flower had the highest concentration of mono-terpenes, oxygenated mono-terpenes and sesqui-terpenes which decreased through the fruit development35.
Figure 8.
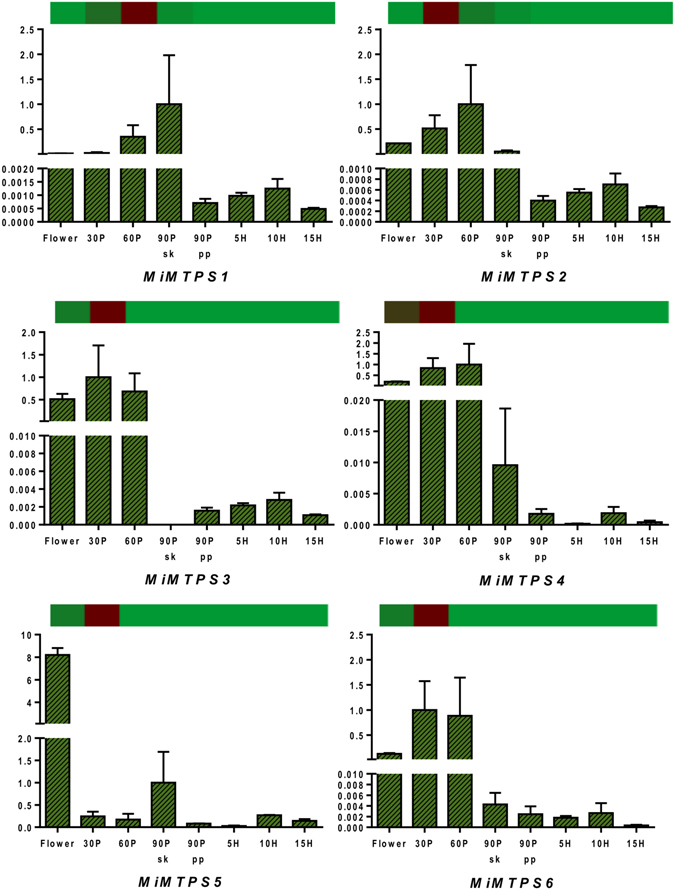
Quantitative reverse-transcriptase PCR validation of various transcripts obtained through RNAseq from mono-terpene metabolism through various tissues (flower and fruit developing and ripening stages). Vertical bars at each data point represent standard error in the relative quantification among the three biological replicates. X-axis represents fruit development and ripening stages and Y-axis represents relative transcript abundance. The horizontal bar above each histogram represents the expression level of the same transcript as obtained through RNAseq analysis, wherein dark-red color indicates higher expression and light-green color indicates lower expression. Gene names are as referred in result section “Transcriptome validation through qRT PCR”.
Another flavor related pathway is lipoxygenase (LOX) followed by HPL pathway37–39, which produces C6 GLVs and lactones through peroxygenase pathway15. The transcriptomes analyzed from Kent and Dashehari mangos reported the presence of six and five genes coding for the LOX family, respectively27, 28. Here, we report detailed annotation of Alphonso mango LOX genes wherein, two genes encode the 9-LOX and six genes encode the 13-LOX. Likewise, Peroxygenase and epoxide hydrolase (EH) genes have been well-studied for biosynthesis of cutin biopolymer40 and defense related compounds41, 42; while our recent study has shown involvement of these genes in the production of lactones15. In spite of their biological significance, none of the previous transcriptome studies on mango could determine the presence of peroxygenase and epoxide hydrolase genes. On the other hand in the current study various contigs encoding novel EH (three contigs), EH2 (four contigs) and peroxygenase (three contigs) were detected. Similarly, multiple transcripts encoding enone oxidoreductase and O-methyltransferase having role in furanone biosynthesis10, 11 were also identified and expression profiles of many of them were shown to be ripening specific (Supplementary Figure SF7). Abundance and ripening related expression of large number of these unique flavor related genes in Alphonso mango (Supplementary Figure SF7) signifies their role in synthesis of diverse aroma volatiles and their unique blend giving sweet and fruity flavor in Alphonso as shown by our previous studies34, 35.
Fruit ripening is a complex physiological process and can be characterized by means of fruit softening due to changes in the cell wall structure43–45, increased sugar content by polysaccharide hydrolysis16 and changes in the aroma volatiles35. Starch and pectin are the major storage and structural polysaccharides in the mango fruit, respectively. Various hydrolases and lyases are known to carry out polysaccharide and cell wall hydrolysis43, 46–50, while amylases degrade the starch in to soluble sugars during ripening. We identified four α-amylase, three isoamylase and 13 β-amylase coding transcripts. Only one transcript coding for α-amylase (contig_1439) was down-regulated through flower to 30 DAP fruit transition while others were expressed throughout the fruit developing and ripening stages. On the other hand, transcriptome analysis of Kent mango revealed identification of four β-amylase and three α-amylase transcripts out of which only two β-amylase coding transcripts were found to be up-regulated in ripe tissue, none of the other showed differential expression27.
In addition, we also detected large number of PL, PG and PE encoding transcripts known to be responsible for degradation of complex hetero-polysaccharide, pectin48 were detected (Supplementary Table ST4). Most of these had stable expression and only few were differentially expressed in Alphonso mango. These results are in contrast to the observations from Kent27 and Dashehari28 mango transcriptomic data in terms of the number of unigenes detected and their differential regulation. In case of Dashehari mango four PL and none of the PE or PG encoding transcripts were up-regulated; whereas in Kent, four PL, six PE and six PG encoding unigenes were up-regulated. These results signify controlled and steady activity of pectin degradation leading to slow and balanced transitions during Alphonso fruit ripening and this might be one of the reasons for its longer shelf life.
Another interesting observation in our study was, the identification of 79 contigs encoding 20 different inhibitor classes from Alphonso mango (Supplementary Figure SF8). Previously, only three unigenes coding for the cysteine proteinase inhibitors were reported from Langra leaf transcriptome, while no such inhibitors were reported from Zill25, Kent27 and Dashehari28 mango transcriptomes. The present study suggests Alphonso mango transcriptome to be rich in these inhibitors throughout the fruit development and ripening stages.
Thus, the presence of large numbers of amylase, PL, PE and PG transcripts with very few of them differentially regulated, perpetual expression of most of the starch and cell wall hydrolyzing enzymes along with the persistent presence of inhibitors for amylase, pectinesterase, polygalacturonase and ethylene sensitivity can be cumulatively suggested to play a crucial role in controlled and slow ripening and longer fruit shelf life of Alphonso mango. As a representative example the balance between pectinesterases and their inhibitors during Alphonso fruit development and ripening has been demonstrated in Fig. 10 as heatmap and area chart of expression of PE and PEI. We further observed that phosphate metabolism related gene ontologies were enriched at complete ripe stage (15 DAH) of Alphonso mango. Among these some transcripts were uniquely found at 15 DAH stage (Supplementary Table ST2) suggesting accelerated primary metabolism. Moreover, contig 6946 encoding cytokinin riboside 5 -monophosphate phosphoribohydrolase was uniquely observed at 15 DAH stage. This enzyme plays important role in converting endogenous inactive cytokinin nucleotides to the biologically active free cytokinin responsible for delayed ripening51, 52. On the other hand contig_6770 encoding phospholipase-D (PLD) involved in degradation of important cell membrane component i.e. phospholipids was observed to be upregulated (3.4fold). A key role of PLD in softening was well explained in tomato plants transformed with antisense PLD cDNA which showed delayed ripening and increased firmness in tomato fruits53. This counter play at molecular level might be responsible for fine tuning of ripening process in Alphonso mango providing longer shelf life to the fruits.
Figure 10.
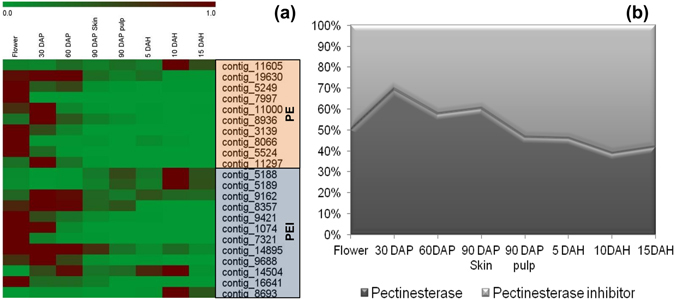
(a) Heatmap representing expression profiles of contigs encoding pectinesterase (PE) and pectinesterase inhibitor (PEI) from RNAseq data. (b) Representation of percent co-expression (Y-axis) of 10 contigs encoding pectinesterase and 12 contigs encoding pectinesterase inhibitor, respectively by calculating sum of their mapped raw reads in various tissues of Alphonso mango (X-axis).
Additionally oxidative burst, oxidoreductase activities and oxidative stress related gene ontologies were observed during ripening. These factors can generate reactive oxygen species and lead to cell death and fruit damage. Such reactive oxygen species induced cell death is suppressed by Bax inhibitor, which was well studied in Arabidopsis thaliana 54. Interestingly, four contigs coding for Bax inhibitor in Alphonso mango showed ripening specific expression probably responsible for preventing cell death in ripening fruits and thus longer shelf life. Further detailed study on these inhibitors might help to understand jelly formation in Dashehari mangos due to excessive ripening and spongy tissue formation in Alphonso mangos due to uneven ripening55, 56.
It is known that ripened fruits are prone to attack by various pathogens57. A well distinct defense mechanism was observed in Alphonso mango wherein various defense related proteins (227 contigs) and chitinases (19 contigs) acting on fungal cell wall58 were differentially regulated (Supplementary Table ST1). Chitinases were found to be accumulated in the flower and in the early fruit developing stages. Insect driven pollination has the risk of fungal infection to flower and further spore accumulation around ovary causing internal infection to the fruit. This might be restricted by the presence of various chitinases in Alphonso mango. Similarly, various disease resistance proteins might play role during fruit development and ripening process to defend infections.
Conclusions
The transcriptome of Alphonso mango analyzed through eight stages of flower to fruit development and ripening transitions revealed various differentially regulated and stage specific genes. Unique transcript profiles probably responsible for distinct and favorable characteristics of Alphonso mango fruit such as flavor, color, ripening duration, skin to stone ripening pattern and longer shelf life were identified and analyzed. This study provides large data sets for further functional validation of fruit ripening process.
Methods
Plant material
Flower and fruits of cv. Alphonso were collected from three independent trees as biological replicates from the Mango Research Sub Centre, Deogad (16.528336 N, 73.344790 E) affiliated to Dr. Balasaheb Sawant Konkan Agricultural University, Dapoli, Maharashtra, India. Flowers from inflorescence were collected and snap frozen. Fruits from developing stages were collected at 30, 60 and 90 days after pollination (DAP). Fruits from 30 and 60 DAP were analyzed as whole fruit in the present study after removing fruit stone; whereas at mature raw stage (90 DAP) pulp (mesocarp) and skin (exocarp) were separated, snap frozen in liquid nitrogen and stored at −80 °C until further analysis. A set of fruits were additionally harvested at their mature raw stage and kept in the hay containing boxes at ambient temperature for ripening and only pulp tissue for ripening stages as table green, mid ripe and ripe were collected at 5, 10 and 15 days after harvest (DAH), respectively. At each ripening stage fruits were removed from the box, pulp and skin were separated and pulp was frozen in liquid nitrogen and stored at −80 °C till further use.
RNA isolation and cDNA synthesis
Total RNA isolation was carried out for all the tissues sampled for current study using RNeasy Plus mini kit (Quiagen, Hilden, Germany). RNA quality as 260 nm/ 280 nm ratio was evaluated using Nanodrop 1000 (Thermo Fisher Scientific, Waltham, Massachusetts, USA) and RNA integrity was checked using Bioanalyzer 2100 (Agilent Technologies, Santa Clara, USA). Two microgram of total RNA was used to carry out reverse transcription for synthesis of cDNA using High Capacity cDNA reverse transcription kit (Applied Biosystem, Carlsbad, CA, USA).
Library preparation and sequencing
High quality RNAs from seven progressive stages of fruit development and ripening as well as flower tissue from single representative biological replicate were sent to the Next Generation Genomics Facility (NGGF) at the Centre for Cellular and Molecular Platforms (C-CAMP), Bangalore for performing transcriptome sequencing. Briefly, 1 ug of total RNA from each sample was used to prepare eight individual libraries and mRNA was purified using polyT oligo beads. The purified mRNA was fragmented in the range of 100 to 140 bases with optimum at around 120 bases and the cDNA was synthesized. End repair, A-Tailing, Adapter ligation and the library preparation were performed using Tru Seq RNA sample preparation kit v2 (Illumina, San Diego, USA) as per manufacturer’s instructions. PCR enrichment was performed for 15 cycles and the sample was validated on the Bioanalyzer 2100. Libraries were sequenced in a Paired End 100 base run, using TruSeq SBS Kit v3-HS (Catalog No.: FC-401-3001) for sequencing on the Illumina HiSeq. 1000 platform according to the manufacturer’s recommended protocols. (http://www.illumina.com/systems/hiseq_systems/hiseq_2000_1000/kits.ilmn).
Bioinformatics data analysis
Paired end RNA sequencing was performed using Illumina Hiseq2000. Quality check on raw data was performed using FastQC (http://www.bioinformatics.babraham.ac.uk/projects/fastqc/). Adapter free, good quality reads (Q >= 30; min read length = 85) were obtained using Cutadapt59. Alphonso transcriptome for each stage was assembled using Velvet-Oases60 with K-mers 67, 75, 83 and merging them at 27 k-mer. Additionally, a merged transcriptome was also generated using k-mer 55. Further, for all the merged assembled transcripts, we used Transdecoder (https://transdecoder.github.io/) to extract potential candidate coding regions within transcripts. Partial cds were discarded and only those transcripts with start and stop codon were made non redundant based upon sequence identity cut-off of 90% using CD-HIT-est61 and used for downstream analyses.
Further, merged full length transcripts (from merged assembly) were used as reference to map back all the raw reads from each stage using default parameters of Bowtie62. DESeq2 was used to identify differentially expressed transcripts63 and were filtered based upon p-value ≤ 0.05 and expression value >0. All those transcripts having mapping count zero were excluded from further analysis such as in identification of uniquely expressed transcripts in a particular stage or a specific set of stages (e.g. developing and ripening stages). Unique and common list of transcripts were represented using Venny (http://bioinfogp.cnb.csic.es/tools/venny/) and provided in Supplementary Table ST2. Full length transcripts (from merged assembly) were used as reference for differential expression analysis using DESeq263.
Annotation, enzyme code distribution and GO mapping and InterProScan analyses were carried using BLAST2GO 3.1.3 workbench (Biobam Bioinformatics S.L., Valencia, Spain) as described in the user manual64. GO enrichment analysis was carried out in given test and reference sets by Fisher’s exact test in BLAST2GO with p-value (0.001) and FDR filters.
Quantitative reverse-transcriptase PCR
Quantitative reverse-transcriptase PCR was performed using the Fast Start Universal SYBR Green master mix (Roche Inc. Indianapolis, Indiana, USA) and elongation factor 1α (EF1α) as an endogenous reference gene employing the primers reported earlier7. Various transcripts selected from transcriptome data were amplified using gene specific primers (Supplementary Table ST5) and quantification was performed using 7900HT Fast Real-Time PCR System (Applied Biosystems, California, USA) having thermal cycle program of initial denaturation at 95 °C for 10 min with subsequent 40 cycles of 95 °C for 3 sec and 60 °C for 30 sec followed by a dissociation curve analysis of transcripts. Relative quantification (ΔΔCT method) and statistical analysis was carried out using DataAssist™ v3.01 software (Applied Biosystems, California, USA). Eight tissue samples as described above from three independent biological replicates were used for this analysis. For individual transcript the highest expression at a particular fruit development or ripening stage was considered as 1 and expression in other tissues including flower was normalized to that for better graphical presentation.
Data availability
The raw data files generated during the current study will be available in the NCBI repository under the BioProject - PRJNA391381.
Electronic supplementary material
Acknowledgements
The authors would like to thank Dr. Aarti Desai for helpful discussion and Dr. Abhay Jere (Persistent Systems Ltd., Pune, India) for his critical suggestions, guidance and support. The authors acknowledge the Next Generation Genomics Facility (NGGF) at the Centre for Cellular and Molecular Platforms (C-CAMP), Bangalore (Project ID: BT/PR3481/INF/22/140/2011) for performing transcriptome sequencing of the eight mango tissues. Authors would like to thank Dr. Sanjiv Galande, Dr. Ram Kulkarni and Mr. Saurabh Pradhan (Indian Institute of Science Education and Research, Pune, India) for their help in evaluation of RNA quality by Bioanalyzer 2100. This research was funded by the Council of Scientific and Industrial Research, New Delhi, India under the project CSC0133 (FUNHEALTH) to CSIR-NCL and 21(0997)/16/EMR-II grant as Emeritus Scientist scheme to VSG.
Author Contributions
A.B.D. designed, standardized and performed majority of the experiments, analyzed the data and wrote the manuscript. K.A. and V.Z. carried out bioinformatics analysis. H.G.C. and P.S.O. helped with high quality RNA isolation, cDNA synthesis and qRT PCR studies. K.H.P. contributed by providing the experimental tissue. A.P.G. contributed with suggestions for the work and for manuscript planning, while NYK contributed in bioinformatic analysis and manuscript writing. V.S.G. designed the study, participated in all parts of the work and contributed to the preparation of the manuscript. All authors read and approved the final manuscript.
Competing Interests
The authors declare that they have no competing interests.
Footnotes
Electronic supplementary material
Supplementary information accompanies this paper at doi:10.1038/s41598-017-08499-5
Publisher's note: Springer Nature remains neutral with regard to jurisdictional claims in published maps and institutional affiliations.
References
- 1.Gil AM, et al. Study of the compositional changes of mango during ripening by use of nuclear magnetic resonance spectroscopy. Journal of Agricultural and Food Chemistry. 2000;48:1524. doi: 10.1021/jf9911287. [DOI] [PubMed] [Google Scholar]
- 2.Pandit SS, et al. Cultivar relationships in mango based on fruit volatile profiles. Food Chemistry. 2009;114:363. doi: 10.1016/j.foodchem.2008.09.107. [DOI] [Google Scholar]
- 3.Deshpande AB, et al. Data on changes in the fatty acid composition during fruit development and ripening of three mango cultivars (Alphonso, Pairi and Kent) varying in lactone content. Data in Brief. 2016;9:480. doi: 10.1016/j.dib.2016.09.018. [DOI] [PMC free article] [PubMed] [Google Scholar]
- 4.de Magalhães Andrade J, et al. 2D-DIGE analysis of mango (Mangifera indica L.) fruit reveals major proteomic changes associated with ripening. Journal of proteomics. 2012;75:3331. doi: 10.1016/j.jprot.2012.03.047. [DOI] [PubMed] [Google Scholar]
- 5.Fasoli E, Righetti PG. The peel and pulp of mango fruit: A proteomic samba. Biochimica et Biophysica Acta (BBA)-Proteins and Proteomics. 2013;1834:2539. doi: 10.1016/j.bbapap.2013.09.004. [DOI] [PubMed] [Google Scholar]
- 6.Renuse S, et al. Proteomic analysis of an unsequenced plant-Mangifera indica. Journal of proteomics. 2012;75:5793. doi: 10.1016/j.jprot.2012.08.003. [DOI] [PubMed] [Google Scholar]
- 7.Pandit SS, et al. Expression profiling of various genes during the fruit development and ripening of mango. Plant Physiology and Biochemistry. 2010;48:426. doi: 10.1016/j.plaphy.2010.02.012. [DOI] [PubMed] [Google Scholar]
- 8.Pandit SS, et al. Genetic diversity analysis of mango cultivars using inter simple sequence repeat markers. Current science. 2007;93:1135. [Google Scholar]
- 9.Kulkarni R, et al. Characterization of three novel isoprenyl diphosphate synthases from the terpenoid rich mango fruit. Plant physiology and biochemistry. 2013;71:121. doi: 10.1016/j.plaphy.2013.07.006. [DOI] [PubMed] [Google Scholar]
- 10.Kulkarni R, et al. An oxidoreductase from ‘Alphonso’mango catalyzing biosynthesis of furaneol and reduction of reactive carbonyls. SpringerPlus. 2013;2:494. doi: 10.1186/2193-1801-2-494. [DOI] [PMC free article] [PubMed] [Google Scholar]
- 11.Chidley HG, et al. Molecular cloning and characterization of o-methyltransferase from mango fruit (Mangifera indica cv. Alphonso) Molecular Biotechnology. 2016;58:340. doi: 10.1007/s12033-016-9933-2. [DOI] [PubMed] [Google Scholar]
- 12.Martínez PG, Gómez RL, Gómez-Lim MA. Identification of an ETR1-homologue from mango fruit expressing during fruit ripening and wounding. Journal of Plant Physiology. 2001;158:101. doi: 10.1078/0176-1617-00238. [DOI] [Google Scholar]
- 13.Sane VA, Chourasia A, Nath P. Softening in mango (Mangifera indica cv. Dashehari) is correlated with the expression of an early ethylene responsive, ripening related expansin gene, MiExpA1. Postharvest biology and technology. 2005;38:223. doi: 10.1016/j.postharvbio.2005.07.008. [DOI] [Google Scholar]
- 14.Singh RK, Ali SA, Nath P, Sane VA. Activation of ethylene-responsive p-hydroxyphenylpyruvate dioxygenase leads to increased tocopherol levels during ripening in mango. Journal of experimental botany. 2011;62:3375. doi: 10.1093/jxb/err006. [DOI] [PMC free article] [PubMed] [Google Scholar]
- 15.Deshpande AB, et al. Isolation and characterization of 9-lipoxygenase and epoxide hydrolase 2 genes: Insight into lactone biosynthesis in mango fruit (Mangifera indica L.) Phytochemistry. 2017;138:65. doi: 10.1016/j.phytochem.2017.03.002. [DOI] [PubMed] [Google Scholar]
- 16.Chidley HG, et al. Effect of postharvest ethylene treatment on sugar content, glycosidase activity and its gene expression in mango fruit. Journal of the Science of Food and Agriculture. 2016;97:1624. doi: 10.1002/jsfa.7912. [DOI] [PubMed] [Google Scholar]
- 17.Chidley HG, Kulkarni RS, Pujari KH, Giri AP, Gupta VS. Spatial and temporal changes in the volatile profile of Alphonso mango upon exogenous ethylene treatment. Food Chemistry. 2013;136:585. doi: 10.1016/j.foodchem.2012.08.029. [DOI] [PubMed] [Google Scholar]
- 18.González-Aguilar G, Zavaleta-Gatica R, Tiznado-Hernández M. Improving postharvest quality of mango ‘Haden’by UV-C treatment. Postharvest Biology and Technology. 2007;45:108. doi: 10.1016/j.postharvbio.2007.01.012. [DOI] [Google Scholar]
- 19.Hofman PJ, Smith LG, Joyce DC, Johnson GI, Meiburg GF. Bagging of mango (Mangifera indica cv.Keitt’) fruit influences fruit quality and mineral composition. Postharvest Biology and Technology. 1997;12:83. doi: 10.1016/S0925-5214(97)00039-2. [DOI] [Google Scholar]
- 20.Jiang Y, Joyce D. Effects of 1‐methylcyclopropene alone and in combination with polyethylene bags on the postharvest life of mango fruit. Annals of Applied Biology. 2000;137:321. doi: 10.1111/j.1744-7348.2000.tb00073.x. [DOI] [Google Scholar]
- 21.Wu GA, et al. Sequencing of diverse mandarin, pummelo and orange genomes reveals complex history of admixture during citrus domestication. Nature biotechnology. 2014;32:656. doi: 10.1038/nbt.2906. [DOI] [PMC free article] [PubMed] [Google Scholar]
- 22.Consortium TG. The tomato genome sequence provides insights into fleshy fruit evolution. Nature. 2012;485:635. doi: 10.1038/nature11119. [DOI] [PMC free article] [PubMed] [Google Scholar]
- 23.Shulaev V, et al. The genome of woodland strawberry (Fragaria vesca) Nature genetics. 2011;43:109. doi: 10.1038/ng.740. [DOI] [PMC free article] [PubMed] [Google Scholar]
- 24.Martinelli F, et al. Transcriptome profiling of citrus fruit response to huanglongbing disease. PloS one. 2012;7:1. doi: 10.1371/journal.pone.0038039. [DOI] [PMC free article] [PubMed] [Google Scholar]
- 25.Wu H-x, et al. Transcriptome and proteomic analysis of mango (Mangifera indica Linn) fruits. Journal of proteomics. 2014;105:19. doi: 10.1016/j.jprot.2014.03.030. [DOI] [PubMed] [Google Scholar]
- 26.Azim MK, Khan IA, Zhang Y. Characterization of mango (Mangifera indica L.) transcriptome and chloroplast genome. Plant molecular biology. 2014;85:193. doi: 10.1007/s11103-014-0179-8. [DOI] [PubMed] [Google Scholar]
- 27.Dautt-Castro M, et al. Mango (Mangifera indica L.) cv. Kent fruit mesocarp de novo transcriptome assembly identifies gene families important for ripening. Frontiers in plant science. 2015;6:62. doi: 10.3389/fpls.2015.00062. [DOI] [PMC free article] [PubMed] [Google Scholar]
- 28.Srivastava S, et al. Comparative transcriptome analysis of unripe and mid-ripe fruit of Mangifera indica (var.“Dashehari”) unravels ripening associated genes. Scientific Reports. 2016;6:1. doi: 10.1038/s41598-016-0001-8. [DOI] [PMC free article] [PubMed] [Google Scholar]
- 29.Veda S, Platel K, Srinivasan K. Varietal differences in the bioaccessibility of β-carotene from mango (Mangifera indica) and papaya (Carica papaya) fruits. Journal of agricultural and food chemistry. 2007;55:7931. doi: 10.1021/jf0712604. [DOI] [PubMed] [Google Scholar]
- 30.Tharanathan R, Yashoda H, Prabha T. Mango (Mangifera indica L.),“The king of fruits”—An overview. Food Reviews International. 2006;22:95. doi: 10.1080/87559120600574493. [DOI] [Google Scholar]
- 31.Kanehisa M, Furumichi M, Tanabe M, Sato Y, Morishima K. KEGG: new perspectives on genomes, pathways, diseases and drugs. Nucleic acids research. 2017;45:D353. doi: 10.1093/nar/gkw1092. [DOI] [PMC free article] [PubMed] [Google Scholar]
- 32.Kanehisa M, Goto S. KEGG: kyoto encyclopedia of genes and genomes. Nucleic acids research. 2000;28:27. doi: 10.1093/nar/28.1.27. [DOI] [PMC free article] [PubMed] [Google Scholar]
- 33.Kanehisa M, Sato Y, Kawashima M, Furumichi M, Tanabe M. KEGG as a reference resource for gene and protein annotation. Nucleic acids research. 2016;44:D457. doi: 10.1093/nar/gkv1070. [DOI] [PMC free article] [PubMed] [Google Scholar]
- 34.Kulkarni RS, Chidley HG, Pujari KH, Giri AP, Gupta VS. Geographic variation in the flavour volatiles of Alphonso mango. Food Chemistry. 2012;130:58. doi: 10.1016/j.foodchem.2011.06.053. [DOI] [PubMed] [Google Scholar]
- 35.Pandit SS, et al. Changes in volatile composition during fruit development and ripening of ‘Alphonso’ mango. Journal of the Science of Food and Agriculture. 2009;89:2071. doi: 10.1002/jsfa.3692. [DOI] [Google Scholar]
- 36.Sallaud C, et al. A novel pathway for sesquiterpene biosynthesis from Z, Z-farnesyl pyrophosphate in the wild tomato Solanum habrochaites. The Plant Cell. 2009;21:301. doi: 10.1105/tpc.107.057885. [DOI] [PMC free article] [PubMed] [Google Scholar]
- 37.Huang, F.-C. & Schwab, W. Cloning and characterization of a 9-lipoxygenase gene induced by pathogen attack from Nicotiana benthamiana for biotechnological application. BMC Biotechnology11, 1, doi:10.1186/1472-6750-11-30 (2011). [DOI] [PMC free article] [PubMed]
- 38.Huang F-C, Schwab W. Overexpression of hydroperoxide lyase, peroxygenase and epoxide hydrolase in tobacco for the biotechnological production of flavours and polymer precursors. Plant Biotechnology Journal. 2012;10:1099. doi: 10.1111/j.1467-7652.2012.00739.x. [DOI] [PubMed] [Google Scholar]
- 39.Baysal T, Demirdöven A. Lipoxygenase in fruits and vegetables: A review. Enzyme and Microbial Technology. 2007;40:491. doi: 10.1016/j.enzmictec.2006.11.025. [DOI] [Google Scholar]
- 40.Blee E, Schuber F. Biosynthesis of cutin monomers: involvement of a lipoxygenase/peroxygenase pathway. The Plant Journal. 1993;4:113. doi: 10.1046/j.1365-313X.1993.04010113.x. [DOI] [Google Scholar]
- 41.Masui H, Kondo T, Kojima M. An antifungal compound, 9, 12, 13-trihydroxy-(E)-10-octadecenoic acid, from Colocasia antiquorum inoculated with Ceratocystis fimbriata. Phytochemistry. 1989;28:2613. doi: 10.1016/S0031-9422(00)98051-8. [DOI] [Google Scholar]
- 42.Ohta H, et al. The occurrence of lipid hydroperoxide-decomposing activities in rice and the relationship of such activities to the formation of antifungal substances. Plant and cell physiology. 1990;31:1117. [Google Scholar]
- 43.Atkinson RG, et al. Down-regulation of polygalacturonase1 alters firmness, tensile strength and water loss in apple (Malus x domestica) fruit. BMC plant biology. 2012;12:129. doi: 10.1186/1471-2229-12-129. [DOI] [PMC free article] [PubMed] [Google Scholar]
- 44.Gross KC, Sams CE. Changes in cell wall neutral sugar composition during fruit ripening: a species survey. Phytochemistry. 1984;23:2457. doi: 10.1016/S0031-9422(00)84075-3. [DOI] [Google Scholar]
- 45.Lunn D, Phan TD, Tucker GA, Lycett GW. Cell wall composition of tomato fruit changes during development and inhibition of vesicle trafficking is associated with reduced pectin levels and reduced softening. Plant Physiology and Biochemistry. 2013;66:91. doi: 10.1016/j.plaphy.2013.02.005. [DOI] [PubMed] [Google Scholar]
- 46.Peroni FHGa, et al. Mango starch degradation. II. The binding of α-amylase and β-amylase to the starch granule. Journal of agricultural and food chemistry. 2008;56:7416. doi: 10.1021/jf800469w. [DOI] [PubMed] [Google Scholar]
- 47.Lizada, C. In Biochemistry of fruit ripening (eds G. Seymour, J. Taylor & G. Tucker) 255 (Chapman and Hall, 1993).
- 48.Ali ZM, Chin L-H, Lazan H. A comparative study on wall degrading enzymes, pectin modifications and softening during ripening of selected tropical fruits. Plant Science. 2004;167:317. doi: 10.1016/j.plantsci.2004.03.030. [DOI] [Google Scholar]
- 49.Chourasia A, Sane VA, Nath P. Differential expression of pectate lyase during ethylene‐induced postharvest softening of mango (Mangifera indica var. Dashehari) Physiologia Plantarum. 2006;128:546. doi: 10.1111/j.1399-3054.2006.00752.x. [DOI] [Google Scholar]
- 50.Fischer RL, Bennett AB. Role of cell wall hydrolases in fruit ripening. Annual review of plant biology. 1991;42:675. doi: 10.1146/annurev.pp.42.060191.003331. [DOI] [Google Scholar]
- 51.Kurakawa T, et al. Direct control of shoot meristem activity by a cytokinin-activating enzyme. Nature. 2007;445:652. doi: 10.1038/nature05504. [DOI] [PubMed] [Google Scholar]
- 52.Ludford, P. In Postharvest Physiology and Pathology of Vegetables (CRC Press, 2002).
- 53.Grittle Pinhero R, Almquist KC, Novotna Z, Paliyath G. Developmental regulation of phospholipase D in tomato fruits. Plant Physiology and Biochemistry. 2003;41:223. doi: 10.1016/S0981-9428(03)00014-7. [DOI] [Google Scholar]
- 54.Kawai-Yamada M, Ohori Y, Uchimiya H. Dissection of Arabidopsis Bax inhibitor-1 suppressing Bax–, hydrogen peroxide–, and salicylic acid–induced cell death. The Plant Cell. 2004;16:21. doi: 10.1105/tpc.014613. [DOI] [PMC free article] [PubMed] [Google Scholar]
- 55.Shivashankar S, Ravindra V, Louis H. Biochemical changes in seed and mesocarp of mango (Mangifera indica L.) cv.‘Alphonso’and their significance during the development of spongy tissue. The Journal of Horticultural Science and Biotechnology. 2007;82:35. doi: 10.1080/14620316.2007.11512196. [DOI] [Google Scholar]
- 56.Srivastav M, Singh S, Ajang M. Evaluation of mango genotypes for jelly seed disorder. Indian Journal of Horticulture. 2015;72:408. doi: 10.5958/0974-0112.2015.00079.1. [DOI] [Google Scholar]
- 57.Coates, L. & Johnson, G. Postharvest diseases of fruit and vegetables. Plant pathogens and plant diseases 533 (1997).
- 58.Daulagala P. Expression of chitinase with antifungal activities in ripening Banana fruit. Tropical Plant Research. 2014;1:72. [Google Scholar]
- 59.Martin M. Cutadapt removes adapter sequences from high-throughput sequencing reads. EMBnet. journal. 2011;17:10. doi: 10.14806/ej.17.1.200. [DOI] [Google Scholar]
- 60.Schulz MH, Zerbino DR, Vingron M, Birney E. Oases: robust de novo RNA-seq assembly across the dynamic range of expression levels. Bioinformatics. 2012;28:1086. doi: 10.1093/bioinformatics/bts094. [DOI] [PMC free article] [PubMed] [Google Scholar]
- 61.Li W, Godzik A. Cd-hit: a fast program for clustering and comparing large sets of protein or nucleotide sequences. Bioinformatics. 2006;22:1658. doi: 10.1093/bioinformatics/btl158. [DOI] [PubMed] [Google Scholar]
- 62.Langmead B, Trapnell C, Pop M, Salzberg SL. Ultrafast and memory-efficient alignment of short DNA sequences to the human genome. Genome biology. 2009;10:R25.1. doi: 10.1186/gb-2009-10-3-r25. [DOI] [PMC free article] [PubMed] [Google Scholar]
- 63.Love MI, Huber W, Anders S. Moderated estimation of fold change and dispersion for RNA-seq data with DESeq. 2. Genome biology. 2014;15:1. doi: 10.1186/s13059-014-0550-8. [DOI] [PMC free article] [PubMed] [Google Scholar]
- 64.Conesa A, et al. Blast2GO: a universal tool for annotation, visualization and analysis in functional genomics research. Bioinformatics. 2005;21:3674. doi: 10.1093/bioinformatics/bti610. [DOI] [PubMed] [Google Scholar]
Associated Data
This section collects any data citations, data availability statements, or supplementary materials included in this article.
Supplementary Materials
Data Availability Statement
The raw data files generated during the current study will be available in the NCBI repository under the BioProject - PRJNA391381.