Abstract
Purpose:
To assess the extent of demyelination in cervical spondylotic myelopathy (CSM) using myelin water imaging (MWI) and electrophysiologic techniques.
Methods:
Somatosensory evoked potentials (SSEPs) and MWI were acquired in 14 patients with CSM and 18 age-matched healthy controls. MWI was performed on a 3.0T whole body magnetic resonance scanner. Myelin water fraction (MWF) was extracted for the dorsal columns and whole cord. SSEPs and MWF were also compared with conventional MRI outcomes, including T2 signal intensity, compression ratio, maximum spinal cord compression (MSCC), and maximum canal compromise (MCC).
Results:
Group analysis showed marked differences in T2 signal intensity, compression ratio, MSCC, and MCC between healthy controls and patients with CSM. There were no group differences in MWF and SSEP latencies. However, patients with CSM with pathologic SSEPs exhibited reduction in MWF (p < 0.05). MWF was also correlated with SSEP latencies.
Conclusion:
Our findings provide evidence of decreased myelin content in the spinal cord associated with impaired spinal cord conduction in patients with CSM. While conventional MRI are of great value to define the extent of cord compression, they show a limited correlation with functional deficits (i.e., delayed SSEPs). MWI provides independent and complementary readouts to spinal cord compression, with a high specificity to detect impaired conduction.
Surgical intervention is the frontline strategy to relieve neurologic symptoms associated with cervical spondylotic myelopathy (CSM).1,2 The key to achieving good surgical outcomes is timely and accurate diagnosis. This relies on assessing a combination of clinical symptoms and findings on MRI.3,4 However, routine MRI outcomes, such as maximal spinal cord compression (MSCC) and the presence of signal intensity changes, are not always sensitive to identify clinically relevant pathologies (i.e., those warranting surgical intervention). This is a major problem because an estimated 20%–25% of otherwise healthy individuals will present with some form of compression, not all of which requires intervention.5
Evidence from postmortem histologic studies demonstrates that demyelination occurs at the lesion site in patients with CSM.6 In vivo morphologic evidence of demyelination, however, is lacking. To date, a major limitation of studies applying advanced quantitative imaging in patients with CSM has been that many measures are not specific for myelin.7,8 For example, fractional anisotropy, an output from diffusion tensor imaging (DTI), can be dramatically affected by axonal loss or mechanical deformation without relevant demyelination. To address this limitation, we applied an MRI technique specific to myelin, so-called myelin water imaging (MWI), to examine pathology in the spinal cord related to CSM.
METHODS
Standard protocol approvals, registrations, and patient consents.
All individuals provided written informed consent and all procedures described below were in accordance with the Declaration of Helsinki and approved by the local ethics board (UBC CREB #H06-00282).
Participants.
A total of 15 patients with CSM were recruited from the Vancouver Spine Program. CSM was determined based on typical clinical symptoms (e.g., clumsiness in the hands, pain, weakness, numbness, sensorimotor deficit) and evaluation of conventional MRI by the study neurologist (A.C.). No patients with CSM have undergone decompressive surgery. Twenty age- and sex-matched healthy individuals from the community were enrolled as healthy controls.
Clinical assessments.
Prior to the MRI, all individuals were interviewed to assess their general health and well-being by using the Short Form–36 questionnaire.9,10 In individuals with CSM, the modified Japanese Orthopaedic Association (JOA) score was used to assess the severity of clinical symptoms.11,12 The Nurick Score was used for stratifying the level of functional restriction in mobility (grade O to 5: 0 = no evidence of spinal cord disease, 5 = chair- or bed-bound) caused by cervical myelopathy.13 The neurologic level of stenosis was determined using the International Standards for Neurological Classification of Spinal Cord Injury published by the American Spinal Injury Association.14
Electrophysiology.
Standard tibial somatosensory evoked potentials (SSEPs) were elicited through repetitive electrical stimulation (repetitive square wave impulse of 0.5-ms duration) of the posterior tibial nerves at the medial ankle. SSEPs were elicited using self-adhesive bipolar stimulation electrodes and the Keypoint recording device (Medtronic; Minneapolis, MN). Cortical responses (N40-P43) were recorded using silver–silver disc recording electrodes that were positioned according to the 10–20 system, with the active electrode at Cz and referenced to Fz. In addition to the cortical response, evoked responses were acquired at the popliteal fossa (N9, peripheral measure of the afferent volley) to assure appropriate stimulation and exclude impairment of peripheral nerve conduction. Stimulation frequency was set at 3.1 Hz and 2 traces of 200 stimulations were applied per site and eventually averaged for visual detection of N40-P43 waveform. Electrode impedance was kept below 5kΩ, which was verified prior to the initiation of each session, and all signals were sampled at 10 kHz and bandpass filtered 2 Hz to 2 kHz. Averaged SSEPs were visually inspected for N40 and P43 latencies and N40-P43 amplitude. Accounting for study participant height, SSEP amplitude, latency, and configuration were evaluated against standard laboratory control values.15
MRI experiments.
All individuals were scanned on a 3.0T MRI system (Philips; Best, the Netherlands) with a phased array spine coil using only the first 4 channels for best localization of the cervical spinal cord. Localizer and sagittal T2-weighted imaging sequences (repetition time [TR] 3,314 ms, echo time [TE] 120 ms) were applied first for the purposes of spinal cord localization and axial slices alignment. MWI was performed using a multiecho T2 relaxation experiment (3D 32-echo sequence, 1st echo 10 ms, echo spacing 10 ms, TR 1,300 ms, eight 5-mm-thick axial slices perpendicular to the spinal cord, 256 × 128 matrix, field of view 180 × 135 mm, reconstructed in-plane resolution 0.7 × 0.7 mm, acquisition time of 20.3 minutes).16 Positioning of the 3D stack was centered at the level of stenosis in participants with CSM. C5 was planned for all healthy controls based on the rationale that the majority of participants with CSM would have stenosis at or within one spinal segment (i.e., C4–C6). A previous study indicates minimal variation in MWF between cervical spinal segments.17 The MWI scan–rescan repeatability was tested and reported by MacMillan et al.18
MWI data analysis.
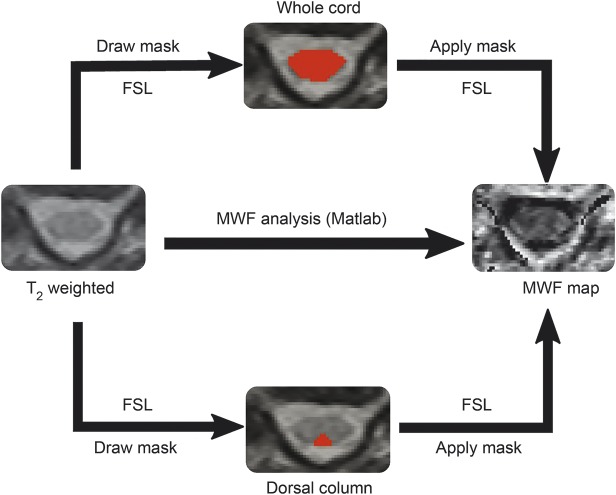
Voxel-wise T2 decay curve analysis used a regularized non-negative least squares algorithm with in-house software (MATLAB; The MathWorks, Inc., Natick, MA), which employed the extended phase graph algorithm to estimate the refocusing flip angle in each voxel as well as correcting the T2 decay curve for stimulated echo artifacts. This algorithm and its performance have been documented by Prasloski et al.19 The MWF, which measures water trapped between myelin bilayers, was defined as the fractional signal with T2 less than 35 ms.18 MWF was calculated for each voxel to produce a MWF map. For each study participant, the average MWF in the whole cord and dorsal column were calculated in 3 steps using FMRIB's software library20 (figure 1): (1) manually drawing regions of interest (ROI includes dorsal columns and whole cord), independently performed by 2 experienced researchers (H.L., C.L.), on each slice of T2-weighted images (TE 90–120 ms) from the 3D multiecho T2 experiment for better anatomical contrast; (2) combining the ROIs over the 6 middle slices (the first and last slices are discarded due to phase wrapping in the through-plane direction) to yield a volume of interest; (3) calculating the average MWF within the volume of interest.
Figure 1. Work flowchart.
An example of calculating the average myelin water fraction (MWF) in the whole cord and dorsal column. FSL = FMRIB software library.
Compression ratio, MSCC, and maximum canal compromise.
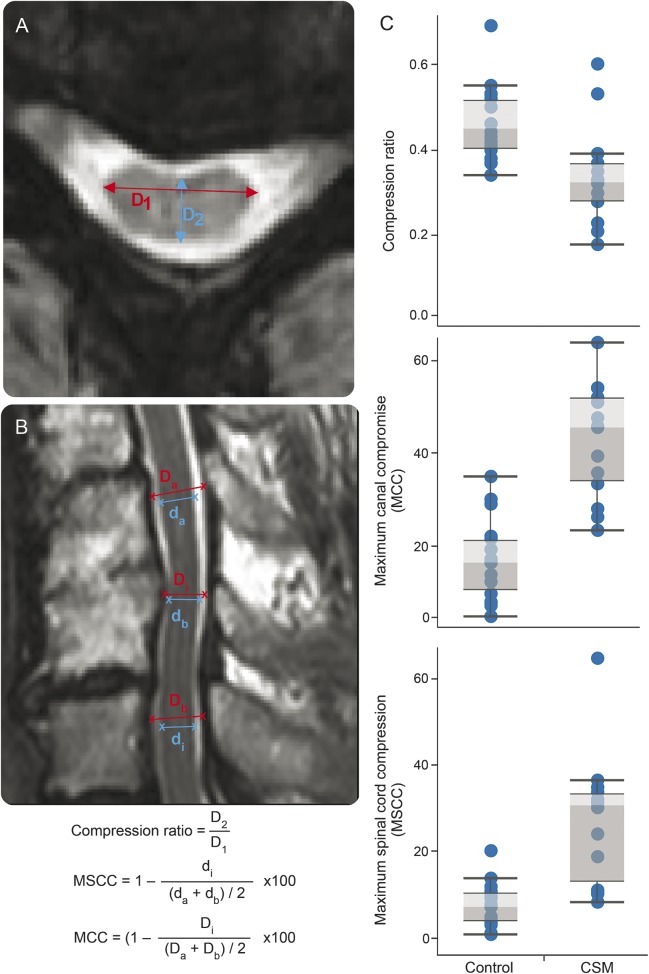
Axial and sagittal T2-weighted images were examined for T2 intensity signal changes at the level of stenosis, compression ratio, MSCC, and maximum canal compromise (MCC). T2 intensity changes were examined by an experienced radiologist. Compression ratio was calculated by taking the anterior–posterior diameter of the spinal cord divided by the transverse diameter of the cord on the axial image. Lower compression ratio values indicate worse cord deformation. MSCC and MCC were assessed on the midsagittal slice of the T2-weighted spinal cord images using the method introduced by Nouri et al.21 Unlike compression ratio, higher values of MSCC and MCC correspond to more severe cord deformation. Detailed calculation steps for compression ratio, MSCC, and MCC are described in figure 2, A and B.
Figure 2. Calculations of conventional MRI measures and comparisons between healthy controls and patients with cervical spondylotic myelopathy (CSM).
(A, B) The methods for calculating compression ratio, maximum spinal cord compression (MSCC), and maximum canal compromise (MCC). D1 = transverse diameter; D2 = anterior–posterior diameter; Di (di) = canal (spinal cord) diameter at compression level; Da (da) = canal (spinal cord) diameter of noncompressed level from above; Db (db): canal (spinal cord) diameter of noncompressed level from below. (C) Significant differences were observed in compression ratio, MSCC, and MCC between healthy controls and patients with CSM.
Statistical analysis.
All statistical procedures were performed using IBM's (Armonk, NY) Statistical Package for the Social Sciences, version 23.0. Nonparametric tests (Mann-Whitney U) were applied to determine significant differences in spinal cord compression, anterior–posterior width, and transverse (left–right) and tibial SSEP latencies between control individuals and patients with CSM. Univariate general linear models (GLMs) were employed to assess the relationship between MWF, SSEPs, and CSM classification. In the initial models (model 1), the main effect of CSM classification was examined. CSM was included as a fixed factor (“yes”/“no”). In a subsequent model (model 2), SSEPs (“normal”/“pathologic”) and the interaction with CSM classification were examined. GLMs were run separately for dorsal column and whole cord and right and left SSEPs. p < 0.05 Was set as the threshold for significance.
RESULTS
Participants.
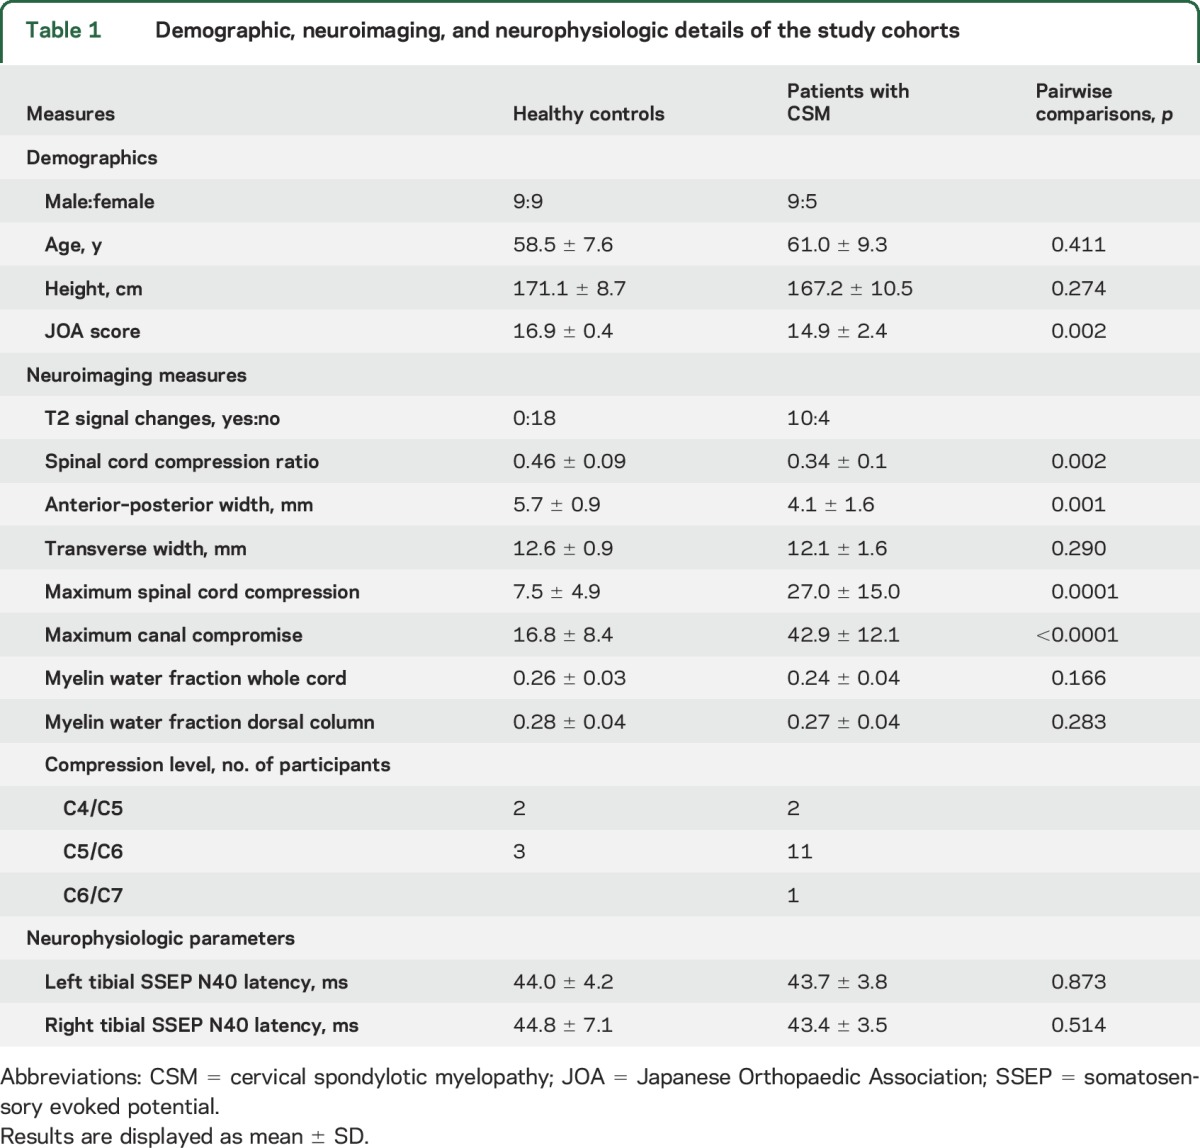
Out of 15 patients with CSM enrolled in the study, one had to be excluded due to an incomplete dataset (missing magnetic resonance [MR] scan for MWI). The remaining 14 patients comprised 11 men and 3 women with a mean age of 61.0 ± 9.3 years (range 46–77 years). According to established classification guidelines,22 CSM severity was as follows: 11 mild (JOA ≥15), 2 moderate (JOA 12–14), and 1 severe (JOA <12). Out of 20 healthy controls, 2 had to be excluded for missing data (i.e., could not perform MRI). The remaining 18 healthy controls were enrolled in the study (9 men, 9 women, mean age 58.5 ± 7.6 years (range 50–75 years). The characteristics of all study participants are summarized in table 1.
Table 1.
Demographic, neuroimaging, and neurophysiologic details of the study cohorts
Neuroimaging: Structural and signal changes at the spinal cord.
Overall, compression ratio was increased by 35.3% (U = 35.0, p = 0.001) in the patients with CSM at the level of stenosis compared to healthy controls at the level of C5. Compared to healthy controls, differences in anterior–posterior width were observed in patients with CSM (−28.1%; U = 26.5, p = 0.002). No differences between control and CSM groups were detected regarding transverse (left–right) axis (U = 85.5, p = 0.270). Compression ratio, MSCC, MCC, and compression levels are shown in table 1. Five healthy controls and all patients with CSM were found to have spinal cord compression. T2 signal changes (hyperintensity) were observed in 10 patients with CSM but not in controls. Corresponding with diagnosis of CSM, there were large differences in compression ratio, MSCC, and MCC between controls and patients with CSM (table 1).
Neurophysiologic assessments: Changes in spinal conduction and associations with conventional MRI outcomes.
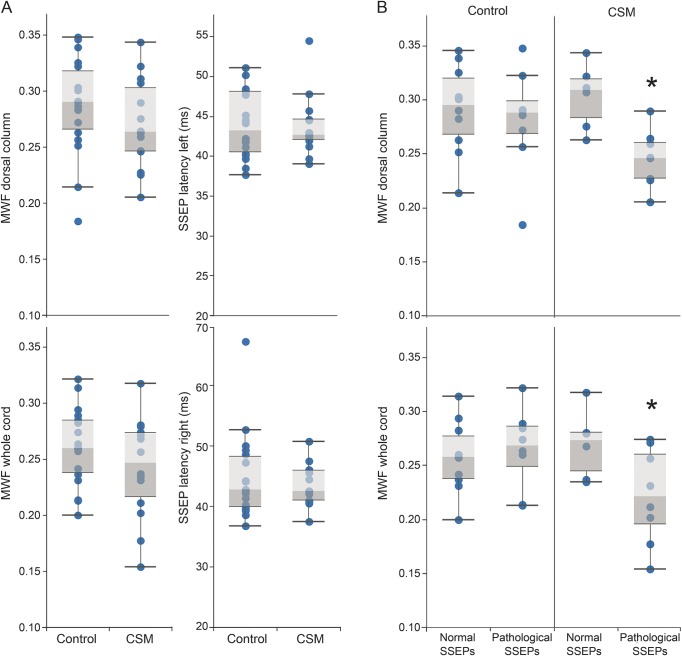
Tibial SSEP latencies of both groups are summarized in table 1. Mean latencies for tibial (left or right) were not different between patients with CSM and healthy controls (tibialleft: U = 115, p = 0.891; tibialright: U = 112.0, p = 0.781) (figure 3A). Eight healthy controls and 8 patients with CSM were classified as having pathologic SSEPs.
Figure 3. Myelin water fraction (MWF) and somatosensory evoked potentials (SSEPs) comparisons between healthy controls and patients with cervical spondylotic myelopathy (CSM) and interaction effect.
(A) MWF (whole cord and dorsal column) and tibial SSEP latencies (left and right) between healthy controls and patients with CSM are compared. No differences were observed between groups. (B) An interaction between the interpretation of tibial SSEPs (“pathology”/“normal”) and the diagnosis of CSM (“yes”/“no”) was observed for MWF of the whole cord. Patients with CSM and pathologic tibial SSEPs had reduced MWF (indicated by *).
Myelin damage in patients with CSM: Relationship between neurophysiologic and neuroimaging parameters.
According to our first GLM (model 1), there were no differences in MWF of the whole cord (F = 2.015, df 1, p = 0.166) or dorsal column (F = 1.192, df 1, p = 0.284) between CSM and controls (figure 3A). Model 2 revealed an interaction between CSM classification and SSEP interpretation in whole cord MWF (left SSEP: F = 7.82, df 3, p = 0.009; right SSEP: F = 4.77, df 3, p = 0.049). Overall, our observations indicate that patients with CSM and pathologic tibial SSEPs had marked lower myelin content. Model summaries for linear regressions are provided in table e-1 at Neurology.org.
Other analyses pertaining to the relationship between MWF and CSM are highlighted in tables e-2 and e-3.
DISCUSSION
Based on an in vivo measure specific to myelin, our findings demonstrate that CSM is associated with microstructural changes in spinal cord white matter. Microstructural changes in myelin were demonstrated using MWI and evidenced in a cohort of patients with CSM with accompanying neurophysiologic deficits. We have provided in vivo anatomical evidence of demyelination related to conduction deficits in patients with CSM.
MWF as a surrogate marker of myelin has previously been demonstrated in postmortem combined MRI and histologic studies.23–25 Consistent with these ex vivo observations, MWF is sensitive to changes in patient populations commonly associated with demyelination in the CNS, including multiple sclerosis,26,27 phenylketonuria,28 and schizophrenia.29 MWI operates on the principle that the MR signal from water trapped between myelin bilayers can be extracted from the total MR signal based on a characteristic short T2 relaxation time. The ratio of myelin water signal relative to the total signal is termed myelin water fraction (MWF). The primary focus of in vivo MWF applications in patients has been almost exclusively in the brain.
Postmortem histologic study of spinal cords suggests that myelinated long tracts are affected in patients with CSM.6 This includes evidence of demyelination at the lesion site. Preclinical studies suggest that CNS myelin is susceptible to ischemic injury resulting from spinal cord compression.30 Corresponding in vivo evidence of white matter pathology has been largely elucidated based on DTI.31–33 Results from DTI measurement showed strong sensitivity for detecting microstructural changes and correlations with clinical scores. However, DTI metrics are not specific to the type of damage, which may include a combination of inflammation, demyelination, or axonal loss.7 Thus, based solely on these studies, it is difficult to conclude whether CSM is affecting myelin or, more generally, the composition of spinal cord axons due to mechanical deformation.
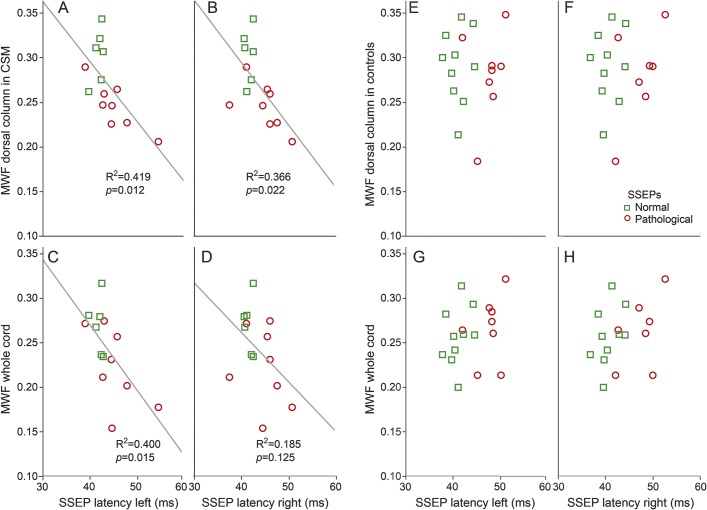
Few studies have applied both quantitative MRI and an electrophysiologic approach to examine CSM.34,35 The advantage of combining both techniques is that they are unbiased by what an individual is functionally capable of performing (e.g., JOA). This combined approach is powerful for understanding the pathophysiology and anatomy of CSM.35 An important outcome of our study was that conventional CSM diagnosis alone yielded no obvious differences in neurophysiologic or MWI measures (figure 3A). Consistent with previous literature, approximately 60% of patients with CSM in our study presented with pathologic SSEPs.36 An equal number (n = 8) and approximately half of healthy controls also demonstrated pathologic SSEPs. MWF values in healthy controls were comparable to previous studies,17,18,37 and not different from patients with CSM on a group level. In contrast to healthy controls, pathologic SSEP classification in individual patients with CSM was associated with reduced MWF (figure 3). In pragmatic terms, this means that microstructural changes in white matter become evident in clinically obvious CSM symptoms (e.g., clumsiness) that are also accompanied by objective measures of spinal cord pathology (e.g., impaired SSEPs). The linear correlations of SSEP latency and MWF (dorsal column and whole cord) are also only observed in patients with CSM (figure 4). From pathophysiologic considerations, decreases in MWF are not linearly related to pathologic SSEPs, as shown in healthy controls. Obviously changes in SSEPs in healthy aged controls respond also to other change in CNS and peripheral nervous system microstructure, which are undetected by MWI of the cord. The age-matched patients with CSM would be expected to undergo these same changes; however, additionally accompanied by persistent compression of the spinal cord, the latter yielding a reduction in MWF.
Figure 4. Correlations between somatosensory evoked potentials (SSEPs) and myelin water fraction (MWF) in patients with cervical spondylotic myelopathy (CSM) and healthy controls.
Correlations of tibial SSEPs (left and right) with dorsal column and whole cord MWF in participants with CSM (A–D) and healthy controls (E–H). Significant correlations are only found in the CSM group (trend lines are fitted R2 and p value). No correlations are observed in healthy controls.
Our study specifically examined the spinal cord MWF in patients with CSM. The application of MWI to the spinal cord has historically lagged behind that of brain studies due to the general technical challenges of imaging spinal cord microstructure using MRI.38 By taking advantage of the development of a 3D multiecho pulse sequence, it is now possible to achieve multislice coverage of the spinal cord with shorter acquisition time compared to previous single slice acquisitions.37 Also, the in-plane resolution (0.7 × 0.7 mm) is sufficient to resolve detailed anatomical structures (e.g., the butterfly pattern of white and gray matter on the axial plane). Reliability and repeatability of applying MWI using the current 3D multiecho sequence in cervical spinal cord are acceptable and have been examined elsewhere.18 In all participants, dorsal column MWF average (0.280 ± 0.042) was higher than that of the whole cord (0.253 ± 0.040). Lower whole cord MWF reflects the inclusion of unmyelinated gray matter in the ROI, leading to lower relative values, in comparison to the dorsal column ROIs, which are white matter.
A number of limitations warrant consideration. First, the specificity and sensitivity of MWI to accurately diagnose CSM cannot be fully addressed due to the small number of patients. Second, manual ROIs may introduce bias to the analysis. Future investigations should consider automatic segmentation tools, which have only recently become available for the spinal cord.39 Finally, the 20-minute acquisition time for MWI is long and may be difficult for some patients. Towards improving clinical applicability, recent advances in MWI have dramatically reduced scanning time to approximately 8 minutes.40
Combining neurophysiologic and neuroimaging outcomes revealed considerable changes in white matter integrity related to spinal cord compression. Microstructural changes in myelin were specifically observed in a cohort of patients with pathologic spinal conduction. In the future, MWI may be a useful tool for prognosis related to interventions aimed at reducing the functional consequences of CSM.
Supplementary Material
ACKNOWLEDGMENT
The authors thank the study participants and MRI technologists at their center.
GLOSSARY
- CSM
cervical spondylotic myelopathy
- DTI
diffusion tensor imaging
- GLM
general linear model
- JOA
Japanese Orthopaedic Association
- MCC
maximum canal compromise
- MR
magnetic resonance
- MSCC
maximal spinal cord compression
- MWF
myelin water fraction
- MWI
myelin water imaging
- ROI
region of interest
- SSEP
somatosensory evoked potential
- TE
echo time
- TR
repetition time
Footnotes
Supplemental data at Neurology.org
AUTHOR CONTRIBUTIONS
Hanwen Liu: analysis and interpretation of data, drafting manuscript. Erin L. MacMillian: study concept and design, acquisition of data, critical revision of manuscript for intellectual content. Catherine R. Jutzeler: analysis and interpretation of data, drafting manuscript. Emil Ljungberg: analysis of data, critical revision of manuscript for intellectual content. Alex L. MacKay: study concept and design, acquisition of data, critical revision of manuscript for intellectual content. Shannon H. Kolind: study concept and design, acquisition of data, critical revision of manuscript for intellectual content. Burkhard Mädler: study concept and design, acquisition of data, critical revision of manuscript for intellectual content. David K.B. Li: study concept and design, analysis of data, critical revision of manuscript for intellectual content. Marcel F. Dvorak: study concept and design, critical revision of manuscript for intellectual content. Armin Curt: study concept and design, acquisition of data, critical revision of manuscript for intellectual content. Cornelia Laule: study concept and design, acquisition of data, data interpretation, critical revision of manuscript for intellectual content, study supervision. John Kramer: study concept and design, data interpretation, critical revision of manuscript for intellectual content, study supervision.
STUDY FUNDING
Catherine Jutzeler is supported by a postdoctoral research fellowship from the International Foundation for Research in Paraplegia (IRP). John Kramer is supported by a Michael Smith Foundation for Health Research/Rick Hansen Institute Scholar award. Study funded by the Cervical Spine Research Society.
DISCLOSURE
H. Liu, E. MacMillian, C. Jutzeler, E. Ljungberg, A. MacKay, S. Kolind, and B. Mädler report no disclosures relevant to the manuscript. D. Li has received research funding from the Canadian Institute of Health Research and Multiple Sclerosis Society of Canada. He is the Director of the UBC MS/MRI Research Group, which has been contracted to perform central analysis of MRI scans for therapeutic trials with Novartis, Perceptives, Roche, and Sanofi-Aventis. The UBC MS/MRI Research Group has also received grant support for investigator-initiated independent studies from Genzyme, Merck-Serono, Novartis, and Roche. He has acted as a consultant to Vertex Pharmaceuticals and served on the Data and Safety Advisory Board for Opexa Therapeutics and Scientific Advisory Boards for Adelphi Group, Novartis, and Roche. He has also given lectures that have been supported by nonrestricted education grants from Novartis and Biogen. M. Dvorak, A. Curt, C. Laule, and J. Kramer report no disclosures relevant to the manuscript. Go to Neurology.org for full disclosures.
REFERENCES
- 1.Emery SE. Cervical spondylotic myelopathy: diagnosis and treatment. J Am Acad Orthop Surg 2001;9:376–388. [DOI] [PubMed] [Google Scholar]
- 2.Mummaneni PV, Kaiser MG, Matz PG, et al. ; Joint Section on Disorders of the Spine and Peripheral Nerves of the American Association of Neurological Surgeons and Congress of Neurological Surgeons. Cervical surgical techniques for the treatment of cervical spondylotic myelopathy. J Neurosurg Spine 2009;11:130–141. [DOI] [PubMed] [Google Scholar]
- 3.Kramer JK, Taylor P, Steeves JD, Curt A. Dermatomal somatosensory evoked potentials and electrical perception thresholds during recovery from cervical spinal cord injury. Neurorehabil Neural Repair 2010;24:309–317. [DOI] [PubMed] [Google Scholar]
- 4.Yu YL, Jones SJ. Somatosensory evoked potentials in cervical spondylosis: correlation of median, ulnar and posterior tibial nerve responses with clinical and radiological findings. Brain 1985;108:273–300. [DOI] [PubMed] [Google Scholar]
- 5.Matsumoto M, Fujimura Y, Suzuki N, et al. MRI of cervical intervertebral discs in asymptomatic subjects. J Bone Joint Surg Br 1998;80:19–24. [DOI] [PubMed] [Google Scholar]
- 6.Ito T, Oyanagi K, Takahashi H, Takahashi HE, Ikuta F. Cervical spondylotic myelopathy: clinicopathologic study on the progression pattern and thin myelinated fibers of the lesions of seven patients examined during complete autopsy. Spine 1996;21:827–833. [DOI] [PubMed] [Google Scholar]
- 7.Alexander AL, Lee JE, Lazar M, Field AS. Diffusion tensor imaging of the brain. Neurotherapeutics 2007;4:316–329. [DOI] [PMC free article] [PubMed] [Google Scholar]
- 8.Wheeler-Kingshott CA, Cercignani M. About “axial” and “radial” diffusivities. Magn Reson Med 2009;61:1255–1260. [DOI] [PubMed] [Google Scholar]
- 9.Ware JE, Snow KK, Kosinski M, Gandek B, eds. SF-36® Health Survey Manual and Interpretation Guide. Boston: New England Medical Center: The Health Institute; 1993. [Google Scholar]
- 10.Ware JE Jr, Sherbourne CD. The MOS 36-item short-form health survey (SF-36): I: conceptual framework and item selection. Med Care 1992;30:473–483. [PubMed] [Google Scholar]
- 11.Yonenobu K, Abumi K, Nagata K, Taketomi E, Ueyama K. Interobserver and intraobserver reliability of the Japanese orthopaedic association scoring system for evaluation of cervical compression myelopathy. Spine 2001;26:1890–1894; discussion 1895. [DOI] [PubMed] [Google Scholar]
- 12.Japanese Orthopaedic Association. Scoring system for cervical myelopathy. J Jpn Orthop Assoc 1994;68:490–503. [Google Scholar]
- 13.Nurick S. The pathogenesis of the spinal cord disorder associated with cervical spondylosis. Brain 1972;95:87–100. [DOI] [PubMed] [Google Scholar]
- 14.Committee Membership, Burns S, Biering-Sorensen F, et al. International standards for neurological classification of spinal cord injury, revised 2011. Top Spinal Cord Inj Rehabil 2012;18:85–99. [DOI] [PMC free article] [PubMed] [Google Scholar]
- 15.Curt A, Van Hedel HJ, Klaus D, Dietz V; EM-SCI Study Group. Recovery from a spinal cord injury: significance of compensation, neural plasticity, and repair. J Neurotrauma 2008;25:677–685. [DOI] [PubMed] [Google Scholar]
- 16.Madler B, Drabycz SA, Kolind SH, Whittall KP, MacKay AL. Is diffusion anisotropy an accurate monitor of myelination? Correlation of multicomponent T2 relaxation and diffusion tensor anisotropy in human brain. Magn Reson Imaging 2008;26:874–888. [DOI] [PubMed] [Google Scholar]
- 17.Minty EP, Bjarnason TA, Laule C, MacKay AL. Myelin water measurement in the spinal cord. Magn Reson Med 2009;61:883–892. [DOI] [PubMed] [Google Scholar]
- 18.MacMillan EL, Mädler B, Fichtner N, et al. Myelin water and T2 relaxation measurements in the healthy cervical spinal cord at 3.0T: repeatability and changes with age. Neuroimage 2011;54:1083–1090. [DOI] [PubMed] [Google Scholar]
- 19.Prasloski T, Mädler B, Xiang Q, MacKay A, Jones C. Applications of stimulated echo correction to multicomponent T2 analysis. Magn Reson Med 2012;67:1803–1814. [DOI] [PubMed] [Google Scholar]
- 20.Smith SM, Jenkinson M, Woolrich MW, et al. Advances in functional and structural MR image analysis and implementation as FSL. Neuroimage 2004;23(suppl 1):S208–S219. [DOI] [PubMed] [Google Scholar]
- 21.Nouri A, Tetreault L, Cote P, Zamorano JJ, Dalzell K, Fehlings MG. Does magnetic resonance imaging improve the predictive performance of a validated clinical prediction rule developed to evaluate surgical outcome in patients with degenerative cervical myelopathy? Spine 2015;40:1092–1100. [DOI] [PubMed] [Google Scholar]
- 22.Fehlings MG, Wilson JR, Kopjar B, et al. Efficacy and safety of surgical decompression in patients with cervical spondylotic myelopathy: results of the AOSpine North America prospective multi-center study. J Bone Joint Surg Am 2013;95:1651–1658. [DOI] [PubMed] [Google Scholar]
- 23.Laule C, Leung E, Lis DK, et al. Myelin water imaging in multiple sclerosis: quantitative correlations with histopathology. Mult Scler 2006;12:747–753. [DOI] [PubMed] [Google Scholar]
- 24.Laule C, Kozlowski P, Leung E, Li DK, Mackay AL, Moore GR. Myelin water imaging of multiple sclerosis at 7 T: correlations with histopathology. Neuroimage 2008;40:1575–1580. [DOI] [PubMed] [Google Scholar]
- 25.Laule C, Yung A, Pavolva V, et al. High-resolution myelin water imaging in post-mortem multiple sclerosis spinal cord: a case report. Mult Scler 2016;22:1485–1489. [DOI] [PubMed] [Google Scholar]
- 26.Moore GR, Laule C, Mackay A, et al. Dirty-appearing white matter in multiple sclerosis: preliminary observations of myelin phospholipid and axonal loss. J Neurol 2008;255:1802–1811. [DOI] [PubMed] [Google Scholar]
- 27.Laule C, Vavasour IM, Moore GR, et al. Water content and myelin water fraction in multiple sclerosis: a T2 relaxation study. J Neurol 2004;251:284–293. [DOI] [PubMed] [Google Scholar]
- 28.Sirrs SM, Laule C, Madler B, et al. Normal-appearing white matter in patients with phenylketonuria: water content, myelin water fraction, and metabolite concentrations. Radiology 2007;242:236–243. [DOI] [PubMed] [Google Scholar]
- 29.Flynn SW, Lang DJ, Mackay AL, et al. Abnormalities of myelination in schizophrenia detected in vivo with MRI, and post-mortem with analysis of oligodendrocyte proteins. Mol Psychiatry 2003;8:811–820. [DOI] [PubMed] [Google Scholar]
- 30.Gledhill RF, Harrison BM, McDonald WI. Demyelination and remyelination after acute spinal cord compression. Exp Neurol 1973;38:472–487. [DOI] [PubMed] [Google Scholar]
- 31.Ellingson BM, Salamon N, Holly LT. Advances in MR imaging for cervical spondylotic myelopathy. Eur Spine J 2015;24(suppl 2):197–208. [DOI] [PMC free article] [PubMed] [Google Scholar]
- 32.Cheung MM, Li DT, Hui ES, et al. In vivo diffusion tensor imaging of chronic spinal cord compression in rat model. Conf Proc IEEE Eng Med Biol Soc 2009;2009:2715–2718. [DOI] [PubMed] [Google Scholar]
- 33.Budzik JF, Balbi V, Le Thuc V, Duhamel A, Assaker R, Cotten A. Diffusion tensor imaging and fibre tracking in cervical spondylotic myelopathy. Eur Radiol 2011;21:426–433. [DOI] [PubMed] [Google Scholar]
- 34.Hu Y, Wen CY, Li TH, Cheung MM, Wu EX, Luk KD. Somatosensory-evoked potentials as an indicator for the extent of ultrastructural damage of the spinal cord after chronic compressive injuries in a rat model. Clin Neurophysiol 2011;122:1440–1447. [DOI] [PubMed] [Google Scholar]
- 35.Ellingson BM, Kurpad SN, Schmit BD. Functional correlates of diffusion tensor imaging in spinal cord injury. Biomed Sci Instrum 2008;44:28–33. [PubMed] [Google Scholar]
- 36.Kerkovsky M, Bednarik J, Dusek L, et al. Magnetic resonance diffusion tensor imaging in patients with cervical spondylotic spinal cord compression: correlations between clinical and electrophysiological findings. Spine 2012;37:48–56. [DOI] [PubMed] [Google Scholar]
- 37.Laule C, Vavasour IM, Zhao Y, et al. Two-year study of cervical cord volume and myelin water in primary progressive multiple sclerosis. Mult Scler 2010;16:670–677. [DOI] [PubMed] [Google Scholar]
- 38.Hickman SJ, Miller DH. Imaging of the spine in multiple sclerosis. Neuroimaging Clin N Am 2000;10:689–704, viii. [PubMed] [Google Scholar]
- 39.De Leener B, Levy S, Dupont SM, et al. SCT: spinal cord toolbox, an open-source software for processing spinal cord MRI data. Neuroimage 2016;145:24–43. [DOI] [PubMed] [Google Scholar]
- 40.Ljungberg E, Vavasour I, Tam R, et al. Rapid myelin water imaging in human cervical spinal cord. Magn Reson Med Epub 2016 Nov 9. [DOI] [PubMed]
Associated Data
This section collects any data citations, data availability statements, or supplementary materials included in this article.


