Abstract
Objective:
To help understand speech changes in behavioral variant frontotemporal dementia (bvFTD), we developed and implemented automatic methods of speech analysis for quantification of prosody, and evaluated clinical and anatomical correlations.
Methods:
We analyzed semi-structured, digitized speech samples from 32 patients with bvFTD (21 male, mean age 63 ± 8.5, mean disease duration 4 ± 3.1 years) and 17 matched healthy controls (HC). We automatically extracted fundamental frequency (f0, the physical property of sound most closely correlating with perceived pitch) and computed pitch range on a logarithmic scale (semitone) that controls for individual and sex differences. We correlated f0 range with neuropsychiatric tests, and related f0 range to gray matter (GM) atrophy using 3T T1 MRI.
Results:
We found significantly reduced f0 range in patients with bvFTD (mean 4.3 ± 1.8 ST) compared to HC (5.8 ± 2.1 ST; p = 0.03). Regression related reduced f0 range in bvFTD to GM atrophy in bilateral inferior and dorsomedial frontal as well as left anterior cingulate and anterior insular regions.
Conclusions:
Reduced f0 range reflects impaired prosody in bvFTD. This is associated with neuroanatomic networks implicated in language production and social disorders centered in the frontal lobe. These findings support the feasibility of automated speech analysis in frontotemporal dementia and other disorders.
We are all expert speakers, yet the speech we produce is the outcome of an extraordinarily complex process. One important suprasegmental attribute of speech is prosody, which reflects a combination of rhythm, pitch, and amplitude characteristics of our speech pattern. Prosody is typically used to convey emotional and linguistic information, and thus is essential to communicating many of our messages in day-to-day speech. In this study, we examined prosodic characteristics of speech in patients with behavioral variant frontotemporal dementia (bvFTD).
Patients with bvFTD have a progressive disorder of personality and social cognition that compromises daily functioning. They have been noted to have subtle linguistic deficits, not qualifying as aphasia: mildly reduced words/min,1 reduced narrative organization manifested as tangential speech,2 limited story comprehension,3 mild difficulty with comprehension of grammatically mediated sentences,4 and impaired comprehension and expression of abstract words5 and propositional speech.6 Prosody has been more difficult to measure directly, thus it is often estimated subjectively7 and qualitatively.8 To characterize prosodic difficulty in bvFTD, we developed and implemented an automated speech analysis algorithm that provides a reliable, objective, and quantitative analysis of speech expression. This is crucial because many of our characterizations of social disorders in bvFTD depend in part on impressions derived from patients' speech. We implemented this algorithm in a brief, digitized, semi-structured speech sample and hypothesized abnormal prosodic expression in patients with bvFTD—specifically, abnormal pitch range and speech segment durations, which are directly measurable with our automated methods—compared to healthy speakers. We emphasize intonation, represented here by pitch range, as the most distinct prosodic impairment in this patient group related to their social and behavioral dysfunction.
We also examined the neuroanatomic basis for impaired prosody in bvFTD. Portions of the neuroanatomic network underlying speech production are atrophic in bvFTD2,5 and close to brain regions associated with behavioral symptoms. Thus, we directly related quantitative analyses of dysprosody to high-resolution MRI. We expected prosodic speech difficulties in bvFTD to be related to bilateral prefrontal disease.
METHODS
Participants.
We analyzed 32 digitized speech samples from nonaphasic native English speakers who met published criteria for the diagnosis of probable bvFTD9 and had an MRI scan. These patients had no evidence of other causes of cognitive or speech difficulty such as stroke or head trauma, a primary psychiatric disorder, or a medical or surgical condition. All were assessed between January 2000 and March 2016 by experienced neurologists (M.G., D.J.I.) in the Department of Neurology at the Hospital of the University of Pennsylvania. Five patients had definite frontotemporal lobar degeneration (FTLD) pathology (4 FTLD-tau, 1 FTLD-TDP). From our audio database of 42 bvFTD cases with MRI, we excluded patients with concomitant amyotrophic lateral sclerosis (ALS) symptomatology (n = 2) to minimize potential motor confounds associated with bulbar and respiratory disease, secondary pathologic diagnosis of ALS or Alzheimer disease (n = 3), poor quality sound (n = 3, see below), or poor quality imaging (n = 2). Six cases had a mild semantic impairment as part of the clinical picture but did not meet criteria for semantic variant primary progressive aphasia,10 and thus were included. We also assessed 17 healthy controls (HC), who were well-matched with the patients (table 1).
Table 1.
Clinical and demographic characteristics of patients with behavioral variant of frontotemporal dementia (bvFTD) and healthy controls (HCs)
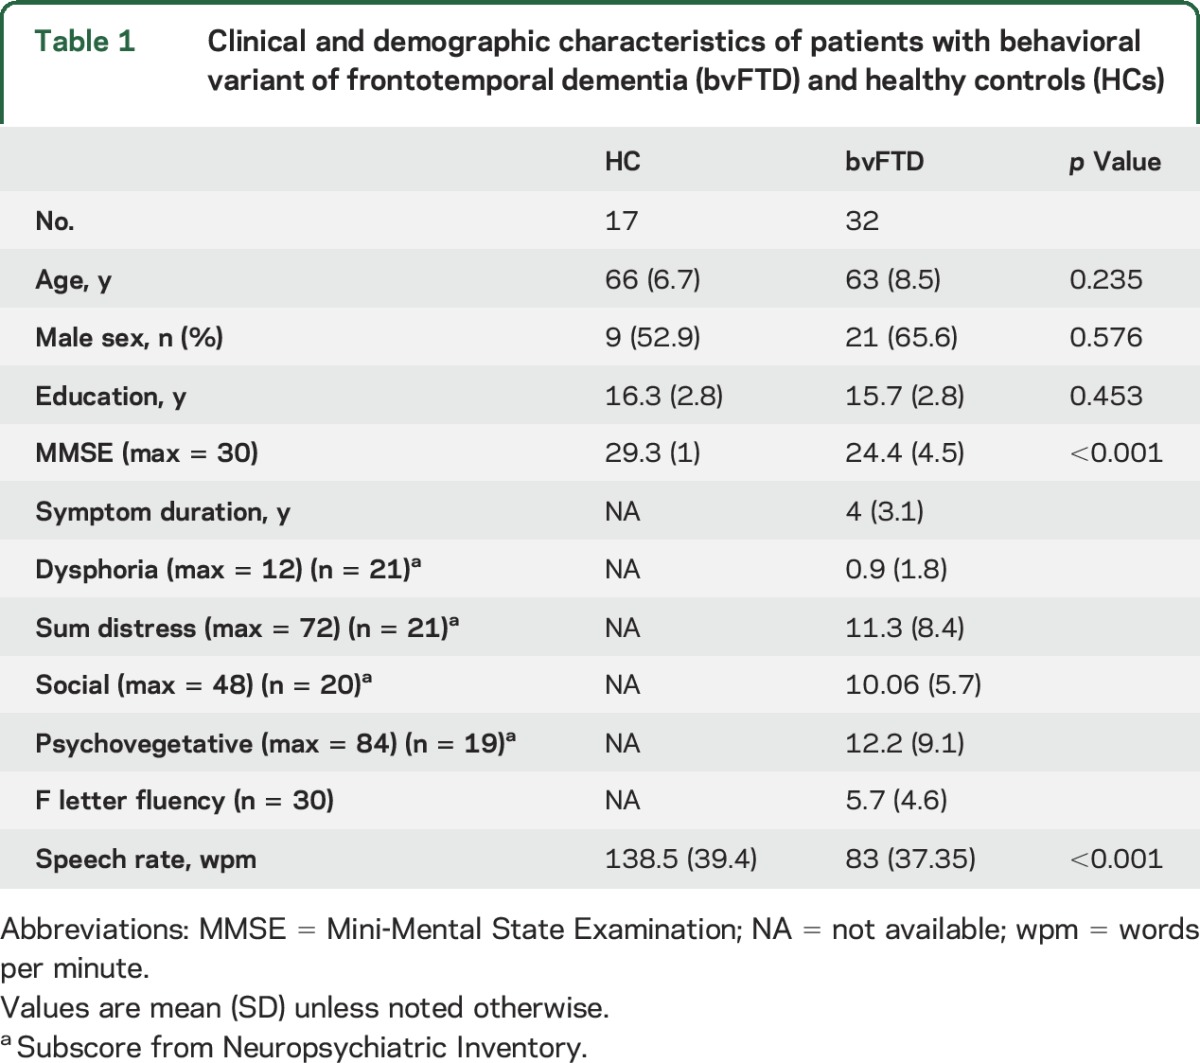
Twenty-one patients had a Neuropsychiatric Inventory (NPI) test performed within 3.3 ± 3.9 months of their analyzed audio, and all except 2 were rated on all individual scores of the test (the remaining speech samples were collected prior to our regular use of the NPI). We calculated 4 composite subscores based on published classification11: dysphoria—depression individual score (F × S); social—apathy, disinhibition, irritability, and euphoria (F × S); psychovegetative—sleep, appetite, anxiety, hallucinations, delusions, agitation, and aberrant motor behavior (F × S); sum distress—summarized caregiver distress scores. We examined executive functioning with letter-guided category-naming fluency (available in 30 patients), which were consistent with the diagnosis of bvFTD (table 1).
Speech samples.
We used the Cookie Theft picture description task from the Boston Diagnostic Aphasia Examination12 to elicit semi-structured narrative speech samples. This method has previously shown reliability in speech analysis.13 Detail on sound collection is provided in the supplemental data at Neurology.org.
Sound processing.
We used a speech activity detector (SAD) created at the University of Pennsylvania Linguistic Data Consortium14 to time-segment the audio files. We manually reviewed the segmented files in Praat15 to verify accuracy of SAD and excluded segments with interviewer speech or background noises that could confound pitch tracking. To minimize truncation of segments, noise was not labeled out if it was within a silent pause. Segment durations were calculated by subtracting start time from end time of each segment. Silent pauses were excluded from analysis if they were at the beginning or end of the audio or immediately following interviewer prompting.
Pitch tracking was performed with the Praat pitch tracker16 and an open source script17 modified by N.N. to extract fundamental frequency (f0) percentile estimates for each participant's speech segment. f0 is defined as the inverse of the longest period (repeated waveform) in a complex periodic signal. It is the closest physical measure correlating with perceived tone (pitch). Limits for pitch tracking were set at 75–300 Hz. These settings were selected after a preliminary trial using much wider settings and exploring the ranges of both men and women in both patient and HC groups. The goal was to use uniform criteria for processing all participants, regardless of sex, while keeping the margins narrow enough to minimize artefactual pitch estimates.
We extracted f0 estimates for the 10th through the 90th f0 percentiles for each speech segment and then calculated the mean f0 for each 10 percentile bin per participant. We repeated the analysis with larger percentile bins, including 20 and 30 percentile intervals, and found the same statistical results. We chose to report here the results with 10 percentile bins to show the most granular f0 data. We validated our automated f0 range against a blinded subjective assessment of limited vs normal prosody within the patient group. Objective classification as normal was defined by pitch range within the top 33rd percentile. We found no difference in the classification between automated pitch range measurement and subjective judgment (χ2 = 1.6, df = 1, p = 0.21).
The f0 data were converted from Hz to semitones (ST) with the following formula: ST = 12 × log2(f0/X), where X is each participant's own 10th f0 percentile. As an absolute measure of audio frequency, Hz is subject to individual confounds (see below). ST express pitch intervals in relation to an arbitrary baseline frequency, and thus more closely resemble human pitch perception, and are commonly used in music and speech analysis. We used ST in this analysis, centering on each participant's own 10th f0 percentile to control for individual pitch differences. This optimized examination of the f0 range since all first 10th percentiles were zeroed and the 90th percentiles in ST represent the range.
We identified 2 outliers in the bvFTD group and 1 in HC who had an f0 range differing from their group by >1.5 SD (spanning over 1 octave, or 12 ST). We inspected these 3 recordings and confirmed that the participants' voices had a creaky quality (a phenomenon sometimes referred to as vocal fry) throughout the recording. This led us to question the reliability of the pitch tracker in these cases, and so they were excluded from further analysis.
Statistical analysis.
Statistical tests were performed for between-group comparisons and within male and female subpopulations. Comparison of demographic data was performed with analysis of variance for continuous variables and χ2 test for categorical variables. Kernel density and Q-Q plots revealed that some of the speech variables diverged from normal distribution, thus we utilized the nonparametric Mann-Whitney test for group comparisons. Correlations of each of the social and executive scores with f0 range used Spearman method. All calculations were conducted in R (version 3.2.3) and RStudio (version 0.99.879).
Gray matter density analysis.
High-resolution structural brain MRIs were obtained on average within 2.6 ± 3.6 months of the speech sample. We used a previously published MRI acquisition and preprocessing algorithm to obtain an imaging dataset corresponding to the speech samples (see supplemental data). Gray matter (GM) atrophy mask was created by voxel-wise comparisons of the study cohort (HC vs bvFTD) with family-wise error correction and threshold-free cluster enhancement at p < 0.05 and cluster size k ≥200 voxels using Randomise in FSL. Regression analysis was performed with 10,000 permutations to control for type I errors. We associated f0 range, expressed as the 90th percentile in ST, to GM density using a p < 0.05 and cluster size threshold at k = 10 voxels. No covariates were included in the regression as none had a significant confounding effect.
Standard protocol approvals, registrations, and patient consents.
The study was approved by the local ethics committee (institutional review board) of the Hospital of the University of Pennsylvania. Written informed consent was obtained from all participants.
RESULTS
Speech analysis.
The f0 range was shallower on average in patients with bvFTD (mean 4.3 ± 1.8 ST) compared with HC (mean 5.8 ± 2.1 ST, U = 170, p = 0.03), as illustrated in figure 1. Subset analysis by sex revealed a reduction in f0 range in patients relative to HC in both sexes, but this phenomenon was more pronounced for male patients (figure 2).
Figure 1. Fundamental frequency percentiles per group.
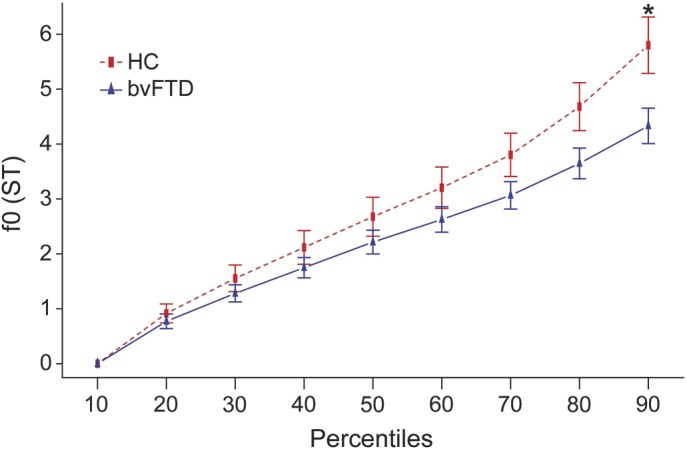
Fundamental frequency (f0) estimates in 10th percentile bins for healthy controls (HC) (n = 17) and behavioral variant of frontotemporal dementia (bvFTD) patient group (n = 32) with standard error bars. The f0 range is represented by the 90th percentile and is limited to 4.3 ± 1.8 semitones (ST) for the patient group compared to HC (5.8 ± 2.1 ST). *p = 0.03.
Figure 2. Fundamental frequency percentiles by group and sex.
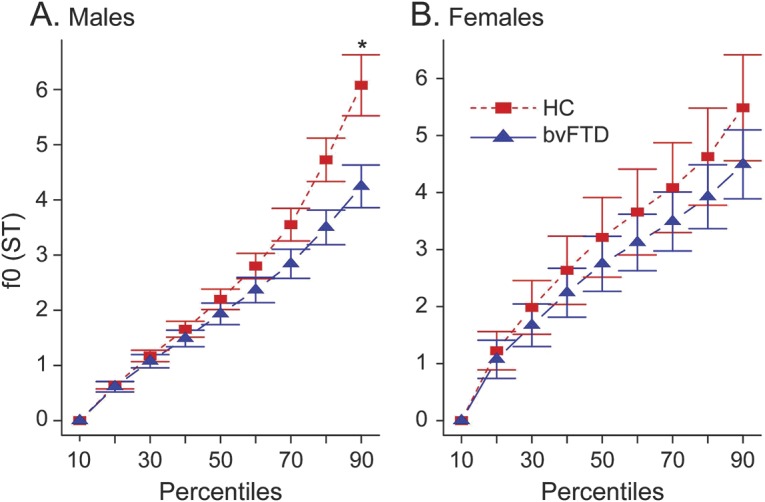
Fundamental frequency (f0) estimates in 10th percentile bins within sex subpopulations. (A) Decreased f0 range as represented by the 90th percentile f0 estimate in male patients with behavioral variant of frontotemporal dementia (bvFTD) compared to male healthy controls (HC) (*p = 0.01). (B) f0 range in female patients is only slightly limited compared to female HC with no statistical difference (p = 0.55). ST = semitones.
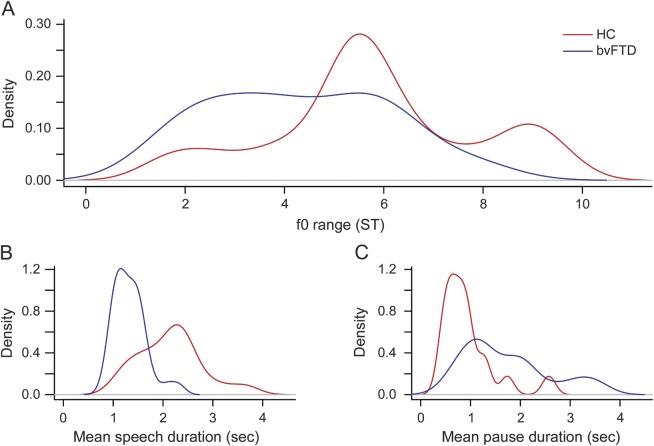
A density plot of f0 range (figure 3A) showed that HC are much more variable in their chosen pitch range, with 3 distinct subpopulations around 2, 6, and 9 ST. Patients with bvFTD exhibited only one subpopulation with a single broad peak (around 2–4 ST).
Figure 3. Speech measures distributions.
Kernel density plots for fundamental frequency (f0) range (A), speech segment (B), and pause segment (C) durations for patients with behavioral variant of frontotemporal dementia (bvFTD) vs healthy controls (HC). ST = semitones.
Mean speech segment duration differed significantly between HC (2.15 ± 0.64 seconds) and patients with bvFTD (1.33 ± 0.33 seconds, U = 476, p < 0.005) (figure 3B). However, there was no correlation between f0 range and mean speech duration within the bvFTD group (r = −0.19, p = 0.3) or the HC (r = 0.17, p = 0.5). Mean pause duration (figure 3C) also differed between HC (0.94 ± 0.54 seconds) and patients with bvFTD (1.73 ± 0.86 seconds, U = 101, p = 0.0002). Total speech-to-pause ratio was 2.84 ± 1.51 seconds and 1.02 ± 0.58 seconds for HC and patients with bvFTD, respectively (U = 477, p < 0.0001). Correlation of f0 range with behavioral measures, including NPI composite scores listed in table 1 and each of the individual NPI subscores, speech rate (words/min), and executive (F-letter fluency) scores, was performed within the bvFTD group. We found no correlation of these scores with f0 range (all p values >0.4).
Neuroimaging.
Patients with bvFTD showed significant bilateral frontotemporal atrophy (figure 4, blue). Figure 4 (heat map) also shows regression analysis of f0 range with GM atrophy involving left prefrontal, inferior frontal, orbital frontal, anterior cingulate, insula, and left fusiform and right inferior frontal gyri. Peak atrophy and regressions are summarized in table e-1.
Figure 4. Gray matter (GM) density analysis.
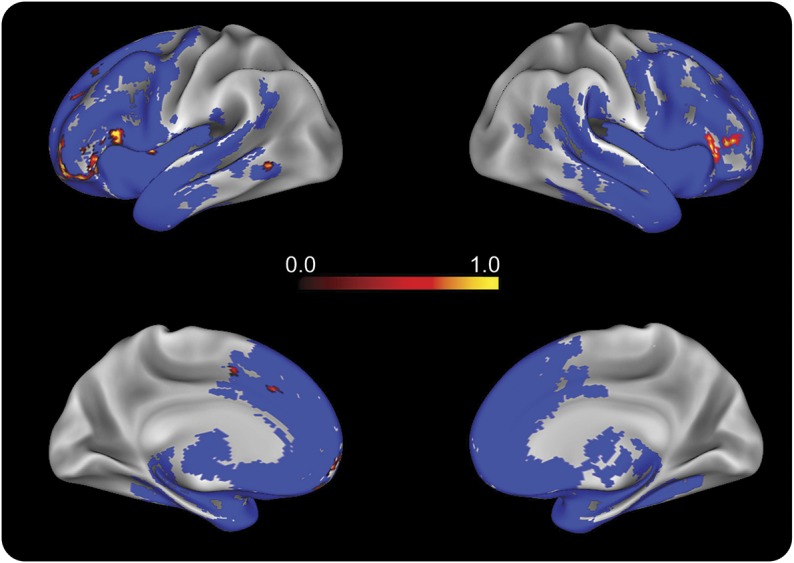
GM atrophy in the behavioral variant of frontotemporal dementia (bvFTD) patient group (n = 32) compared to the healthy control group (n = 17) is indicated in blue. Regression associating reduced f0 range with GM atrophy in patients with bvFTD is indicated with heat map representing voxel p value (analysis threshold was set at 0.05—refer to table e-1 for detailed peak voxels).
DISCUSSION
We found a limited range of f0 expression in a semi-structured speech sample from a large cohort of patients with bvFTD. The neuroanatomic basis for their deficit was centered in inferior frontal cortex bilaterally. These findings are consistent with the hypothesis that bvFTD may be associated with impaired prosodic expression, which can limit communicative efficacy in these patients. Moreover, since many social judgments of professionals and caregivers are based on vocal quality, this is a potentially important confound in assessments of bvFTD. We discuss each of these issues below.
Prosody is often associated with emotional expression, and also contributes to linguistic expression. Linguistic prosody is used to mark the end of declarative sentences with a lowering of pitch, for example, or the end of yes/no questions by a rising pitch. The picture description task used to elicit our speech samples has some emotional as well as propositional characteristics. Although most previous work assessing disorders of prosody has focused on emotional and receptive prosody,7,8,18,19 some investigations have noted expressive dysprosody for linguistic forms as well.20–22
Previous reports have described linguistic and acoustic analyses of spontaneous speech samples in patients with various neurodegenerative conditions.23–28 To our knowledge, the current study uniquely uses a novel, automated, and objective approach to demonstrate a reduction in pitch range, measured acoustically directly from digitized audio, in patients with bvFTD. We hypothesized that patients with bvFTD would be impaired in their ability to regulate their expressive prosody, coinciding with informal clinical observations of monotone speech in these patients. Speech characterized by a limited prosodic range may be interpreted by the listener as an indifferent or apathetic voice. Indeed, apathy has been reported to be a prominent symptom in this patient population, observed in over 80% of cases.9,29 Apathy in bvFTD has been associated with a social disorder and limited executive functioning in nonverbal behavior.29,30 In fact, f0 range did not correlate with any NPI subscore. One possibility is that dysprosody is at least in part independent of the rated neuropsychiatric symptoms, and a disorder of prosody may not necessarily reflect only a behavioral disorder. Our suprasegmental prosodic measurements may reflect in part subtle grammatical deficits previously described in bvFTD.4 However, we did not find a correlation between prosodic range and language measures. Our findings thus may be consistent with the hypothesis that prosodic control is a partially independent function that neither exclusively reflects commonly associated social–emotional changes such as apathy, depression, or vegetative dysfunction nor language limitations found in bvFTD. Additional work is needed to assess the basis of limited prosodic range in FTD using more specific linguistic and emotional materials.
Other explanations for limited f0 range in bvFTD may be related to potential physiologic confounds. The fundamental frequency is produced primarily by subglottal air pressure vibrating the vocal folds. A physiologic effect on f0 stems from the duration of the speech segment. These natural speech segments are often referred to by phoneticians as breath groups,31,32 since breathing is the strongest constraint on speech duration. Subglottal air pressure decreases throughout the breath group. This may cause a physiologic decrease in pitch, often used to explain the f0 declination phenomenon in phonetics research.33 More recent phonetic publications suggest a linguistic effect on f0 declination.34 We excluded patients with concomitant ALS to avoid the confound of respiratory weakness, and examined the correlation between f0 range and speech segment durations in our samples. The lack of correlation is inconsistent with the hypothesis that limited f0 range depends on a breathing or oral musculoskeletal mechanism.
Relatedly, individual physical attributes such as height and sex can have an effect on the mean f0 produced by a speaker.35 We observed a limited prosodic range in bvFTD, and this was more prominent in male patients (figure 2). Sex has a major effect on estimated f035,36: women typically have higher fundamental frequencies than men, and as a result may also seem to have a wider pitch range if measured in absolute frequency units, i.e., Hz. Our method of conversion to a relative ST scale minimizes this sex confound, and suggests that our f0 range is a genuine representation of limited prosody in patients from both sexes. Our sex analysis suggests a sex effect, making female patients' prosodic performance closer to sex-matched HC. This sex effect must be interpreted cautiously because of the small sample size and because 36% (4/11) of female patients had a limited f0 range (beyond 1 SD of HC). Evidence for a sex predominance in bvFTD is mixed.37 Nevertheless, a similar sex effect was recently observed in a dysfluency study of autism spectrum disorders.38 Additional work is needed to clarify the existence of sex effects in bvFTD.
We found that dysprosody in bvFTD is related to bilateral inferior frontal regions. Previously published anatomic correlates of dysprosody focused on linguistic dysprosody in left frontal and opercular injuries.20–22 Linguistic and emotional receptive prosody also was investigated in FTD presenting as primary progressive aphasia,7 and intonation discrimination difficulty was associated with left frontotemporal regions and the fusiform gyrus. The left inferior frontal gyrus (IFG) has been shown in a functional MRI study to be associated with processing of linguistic prosody tasks.39 Others suggested involvement of the right IFG in descriptions of impaired emotional prosody.8,40 Our findings coincide with these descriptions, as both hemispheres were associated with decreased prosody in our bvFTD cohort. While our work examines these frontal regions in the context of prosodic aspects of speech production, these same areas are also implicated in the social and behavioral disorders found in bvFTD.29 Additional work is needed to help us specify the role of these anatomic regions in the linguistic and social basis for dysprosody.
Strengths of our study include the large cohort of nonaphasic patients with bvFTD we examined, and the objective, automated method of speech analysis. Thus, we are introducing a novel analytic approach to speech production that may be useful in examination of naturalistic endpoints in therapeutic trials. This automated method is independent of the human labor of transcription and biases inherent in informal analyses, and produces robust markers for identifying pathologic prosody in bvFTD. Further study of psycholinguistic–acoustic measures will be valuable to the development of prosodic biomarkers.
Nevertheless, several limitations should be kept in mind when interpreting our findings. First, even though the group size is much larger than most previously reported in FTD studies, it is still statistically small. Second, we used a uniform source for speech sample production to control the topic of narrative expression, and it would be valuable to assess prosody using other samples including conversational and emotional speech. Third, several technical issues that limited data analysis and interpretation should be addressed. Some recordings were collected prior to development of the automated analysis, and thus were not controlled in terms of sound quality and acoustic properties such as sampling rate and bandwidth settings. Recording specifications did not allow for accurate comparison of speech intensity between participants. In addition, the properties of the SAD do not allow matching of acoustic data to subsegmental lexical elements such as syllables and words. Fourth, pitch trackers can only estimate the lowest periodicity per window, and are subject to many potential confounds resulting from background noise, specific vocal features (e.g., soft, creaky), and octave jumps in pitch. Some inaccuracy in f0 estimation can be avoided by applying optimal settings for pitch tracking. We tested the pitch settings by applying different settings for men (60–260 Hz) and women (90–400 Hz). The results were similar to the ones reported here.
With these caveats in mind, our findings suggest that prosodic regulation is impaired in patients with bvFTD. The disorder of prosody we observed is associated with specific cortical regions that are in turn linked to neural networks implicated in language production and social disorders.
Supplementary Material
GLOSSARY
- ALS
amyotrophic lateral sclerosis
- bvFTD
behavioral variant of frontotemporal dementia
- FTLD
frontotemporal lobar degeneration
- GM
gray matter
- HC
healthy controls
- IFG
inferior frontal gyrus
- NPI
Neuropsychiatric Inventory
- SAD
speech activity detector
- ST
semitones
Footnotes
Supplemental data at Neurology.org
Editorial, page 644
AUTHOR CONTRIBUTIONS
Naomi Nevler drafted/revised the manuscript for content, contributed to study concept/design, performed analysis/interpretation of the data, and performed statistical analysis. Sharon Ash contributed to acquisition of the data and revised the manuscript for content. Charles Jester contributed to analysis/interpretation of the data. David Irwin contributed to acquisition of the data. Mark Liberman contributed to analysis/interpretation of the data. Murray Grossman drafted/revised the manuscript for content, contributed to study concept/design, contributed to acquisition and analysis/interpretation of the data, obtained funding, and provided supervision.
STUDY FUNDING
Supported in part by the NIH (AG017586; AG038490; NS053488; AG053940; K23NS088341), the Wyncote Foundation, and the Newhouse Foundation.
DISCLOSURE
The authors report no disclosures relevant to the manuscript. Go to Neurology.org for full disclosures.
REFERENCES
- 1.Gunawardena D, Ash S, McMillan C, Avants B, Gee J, Grossman M. Why are patients with progressive nonfluent aphasia nonfluent? Neurology 2010;75:588–594. [DOI] [PMC free article] [PubMed] [Google Scholar]
- 2.Ash S, Moore P, Antani S, McCawley G, Work M, Grossman M. Trying to tell a tale: discourse impairments in progressive aphasia and frontotemporal dementia. Neurology 2006;66:1405–1413. [DOI] [PubMed] [Google Scholar]
- 3.Farag C, Troiani V, Bonner M, et al. Hierarchical organization of scripts: converging evidence from fMRI and frontotemporal degeneration. Cereb Cortex 2010;20:2453–2463. [DOI] [PMC free article] [PubMed] [Google Scholar]
- 4.Charles D, Olm C, Powers J, et al. Grammatical comprehension deficits in non-fluent/agrammatic primary progressive aphasia. J Neurol Neurosurg Psychiatry 2014;85:249–256. [DOI] [PMC free article] [PubMed] [Google Scholar]
- 5.Cousins KA, York C, Bauer L, Grossman M. Cognitive and anatomic double dissociation in the representation of concrete and abstract words in semantic variant and behavioral variant frontotemporal degeneration. Neuropsychologia 2016;84:244–251. [DOI] [PMC free article] [PubMed] [Google Scholar]
- 6.Hardy CJD, Buckley AH, Downey LE, et al. The language profile of behavioral variant frontotemporal dementia. J Alzheimer's Dis 2015;50:359–371. [DOI] [PMC free article] [PubMed] [Google Scholar]
- 7.Rohrer JD, Sauter D, Scott S, Rossor MN, Warren JD. Receptive prosody in nonfluent primary progressive aphasias. Cortex 2012;48:308–316. [DOI] [PMC free article] [PubMed] [Google Scholar]
- 8.Ross ED, Monnot M. Neurology of affective prosody and its functional-anatomic organization in right hemisphere. Brain Lang 2008;104:51–74. [DOI] [PubMed] [Google Scholar]
- 9.Rascovsky K, Hodges JR, Knopman D, et al. Sensitivity of revised diagnostic criteria for the behavioural variant of frontotemporal dementia. Brain 2011;134:2456–2477. [DOI] [PMC free article] [PubMed] [Google Scholar]
- 10.Gorno-Tempini ML, Hillis AE, Weintraub S, et al. Classification of primary progressive aphasia and its variants. Neurology 2011;76:1006–1014. [DOI] [PMC free article] [PubMed] [Google Scholar]
- 11.Cummings JL. The Neuropsychiatric Inventory. Neurology 1997;48(suppl 6):S10–S16. [DOI] [PubMed] [Google Scholar]
- 12.Goodglass H, Kaplan E, Weintraub S. Boston Diagnostic Aphasia Examination. Philadelphia: Lea & Febiger; 1983. [Google Scholar]
- 13.Ash S, Evans E, O'Shea J, et al. Differentiating primary progressive aphasias in a brief sample of connected speech. Neurology 2013;81:329–336. [DOI] [PMC free article] [PubMed] [Google Scholar]
- 14.LDC Hmm Speech Activity Detector (v 1.0.4) [computer program]. Philadelphia: University of Pennsylvania; 2013. [Google Scholar]
- 15.Praat: Doing Phonetics by Computer (v 5.4.11) [computer program]. Amsterdam: University of Amsterdam; 2013. [Google Scholar]
- 16.Boersma P. Accurate short-term analysis of the fundamental frequency and the harmonics-to-noise ratio of a sampled sound. Proc Inst Phonetic Sci 1993;17:97–110.
- 17.Collect_Pitch_Data_From_Files. Praat (v 4.7) [computer program]. Amsterdam: University of Amsterdam; 2003. [Google Scholar]
- 18.Leitman DI, Wolf DH, Ragland JD, et al. “It's not what you say, but how you say it”: a reciprocal temporo-frontal network for affective prosody. Front Hum Neurosci 2010;4:19. [DOI] [PMC free article] [PubMed] [Google Scholar]
- 19.Pichon S, Kell CA. Affective and sensorimotor components of emotional prosody generation. J Neurosci 2013;33:1640–1650. [DOI] [PMC free article] [PubMed] [Google Scholar]
- 20.Monrad-Krohn GH. Dysprosody or altered melody of language. Brain 1947;70:405–415. [DOI] [PubMed] [Google Scholar]
- 21.Danly M, Shapiro B. Speech prosody in Broca's aphasia. Brain Lang 1982;16:171–190. [DOI] [PubMed] [Google Scholar]
- 22.Aziz-Zadeh L, Sheng T, Gheytanchi A. Common premotor regions for the perception and production of prosody and correlations with empathy and prosodic ability. PLoS One 2010;5:e8759. [DOI] [PMC free article] [PubMed] [Google Scholar]
- 23.Bandini A, Giovannelli F, Orlandi S, et al. Automatic identification of dysprosody in idiopathic Parkinson's disease. Biomed Signal Process Control 2015;17:47–54. [Google Scholar]
- 24.Fraser KC, Meltzer JA, Graham NL, et al. Automated classification of primary progressive aphasia subtypes from narrative speech transcripts. Cortex 2014;55:43–60. [DOI] [PubMed] [Google Scholar]
- 25.Fraser KC, Meltzer JA, Rudzicz F. Linguistic features identify Alzheimer's disease in narrative speech. J Alzheimers Dis 2015;49:407–422. [DOI] [PubMed] [Google Scholar]
- 26.Pakhomov SV, Smith GE, Chacon D, et al. Computerized analysis of speech and language to identify psycholinguistic correlates of frontotemporal lobar degeneration. Cogn Behav Neurol 2010;23:165–177. [DOI] [PMC free article] [PubMed] [Google Scholar]
- 27.Rusz J, Cmejla R, Ruzickova H, Ruzicka E. Quantitative acoustic measurements for characterization of speech and voice disorders in early untreated Parkinson's disease. J Acoust Soc Am 2011;129:350–367. [DOI] [PubMed] [Google Scholar]
- 28.Vogel AP, Shirbin C, Churchyard AJ, Stout JC. Speech acoustic markers of early stage and prodromal Huntington's disease: a marker of disease onset? Neuropsychologia 2012;50:3273–3278. [DOI] [PubMed] [Google Scholar]
- 29.Massimo L, Powers C, Moore P, et al. Neuroanatomy of apathy and disinhibition in frontotemporal lobar degeneration. Dement Geriatr Cogn Disord 2009;27:96–104. [DOI] [PMC free article] [PubMed] [Google Scholar]
- 30.Massimo L, Powers JP, Evans LK, et al. Apathy in frontotemporal degeneration: neuroanatomical evidence of impaired goal-directed behavior. Front Hum Neurosci 2015;9:611. [DOI] [PMC free article] [PubMed] [Google Scholar]
- 31.Liberman P. Intonation, Perception, and Language. Cambridge: MIT Press; 1968. [Google Scholar]
- 32.Kent RD, Read C. The Acoustic Analysis of Speech. 2nd ed. Stamford, CT: Thomson Learning; 2002. [Google Scholar]
- 33.Collier R, Gelfer C. Physiological explanations of f0 declination. In: Van den BroeckeMPR, CohenA, eds. Proceedings of the 10th International Congress of Phonetic Sciences; Utrecht, the Netherlands; 1984.
- 34.Yuan J, Liberman M. F0 declination in English and Mandarin broadcast news speech. Speech Commun 2014;65:67–74. [Google Scholar]
- 35.Simpson AP. Phonetic differences between male and female speech. Lang Linguistics Compass 2009;3:621–640. [Google Scholar]
- 36.Sussman JE, Sapienza C. Articulatory, developmental, and gender effects on measures of fundamental frequency and jitter. J Voice 1994;8:145–156. [DOI] [PubMed] [Google Scholar]
- 37.Onyike CU, Diehl-Schmid J. The epidemiology of frontotemporal dementia. Int Rev Psychiatry 2013;25:130–137. [DOI] [PMC free article] [PubMed] [Google Scholar]
- 38.Parish-Morris J, Liberman M, Ryant N, et al. Exploring autism spectrum disorders using HLT. CLPsych 2016: The Third Computational Linguistics and Clinical Psychology Workshop; San Diego; January 2016. [DOI] [PMC free article] [PubMed] [Google Scholar]
- 39.Wildgruber D, Ackermann H, Kreifelts B, Ethofer T. Cerebral processing of linguistic and emotional prosody: fMRI studies. Prog Brain Res 2006;156:249–268. [DOI] [PubMed] [Google Scholar]
- 40.Pell MD. Fundamental frequency encoding of linguistic and emotional prosody by right hemisphere-damaged speakers. Brain Lang 1999;69:161–192. [DOI] [PubMed] [Google Scholar]
Associated Data
This section collects any data citations, data availability statements, or supplementary materials included in this article.


