
Figure 2.
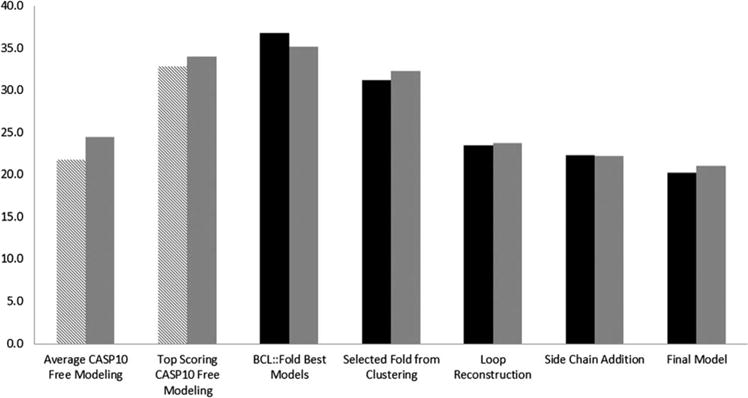
GDT_TS score analysis. Twenty FM targets from CASP10 (left two bars, pattern). Three targets folded also by BCL::Fold from FM category in CASP10 (left two bars, gray). All 18 targets folded by BCL::Fold (black). Three FM targets folded by BCL::Fold (right five bars, gray). The y axis represents GDT_TS score.