

Abstract
Background
The prognostic value of circulating polyunsaturated fatty acid (PUFA) levels is 4unclear.
Objectives
To determine the associations between red blood cell (RBC) PUFA levels and risk for death.
Methods
This prospective cohort study included 6501 women aged 65–80 who participated in the Women’s Health Initiative Memory Study (enrolment began 1996). RBC PUFA levels were measured at baseline and expressed as a percent of total RBC PUFAs. PUFAs of primary interest were the n-3 PUFAs eicosapentaenoic acid (EPA) and docosahexaenoic acid (DHA) and their sum (the Omega-3 Index). PUFA of secondary interest included the two major n-6 PUFAs, linoleic (LA) and arachidonic (ARA), and the PUFA Factor score (a calculated variable including 6 PUFAs that accounts for their inter-correlations). The primary outcome was total mortality through August 2014.
Results
After a median of 14.9 years of follow-up, 1851 (28.5%) women had died. RBC levels of EPA and DHA were higher in the survivors (p<0.002 for each). In the fully adjusted models, the hazard ratios (99% confidence intervals) for mortality associated with a 1-SD PUFA increase for total mortality were 0.92 (0.85, 0.98) for the Omega-3 Index, 0.89 (0.82, 0.96) for EPA, 0.93 (0.87, 1.0) for DHA, and 0.76 (0.64, 0.90) for the PUFA Factor score. There were no significant associations of alpha-linolenic acid or ARA or LA with total mortality.
Conclusions
Higher RBC levels of marine n-3 PUFAs were associated with reduced risk for all-cause mortality. These findings support the beneficial relationship between the Omega-3 Index and health outcomes.
ClinicalTrials.gov Identifier
NCT00000611 (WHIMS).
Keywords: epidemiology, prospective cohort study, eicosapentaenoic acid, docosahexaenoic acid, omega-3 fatty acids, omega-6 fatty acids
Graphical abstract
INTRODUCTION
Several recent studies have linked higher blood levels and/or dietary intakes of the long-chain n-3 polyunsaturated fatty acids (PUFAs) with greater longevity. The fact that the Japanese have both very high n-3 PUFA levels1, 2 and are among the longest-lived populations3 provides ecological support to this hypothesis. Red blood cell (RBC) levels of eicosapentaenoic acid (EPA) plus docosahexaenoic acid (DHA) are validated measure of n-3 PUFA status4, and this metric (called the Omega-3 Index for simplicity), has shown association with death from cardiovascular disease (CVD)5. In a previous investigation, the Omega-3 Index was inversely and independently related to the rate of telomere attrition, a marker of cellular aging6. Among past studies that examined the relations between PUFA biomarkers and risk for death4, 7–16 (Supplemental Table 1), most were conducted in Scandinavia, Europe or Taiwan, only three have been done in the US. In addition, only two4, 12 utilized red blood cells (RBCs), and both were performed in patients with known coronary heart disease (CHD). Hence the question remains open whether RBC PUFA levels are associated with risk for all-cause and cause-specific death in the general US population.
We recently analyzed the RBC PUFA composition in the Women’s Health Initiative Memory Study (WHIMS)17–19. This is by far the largest cohort in which these exposure markers have been measured with total mortality as an endpoint, hence we sought to explore the associations between the Omega-3 Index with total mortality, and included secondary analyses for death from CVD, cancer, and non-CVD, non-cancer (i.e., all other causes). As there have been concerns regarding the role of the n-6 PUFAs in health20, we also examined the associations with the major n-6 and n-3 FAs as well.
METHODS
Participants
The WHIMS randomized trial examined the effects of postmenopausal hormone therapy (HT) on cognitive function in women aged 65–80 years21. Recruitment began in 1996. There were 7299 enrolled in WHIMS with RBC FA measurements at baseline. The following were excluded: 17 were lost to follow-up, 213 had RBC FA data that was technically unusable22, and 568 were missing relevant covariates. A total of 6501 women, of whom 1851 (28.5%) died during follow up, were included in this analysis. All WHIMS participants gave informed consent, and Institutional Review Boards at all participating centers approved the study protocol.
Covariates and Mortality Outcomes
Participants self-reported demographic, health history, and lifestyle factors on standardized questionnaires at baseline. Variables and their definitions are given in Table 1. Aspirin use and medical histories were collected by self-report. Mortality outcomes included deaths from all causes; and those due to CVD, cancer, and all other causes. The WHI data were linked with the National Death Index of the National Center for Health Statistics. Causes of death were centrally adjudicated by trained physicians as described23. All women were followed from their date of enrollment to their date of death, or August 29, 2014, whichever came first.
Table 1.
Baseline characteristics by quartile of the Omega-3 Index.
| Omega-3 index (quartile) | |||||
|---|---|---|---|---|---|
| 1st | 2nd | 3rd | 4th | P value1 | |
| N | 1579 | 1597 | 1692 | 1633 | |
| Omega-3 Index (median, IQR) | 3.59% (3.14, 3.88) | 4.59% (4.39, 4.81) | 5.53% (5.27, 5.80) | 7.11% (6.55, 8.05) | |
| Age at baseline [years]: mean (SD) | 69.8 (3.9) | 70.0 (3.8) | 70.3 (3.8) | 70.4 (3.8) | <0.0001 |
| HT randomization arms: n (%) | <0.0001 | ||||
| Estrogen (E) - intervention | 305 (19.3) | 345 (21.6) | 347 (20.5) | 279 (17.1) | |
| E - control | 351 (22.2) | 320 (20.0) | 315 (18.6) | 289 (17.7) | |
| E+Progesterone (P) intervention | 478 (30.3) | 470 (29.4) | 523 (30.9) | 496 (30.4) | |
| E+P control | 445 (28.1) | 462 (28.9) | 507 (30.09) | 569 (34.8) | |
| Race: n (%) | <0.0001 | ||||
| Asian or Pacific Islander | 2 (0.1) | 14 (0.9) | 18 (1.1) | 83 (5.1) | |
| Black or African American | 42 (2.7) | 80 (5.0) | 132 (7.8) | 180 (11.0) | |
| Hispanic or Latino | 55 (3.5) | 41 (2.6) | 21 (1.2) | 23 (1.4) | |
| Non-Hispanic White | 1457 (92.3) | 1443 (90.4) | 1490 (88.1) | 1307 (80.0) | |
| Other | 23 (1.5) | 19 (1.2) | 31 (1.8) | 40 (2.5) | |
| Highest Education: n (%) | <0.0001 | ||||
| High School or Less | 561 (35.5) | 530 (33.2) | 441 (26.1) | 389 (23.8) | |
| Some College/Tech School | 658 (41.7) | 672 (42.1) | 718 (42.4) | 580 (35.5) | |
| Bachelor’s Degree | 221 (14.0) | 267 (16.7) | 304 (18.0) | 348 (21.3) | |
| Master’s Degree or Higher | 139 (8.8) | 128 (8.0) | 229 (13.5) | 316 (19.4) | |
| Body Mass Index [kg/m2]: n (%) | <0.0001 | ||||
| < 25 | 440 (27.9) | 432 (27.1) | 462 (27.3) | 581 (35.6) | |
| [25 – 30) | 563 (35.7) | 558 (34.9) | 675 (39.9) | 606 (37.1) | |
| [30 – 35) | 356 (22.6) | 380 (23.8) | 354 (20.9) | 320 (19.6) | |
| [35 – 40) | 150 (9.5) | 163 (10.2) | 146 (8.6) | 92 (5.6) | |
| ≥ 40 | 70 (4.4) | 64 (4.0) | 55 (3.3) | 34 (2.1) | |
| Waist circumference [cm]: mean (SD) | 89.4 (13.8) | 89.7 (13.6) | 88.6 (13.0) | 86.1 (12.4) | <0.0001 |
| Physical activity [METs/wk]: mean (SD) | 9.3 (12.3) | 10.6 (12.4) | 11.5 (13.0) | 14.1 (15.2) | <0.0001 |
| Alcohol >7 drinks/wk: n (%) | 153 (9.7) | 167 (10.5) | 218 (12.9) | 248 (15.2) | <0.0001 |
| Smoking pack-years: n (%) | <0.0001 | ||||
| Never smoking | 888 (56.2) | 890 (55.7) | 913 (54.0) | 822 (50.3) | |
| <10 | 216 (13.7) | 236 (14.8) | 285 (16.8) | 309 (18.9) | |
| [10 – 20) | 121 (7.7) | 112 (7.0) | 138 (8.2) | 168 (10.3) | |
| [20 – 30) | 92 (5.8) | 111 (7.0) | 119 (7.0) | 117 (7.2) | |
| [30 – 40) | 56 (3.6) | 58 (3.6) | 82 (4.9) | 65 (4.0) | |
| ≥ 40 | 206 (13.1) | 190 (11.9) | 155 (9.2) | 152 (9.3) | |
| Family history of cancer: n (%) | 1015 (64.3) | 1051 (65.8) | 1094 (64.7) | 1013 (62.0) | 0.2 |
| Family history of CVD: n (%) | 1105 (67.0) | 1136 (71.1) | 1171 (69.2) | 1112 (68.1) | 0.3 |
| Region of USA | <0.0001 | ||||
| Northeast | 304 (19.3) | 360 (22.5) | 481 (28.4) | 654 (40.1) | |
| South | 351 (22.2) | 364 (22.8) | 356 (21.0) | 279 (17.1) | |
| Midwest | 548 (34.7) | 445 (27.9) | 377 (22.3) | 204 (12.5) | |
| West | 376 (23.8) | 428 (26.8) | 478 (28.3) | 496 (30.4) | |
| Aspirin use: n (%) | 394 (25.0) | 430 (26.9) | 460 (27.2) | 437 (26.8) | 0.5 |
| Taking pills for cholesterol: n (%) | 236 (15.0) | 272 (17.0) | 288 (17.0) | 361 (22.1) | <0.0001 |
| Hypertension: n (%) | 776 (49.2) | 829 (51.9) | 796 (47.0) | 812 (49.7) | 0.048 |
| Diabetes: n (%) | 95 (6.0) | 121 (7.6) | 109 (6.4) | 95 (5.8) | 0.2 |
| Cardiovascular disease2: n (%) | 261 (16.5) | 276 (17.3) | 304 (18.0) | 282 (17.3) | 0.8 |
| History of Cancer: n (%) | 63 (4.0) | 63 (3.9) | 60 (3.6) | 48 (2.9) | 0.3 |
A Chi-squared test was used to evaluate differences for categorical variables, and a t-test or one-way ANOVA was used for continuous variables.
Yes to the question, “Has a doctor ever told you that you had heart problems, problems with your blood circulation, or blood clots?”
RBC Fatty Acid Analysis
RBC membrane FA composition was analyzed using gas chromatography and was expressed as a weight percent of total identified FAs 22. The inter-assay coefficient of variation for the primary PUFAs of interest here (see below) was <6.5%. During the aliquoting phase, the RBC samples were stored at -20°C for a period of approximately two weeks, causing oxidative degradation of the PUFAs before measurement. The original FA levels were estimated with multiple imputations as described. 22
Statistical analysis
The primary PUFAs of interest in this study were EPA, DHA, and the Omega-3 index. PUFA of secondary interest included alpha-linolenic acid (ALA), docosapentaenoic acid n-3 (DPAn-3), linoleic acid (LA), arachidonic acid (ARA), and two simple ratios (n-6/n-3 and ARA/EPA), and the PUFA factor score. The latter (specific to women) included a weighted combination of six RBC PUFAs: RBC PUFAs: 0.37*lnALA + 0.84*lnEPA + 0.80*DHA - 0.667*ARA - 0.814*adrenic - 0.788*DPAn-6)24. Accordingly, the PUFA factor score is more complex (because it accounts for inter-correlations among the PUFAs) but directionally inverse compared with the two ratios. Continuous variables were summarized using the mean ± SD and categorical variables were summarized using frequency (%). Student’s t-test, one-way ANOVA, and the Wilcoxon Rank sum test were used to compare continuous variables across groups. The chi square test was used to compare categorical variables across groups. Unadjusted cumulative hazard estimates of total mortality by PUFA quartiles were calculated by the Nelson-Aalen method. Cox proportional hazards regression models were used to calculate the association HR (99% CI) between RBC PUFAs and all-cause mortality (primary outcome), cancer mortality, CVD mortality and all other causes of death (secondary outcomes). HT treatment assignments (estrogen/placebo, or estrogen + progesterone/placebo) in the two WHIMS trials were included as four strata in the Cox regression models. The natural logarithms of the PUFAs were used to reduce skew (the PUFA Factor score was normally distributed), and then standardized to report the risk associated with a 1 standard deviation (SD) increase in each biomarker. Model 1 was adjusted for age and race. Model 2 was further adjusted for BMI, educational attainment, smoking pack-year, physical activity, weekly alcohol intake, waist circumference, region, family history of cancer, family history of CVD, and aspirin use. Model 3 was further adjusted for high cholesterol requiring pills (ever), hypertension, and diabetes, and is considered the fully-adjusted model. The sensitivity analyses included the exclusion of deaths that occurred in the first 2 years of follow-up (n=65), the exclusion of participants with prevalent CVD or cancer at baseline (n=1312), the stratification by use of aspirin and of cholesterol-lowering pills, and the additional inclusion of the normalized socioeconomic status in the fully adjusted models. In addition, the control and active hormone therapy groups were analyzed separately for associations between the Omega-3 Index and total mortality. A separate analysis of the Omega-3 Index and total mortality was conducted based on proposed clinical cut-points for this metric (<4%, 4%–8%, and >8%)5 in the fully adjusted model. To control somewhat for multiple testing, a critical level of 0.02 was used to determine a statistically significant association between the Omega-3 Index, RBC EPA, DHA and all-cause mortality. A critical value of 0.01 was used for all secondary analyses. Both critical values were chosen a priori to account for multiple testing. SAS (Cary, NC) version 9.4 was used for all analyses.
RESULTS
Cohort description
A comparison of the characteristics of the women who remained alive or died during the 14.9-year (median, 12.9–15.9) follow-up period are given in Supplemental Table 2. The women who died were about 2 years older at baseline, they were less active and smoked more, and they were more likely to have major risk factors for CVD (hypertension, diabetes). The most common sites for fatal cancers were lung (32%), colon (10%), multiple myeloma and breast (5.4% each). The most common causes of CVD mortality were definite or possible CHD (48%), and cerebrovascular disease (25%); and for other deaths, chronic obstructive pulmonary disease (11%), Alzheimer’s disease (10%), and other dementia (9%).
Participant characteristics by Omega-3 Index quartile are given in Table 1. A higher Omega-3 Index was associated with older age, having a uterus (i.e., being assigned to the estrogen+progesterone, as opposed to the estrogen-alone, arms), greater alcohol intake, higher education, more physical activity, more frequent use of cholesterol-lowering medications, less smoking, lower waist/BMI, and being non-Hispanic white. The Omega-3 Index was highest in the Northeast and lowest in the Midwest.
RBC PUFA and Total Mortality
The median levels of the Omega-3 Index (and its constituents and DPAn-3) were higher in the women who survived versus those who died (Table 2). There were no group-wise differences in median levels of LA, ALA, or ARA, but all metrics that included both n-3 and n-6 PUFAs differed significantly.
Table 2.
RBC fatty acids (percent of total) by mortality status at last contact (medians and interquartile ranges).
| Alive (n=4650) | Dead (n=1851) | ||||||
|---|---|---|---|---|---|---|---|
| Median | 25th | 75th | Median | 25th | 75th | P-value | |
| Omega-3 index (EPA+DHA) | 5.04 | 4.25 | 6.10 | 4.92 | 4.13 | 5.89 | 0.0003 |
| Eicosapentaenoic (EPA) | 0.64 | 0.50 | 0.83 | 0.61 | 0.48 | 0.78 | <0.0001 |
| Docosahexaenoic (DHA) | 4.40 | 3.68 | 5.31 | 4.31 | 3.61 | 5.14 | 0.0016 |
| Linoleic | 11.89 | 10.87 | 12.98 | 11.84 | 10.74 | 12.91 | 0.15 |
| PUFA Factor Score* | −6.75 | −6.98 | −6.49 | −6.81 | −7.03 | −6.56 | <0.0001 |
| Alpha-linolenic | 0.16 | 0.13 | 0.20 | 0.16 | 0.13 | 0.19 | 0.08 |
| Docosapentaenoic n-3 (DPAn-3) | 2.55 | 2.31 | 2.79 | 2.49 | 2.26 | 2.74 | <0.0001 |
| Arachidonic (ARA) | 17.06 | 15.94 | 18.08 | 17.03 | 15.93 | 18.12 | 0.98 |
| ARA/EPA ratio | 27.04 | 20.34 | 34.05 | 28.55 | 21.82 | 35.52 | <0.0001 |
| N-6/N-3 ratio | 6.88 | 5.89 | 7.85 | 7.03 | 6.05 | 7.97 | <0.0001 |
PUFA Factor score is a continuous metric derived as follows: The latter included a weighted combination of six RBC PUFAs: 0.37*lnALA + 0.84*lnEPA + 0.80*DHA - 0.667*ARA - 0.814*adrenic - 0.788*DPAn-624. Higher levels reflect more n-3 PUFAs and/or less n-6 PUFAs. Wilcoxon Rank Sums test was used to test for differences between groups. Critical levels for the primary PUFA metrics, p≤0.01. Significant p-values are shown in bold.
For total mortality, a 1-SD greater Omega-3 Index was associated with an 8% risk reduction in the fully-adjusted model (Table 3). Risk reductions of 7%–11% were seen for the three individual long-chain n-3 PUFAs (EPA, DHA, and DPAn-3). Similar findings held for all metrics that included these PUFAs, i.e., the PUFA Factor score, ARA/EPA and n-6/n-3 ratios. Neither of the n-6 PUFAs (LA or ARA) was related to mortality.
Table 3.
Multivariable-adjusted hazard ratios (99% CI) per 1-SD increase in red blood cell fatty acids for total mortality over 14.9 (median) years follow up from the fully adjusted modela.
| Model 1 | Model 2 | Model 3 | P-valueb | |
|---|---|---|---|---|
| Omega-3 index (EPA+DHA) | 0.90 (0.84, 0.96) | 0.92 (0.85, 0.98) | 0.92 (0.85, 0.98) | 0.0015 |
| Eicosapentaenoic (EPA) | 0.87 (0.81, 0.93) | 0.88 (0.82, 0.95) | 0.89 (0.82, 0.96) | <.0001 |
| Docosahexaenoic (DHA) | 0.91 (0.85, 0.98) | 0.93 (0.87, 1.00) | 0.93 (0.87, 1.00) | 0.0099 |
| Linoleic Acid | 0.97 (0.91, 1.04) | 0.99 (0.92, 1.06) | 0.99 (0.93, 1.06) | 0.8286 |
| PUFA Factor Scorec | 0.74 (0.63, 0.86) | 0.77 (0.65, 0.91) | 0.77 (0.66, 0.91) | <.0001 |
| Alpha-linolenic | 0.97 (0.9, 1.04) | 0.98 (0.91, 1.05) | 0.98 (0.91, 1.05) | 0.3689 |
| Docosapentaenoic n-3 | 0.91 (0.84, 0.97) | 0.93 (0.86, 1.00) | 0.93 (0.86, 1.00) | 0.014 |
| Arachidonic (ARA) | 1.00 (0.91, 1.09) | 1.00 (0.92, 1.08) | 1.00 (0.92, 1.08) | 0.8956 |
| ARA/EPA ratio | 1.14 (1.06, 1.23) | 1.12 (1.03, 1.22) | 1.12 (1.03, 1.21) | 0.0004 |
| N-6/N-3 ratio | 1.13 (1.04, 1.22) | 1.10 (1.02, 1.19) | 1.10 (1.02, 1.19) | 0.0021 |
Model 1 adjusted for age, race, HT assignment. Model 2 added BMI, highest education, smoking pack-year, physical activity, weekly alcohol intake, waist circumference, region, family history of cancer, family history of CVD, and aspirin use. Model 3 (fully adjusted) added high cholesterol requiring pills (ever), and a history of hypertension, diabetes, cardiovascular disease and/or cancer.
For model 3; critical values for the Omega-3 Index, EPA and DHA were set a priori at <0.02; for all other metrics in the Table, <0.01. P-values in bold are significant.
See Table 2.
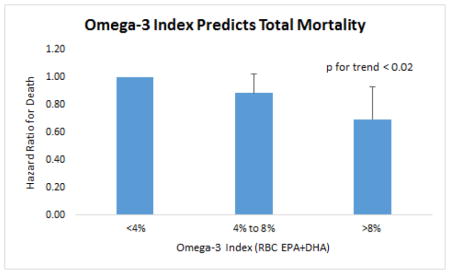
Cumulative Nelson-Aalen unadjusted hazard estimates of total mortality by quartiles of the Omega-3 Index and the PUFA factor score are shown in Figure 1. Fully adjusted hazard ratios by quartile are shown in Figure 2 for the Omega-3 Index, EPA, DHA, LA and the PUFA factor. Significant (<0.01) trends were observed for all but LA. Risk for death from any cause was significantly lower at an Omega-3 Index >8% vs <4% (HR, 0.69; 95% CI 0.52 to 0.93, p=0.017), and the trend across the 3 categories (<4%, 4–8% and >8%) was significant (p=0.019) (Supplemental Figure 1).
Figure 1.

Cumulative Nelson-Aalen unadjusted hazard estimates of total mortality by quartiles of baseline omega-3 index (left) and PUFA Factor score (right). Log Rank p-value <0.001 for both. The numbers of participants at risk at each biennial examination are shown.
Figure 2.

Fully Adjusted HRs for Total Mortality by Quartile of Selected RBC PUFA. Error bars are 95% CIs, and p-values for trends are given above the columns.
In sensitivity analyses (Supplemental Table 3) none of the associations observed in the fully adjusted model were altered by excluding deaths in the first two years, or after excluding participants with a history of CVD or cancer [except the association with DHA was attenuated (p>0.01)]. A stratified analysis with those women not taking aspirin revealed statistically significant a protective effect between Omega-3 Index, EPA, the PUFA factor score, the two ratios and all-cause mortality in the fully adjusted model, but no association was seen with the smaller number of women who were taking aspirin. An additional sensitivity analysis was done for use of cholesterol-lowering drugs. The HRs (99% CI) for the 5344 not taking these drugs was 0.92 (0.85, 1) and 0.90 (0.76, 1.07) for the 1157 who were. The association between the Omega-3 Index and all-cause mortality in each HT treatment arm was examined. HRs (99% CIs) were 0.91 (0.82, 1.0) in the control arm and 0.93 (0.84, 1.0) in the active arm (P for interaction =.93). Finally, the addition of socioeconomic status to the fully adjusted model for all-cause mortality did not materially affect the HR (0.92 to 0.92), nor did stratification by college degree or race (non-Hispanic white or not).
RBC Polyunsaturated Fatty Acids and Cause-Specific Mortality
Associations between PUFAs and CVD mortality, cancer mortality, and death from all other causes were examined only in the fully-adjusted models. Only EPA was significantly (p<0.01) associated with CVD mortality with an HR (99% CIs) of 0.88 (0.77, 1.00) (Supplemental Table 4). The lowest HR was seen with the PUFA Factor score which was marginally significant [0.76 (0.57, 1.01), p=0.012)].
DISCUSSION
In this study of older post-menopausal women, the baseline Omega-3 Index was significantly lower in those who died during follow-up than those who did not. The same is true for the two components of the Index, EPA and DHA, as well as for DPAn-3 and for all metrics that included n-3 PUFA levels. Since neither of the n-6 PUFAs examined here (LA or ARA) were related with vital status, the differences in summary ratios were primarily influenced by the n-3 PUFA components. These findings were robust in four sensitivity analyses. In secondary analyses by cause of death, EPA was inversely associated with risk for CVD death, but DHA was not, and a higher PUFA factor score correlated with lower risk for non-CVD, non-cancer deaths.
Several previous studies linking n-3 PUFA with total mortality (including the present one) are summarized are in Supplemental Table 1 where they are categorized as epidemiologic (using diet, supplement use, and circulating biomarker as exposure indicators), and as randomized trials. In general, n-3 PUFA exposures based on dietary records (citations in the Table) have been inconsistently associated with reduced mortality, however all three studies based on reported fish oil use reported lower death rates with n-3 PUFA supplementation. In nine biomarker-based studies, total mortality was inversely associated with n-3 PUFA levels in eight of the nine studies that addressed the question. The only exception was a small, case-control study where cholesteryl ester FA composition was used as the biomarker of exposure8. This study may have failed to find an association because, of all the lipid classes, this is the only one where DHA is present at lower levels than EPA, and where fish oil feeding has the least effect on DHA levels25. Among the other n-3 PUFAs of interest, neither ALA nor DPAn-3 were significantly related to overall mortality, although the HR for the latter (0.94, p<0.014) was very close to the critical value of <0.01. Previous studies have also observed inverse associations between risk for CVD death and DPAn-3 and ALA26 . In light of this and other prior reports (e.g. in heart failure27), our observations can be considered supportive of a beneficial association between DPAn-3 and total mortality. Our null findings for ALA agree with some previous studies8, 14, but ALA levels have been associated with CVD death26, and ALA intake was associated with reduced total mortality in a large RCT from Spain28.
N-6 PUFA
As regards the other PUFAs of interest in this study, LA was not related to any mortality outcome. This contrasts with the findings of three other studies7–9 that showed inverse associations with total mortality using plasma cholesteryl ester, phospholipid or total lipid LA levels as exposure markers. The different PUFA pools used in these studies may be part of the explanation for this inconsistency. The correlation between RBC LA and plasma phospholipid LA is 0.71, and cholesteryl ester LA is 0.65 (compared with 0.93 and 0.83, respectively for EPA+DHA; unpublished data) might explain why our data agree with theirs for the n-3 PUFAs but not for LA. In a prior study involving many sample types, LA levels were related to non-fatal, but not fatal CVD events29. In addition, Wu et al. found plasma phospholipid levels of LA (but not ARA) were related to total and CVD mortality in the Cardiovascular Health Study7. The ARA (and long chain n-3 PUFA) findings comport with ours, but their LA data do not. The basis for these inconsistent findings is unknown.
Combined PUFA metrics
Of the composite PUFA metrics, the PUFA factor score, a complex calculation combining both n-3 and n-6 PUFAs, was associated more strongly with total mortality than any of the other RBC PUFA metrics examined here. This metric was derived by Pottala et al. via structural equation modeling using RBC PUFA data from the Framingham Offspring cohort24. These findings imply that care must be taken to include the right FAs in a combined metric. For example, LA – which is a major driver of the n-6:n-3 ratio – is not in the PUFA Factor score, and this may have contributed to the superior predictive power of this metric. The reason for this may be that LA is actually protective (based on the findings of 4 previous studies7–9, 14; it was neutral in the present study), not harmful; and to include a “protective” FA in with other “harmful” FAs in the same term (total n-6) adds unnecessary noise and obscures the signal. The fact that the simpler ARA/EPA metric had similar predictive power as the n6:n3 ratio despite its non-inclusion of LA, suggests that the other FAs in the Factor score that are not present in this simple ratio (e.g., DHA, and the longer-chain products of ARA) appear to contribute to its improved predictive value. The other difference between the PUFA Factor score and these simpler ratios is the weights given to the FAs. In the former, specific weight-based on intercorrelations (that were sex-specific) were derived experimentally, whereas in the latter ratios, all FAs are essentially given the same weight. These are but two of the many problems with metrics like the n-6:n-3 ratio30. Further studies with the PUFA Factor score are clearly needed.
Cause specific mortality
Many studies have documented reduced CVD risk associated with higher n-3 PUFA intakes and/or circulating levels31. In the present study, we found non-significant associations (p>0.01) with the Omega-3 Index and its major component, DHA, but a significant 12% reduction in CVD mortality per SD increase in EPA levels, and a 25% reduction for the PUFA factor score. This finding is consistent with a previous study in post-MI patients where RBC EPA, but not DHA, levels significantly improved prediction of 2-year mortality over a composite risk algorithm12. On the other hand, both EPA and DHA were associated with lower CVD mortality in another study of elderly individuals in the US10. This study measured plasma phospholipid n-3 PUFAs and included elderly men and women. It seems unlikely that the differences in participant characteristics and PUFA biomarker measurements can explain the divergent results. We observed no significant associations between RBC n-3 PUFA and cancer mortality. Few others have examined associations between long-chain n-3 PUFA or fish intake and cancer mortality32–34. In the only prior study using long-chain n-3 PUFA biomarkers, there was a significant inverse relation between plasma phospholipid DPA and cancer mortality, but none for EPA or DHA10. Three prospective cohorts examined dietary plus supplements of n-3 PUFA34 or fish intake and cancer mortality32, 33. n-3 PUFA intake was inversely associated with cancer death, whereas no association was seen with fish intake. Here, the HRs for deaths from causes other than CVD and cancer were marginally significantly inversely associated with the PUFA factor score, the Omega-3 Index and its component PUFAs.
Mechanisms that explain the associations between higher RBC n-3 PUFA and improved longevity are not clearly understood, but there are beneficial effects of n-3 PUFA on a variety of CV risk factors that may be involved. These include reductions in serum triglyceride levels35, blood pressure36, platelet aggregation37, heart rate38, susceptibility to ventricular fibrillation (in some settings)39, inflammatory markers40, 41, plaque vulnerability42, 43 along with improvements in endothelial function44. The observation that whole blood EPA+DHA levels are independently associated with slower rates of telomere shortening6, a purported marker of “cellular aging,” is yet another favorable biomarker relationship, but it is not a molecular mechanism.
It is of interest to consider how much EPA+DHA one might have to consume to increase the Omega-3 Index from Q1 (median 3.6%) to Q4 (7.1%). Based on a recent dose – response study45, such an increase would be expected from an increase of about 1 g of EPA+DHA per day. To achieve this daily intake of EPA+DHA (which is similar to the mean intake in Japan in 199046) would require the daily consumption of about 2–3 oz. of salmon or about a pound of lower-fat seafood like chunk light tuna, shrimp or flounder. Alternatively, 3 standard (300 mg EPA+DHA) fish oil pills per day would suffice. Several early omega-3 RCTs used roughly this dose and reported reduced total mortality47–49, whereas other more recent studies at the same dose have not confirmed this finding50–52.
The question of whether increased intakes of EPA+DHA will prolong life remains unsettled. Clearly observational studies alone cannot answer the question of whether higher (vs lower) n-3 PUFA tissue levels (as reflected by the Omega-3 Index53–55) will, over the long-term, lower risk for death. Though early randomized controlled trials with n-3 PUFAs found reduced overall mortality47, 48, other more recent studies51, 52, 56, 57 have not. Some of the potential reasons why these studies may have failed (e.g., better acute medical interventions, pervasive use of statins58, short follow-up periods, low doses, etc.), have been reviewed59, 60. At present, there are four major n-3 PUFA RCTs ongoing: The Reduction of Cardiovascular Events with EPA 3 Intervention Trial (REDUCE-IT, Clinicaltrials.com code NCT01492361), Statin Residual Risk Reduction with Epanova in High Cardiovascular Risk Patients with Hypertriglyceridemia (STRENGTH, NCT02104817), the Vitamin D and Omega-3 Trial (VITAL, NCT0116925961), and A Study of Cardiovascular Endpoints in Diabetes (ASCEND, NCT00135226). The details of each trial have been recently summarized62. Of these event-driven trials, REDUCE-IT and STRENGTH are testing pharmacological dose (2–4 g/day) of EPA (4 g/day) or EPA+DHA carboxylic acids, respectively, for 4–6 years in patients with hypertriglyceridemia and on statin. ASCEND and VITAL are both primary prevention, 2x2 factorial trials testing, in the former, the effects of 700 mg of EPA+DHA per day (with or without aspirin) on CVD endpoints in about 15,000 patients with diabetes; and in the latter, the effects of 840 mg of EPA+DHA per day (with or without vitamin D) on CVD and cancer endpoints in about 25,000 adults. Results of these studies will further our understanding of the role that n-3 PUFA may play in health outcomes.
Strengths and Limitations
Strengths of this study include the large sample size and number of events, the unambiguous nature of the primary endpoint, and the use of an objective biomarker of PUFA exposure with low biological variability63. Limitations would include the unique nature of the study population - postmenopausal women, average age 70, participating in a RCT – which may limit the generalizability of our findings. The assessment of PUFA exposure at only one-time point cannot capture PUFA status changes throughout follow-up, and the aforementioned need to remediate the RBC PUFA data22 added variability to the exposure marker, diminishing our ability to separate signal from noise. The two major factors that determine n-3 and n-6 PUFA levels – dietary PUFA intake and variants in FA desaturase and elongase genes - were not explored here, in part because they were beyond the scope of this study, but also because of their own inherent limitations. Estimated PUFA intakes derived from food records are inferior to circulating PUFA levels as indicators of PUFA exposure64, 65, and the effects of genetic variants on PUFA levels, while substantial for ARA66, are minimal to non-existent for EPA and DHA67. Finally, the inability to rule out the possibility of residual or unmeasured confounding also precludes inferences about causality68.
In conclusion, we found that higher RBC levels of n-3 PUFAs were associated with greater longevity in post-menopausal women. These findings, in the context of the totality of available evidence on this subject, provide support for a role of n-3 PUFAs in reducing the risk for death across a spectrum of causes.
Supplementary Material
Highlights.
Relations between RBC fatty acids and total mortality were studied in 6501 women.
Multi-variable adjusted odds ratios per 1-SD increase in FA levels were calculated.
There was an 8% reduction in risk associated with higher EPA+DHA levels.
RBC omega-3 FA content is a significant predictor of all-cause mortality.
Acknowledgments
The authors wish to thank Jason Polreis (OmegaQuant Analytics, LLC) for performing the RBC fatty acid analyses.
Footnotes
Financial Support: National Heart Lung and Blood Institute, Broad Area Announcement 19. The sponsor had no role in study design, study conduct, data analysis or manuscript preparation.
Conflict of Interest Disclosures: WSH is the President of OmegaQuant Analytics, LLC where the RBC fatty acid analyses were performed. None of the other authors have any potential conflicts to disclose
Online supporting materials found at (link)
Abbreviations: ALA, alpha-linolenic acid; ARA, arachidonic acid; CVD, cardiovascular disease; DHA, docosahexaenoic acid; DPA, docosapentaenoic acid; EPA, eicosapentaenoic acid; FA, fatty acid; HR, hazard ratio; HT, hormone therapy; LA, linoleic acid; Omega-3 Index, erythrocyte EPA+DHA; PUFA, polyunsaturated FA; RBC, red blood cell; SD, standard deviation; WHIMS, Women’s Health Initiative Memory Study
Author Contributions: WSH wrote the original grant that supported the laboratory analysis of the blood samples and wrote the first draft of the manuscript. JL and JPV analyzed the data and assisted with manuscript preparation; MAE and JGR collaborated on the original grant submission and reviewed/edited the manuscript. KLM, JEM, LW and TMB provided substantive input for manuscript revisions. All authors have read and approved the final manuscript.
Publisher's Disclaimer: This is a PDF file of an unedited manuscript that has been accepted for publication. As a service to our customers we are providing this early version of the manuscript. The manuscript will undergo copyediting, typesetting, and review of the resulting proof before it is published in its final citable form. Please note that during the production process errors may be discovered which could affect the content, and all legal disclaimers that apply to the journal pertain.
References
- 1.Itomura M, Fujioka S, Hamazaki K, et al. Factors influencing EPA+DHA levels in red blood cells in Japan. In Vivo. 2008;22:131–135. [PubMed] [Google Scholar]
- 2.Ogura T, Takada H, Okuno M, et al. Fatty acid composition of plasma, erythrocytes and adipose: their correlations and effects of age and sex. Lipids. 2010;45:137–144. doi: 10.1007/s11745-010-3386-3. [DOI] [PubMed] [Google Scholar]
- 3.CIA. Country Comparison of Life Expectancy at Birth. 2011 https://www.cia.gov/library/publications/the-world-factbook/rankorder/2102rank.html.
- 4.Pottala JV, Garg S, Cohen BE, Whooley MA, Harris WS. Blood Eicosapentaenoic and Docosahexaenoic Acids Predict All-Cause Mortality in Patients With Stable Coronary Heart Disease: The Heart and Soul Study. Circ Cardiovasc Qual Outcomes. 2010;3:406–412. doi: 10.1161/CIRCOUTCOMES.109.896159. [DOI] [PMC free article] [PubMed] [Google Scholar]
- 5.Harris WS, von Schacky C. The Omega-3 Index: a new risk factor for death from coronary heart disease? Prev Med. 2004;39:212–220. doi: 10.1016/j.ypmed.2004.02.030. [DOI] [PubMed] [Google Scholar]
- 6.Farzaneh-Far R, Lin J, Epel ES, Harris WS, Blackburn EH, Whooley MA. Association of marine omega-3 fatty acid levels with telomeric aging in patients with coronary heart disease. JAMA. 2010;303:250–257. doi: 10.1001/jama.2009.2008. [DOI] [PMC free article] [PubMed] [Google Scholar]
- 7.Wu JH, Lemaitre RN, King IB, et al. Circulating omega-6 polyunsaturated fatty acids and total and cause-specific mortality: the Cardiovascular Health Study. Circulation. 2014;130:1245–1253. doi: 10.1161/CIRCULATIONAHA.114.011590. [DOI] [PMC free article] [PubMed] [Google Scholar]
- 8.Warensjo E, Sundstrom J, Vessby B, Cederholm T, Riserus U. Markers of dietary fat quality and fatty acid desaturation as predictors of total and cardiovascular mortality: a population-based prospective study. Am J Clin Nutr. 2008;88:203–209. doi: 10.1093/ajcn/88.1.203. [DOI] [PubMed] [Google Scholar]
- 9.Laaksonen DE, Nyyssonen K, Niskanen L, Rissanen TH, Salonen JT. Prediction of cardiovascular mortality in middle-aged men by dietary and serum linoleic and polyunsaturated fatty acids. Arch Intern Med. 2005;165:193–199. doi: 10.1001/archinte.165.2.193. [DOI] [PubMed] [Google Scholar]
- 10.Mozaffarian D, Lemaitre RN, King IB, et al. Plasma phospholipid long-chain omega-3 fatty acids and total and cause-specific mortality in older adults: a cohort study. Annals of internal medicine. 2013;158:515–525. doi: 10.7326/0003-4819-158-7-201304020-00003. [DOI] [PMC free article] [PubMed] [Google Scholar]
- 11.Lindberg M, Saltvedt I, Sletvold O, Bjerve KS. Long-chain n-3 fatty acids and mortality in elderly patients. Am J Clin Nutr. 2008;88:722–729. doi: 10.1093/ajcn/88.3.722. [DOI] [PubMed] [Google Scholar]
- 12.Harris WS, Kennedy KF, O'Keefe JH, Jr, Spertus JA. Red blood cell fatty acid levels improve GRACE score prediction of 2-yr mortality in patients with myocardial infarction. International journal of cardiology. 2013;168:53–59. doi: 10.1016/j.ijcard.2012.09.076. [DOI] [PMC free article] [PubMed] [Google Scholar]
- 13.Chien KL, Lin HJ, Hsu HC, et al. Comparison of predictive performance of various fatty acids for the risk of cardiovascular disease events and all-cause deaths in a community-based cohort. Atherosclerosis. 2013;230:140–147. doi: 10.1016/j.atherosclerosis.2013.06.015. [DOI] [PubMed] [Google Scholar]
- 14.Marklund M, Leander K, Vikstrom M, et al. Polyunsaturated Fat Intake Estimated by Circulating Biomarkers and Risk of Cardiovascular Disease and All-Cause Mortality in a Population-Based Cohort of 60-Year-Old Men and Women. Circulation. 2015;132:586–594. doi: 10.1161/CIRCULATIONAHA.115.015607. [DOI] [PubMed] [Google Scholar]
- 15.Eide IA, Jenssen T, Hartmann A, et al. The association between marine n-3 polyunsaturated fatty acid levels and survival after renal transplantation. Clin J Am Soc Nephrol. 2015;10:1246–1256. doi: 10.2215/CJN.11931214. [DOI] [PMC free article] [PubMed] [Google Scholar]
- 16.Kleber ME, Delgado GE, Lorkowski S, Marz W, von Schacky C. Omega-3 fatty acids and mortality in patients referred for coronary angiography. The Ludwigshafen Risk and Cardiovascular Health Study. Atherosclerosis. 2016;252:175–181. doi: 10.1016/j.atherosclerosis.2016.06.049. [DOI] [PubMed] [Google Scholar]
- 17.Pottala JV, Yaffe K, Robinson JG, Espeland MA, Wallace R, Harris WS. Higher RBC EPA + DHA corresponds with larger total brain and hippocampal volumes: WHIMS-MRI Study. Neurology. 2014;82:435–442. doi: 10.1212/WNL.0000000000000080. [DOI] [PMC free article] [PubMed] [Google Scholar]
- 18.Ammann EM, Pottala JV, Harris WS, et al. Omega-3 fatty acids and domain-specific cognitive aging: Secondary analyses of data from WHISCA. Neurology. 2013;81:1484–1491. doi: 10.1212/WNL.0b013e3182a9584c. [DOI] [PMC free article] [PubMed] [Google Scholar]
- 19.Persons JE, Robinson JG, Ammann EM, et al. Omega-3 fatty acid biomarkers and subsequent depressive symptoms. Int J Geriatr Psychiatry. 2013 doi: 10.1002/gps.4058. [DOI] [PMC free article] [PubMed] [Google Scholar]
- 20.Bazinet RP, Chu MW. Omega-6 polyunsaturated fatty acids: is a broad cholesterol-lowering health claim appropriate? CMAJ : Canadian Medical Association journal = journal de l'Association medicale canadienne. 2014;186:434–439. doi: 10.1503/cmaj.130253. [DOI] [PMC free article] [PubMed] [Google Scholar]
- 21.Shumaker SA, Reboussin BA, Espeland MA, et al. The Women's Health Initiative Memory Study (WHIMS): a trial of the effect of estrogen therapy in preventing and slowing the progression of dementia. Controlled clinical trials. 1998;19:604–621. doi: 10.1016/s0197-2456(98)00038-5. [DOI] [PubMed] [Google Scholar]
- 22.Pottala JV, Espeland MA, Polreis J, Robinson J, Harris WS. Correcting the Effects of -20 degrees C Storage and Aliquot Size on Erythrocyte Fatty Acid Content in the Women's Health Initiative. Lipids. 2012;47:835–846. doi: 10.1007/s11745-012-3693-y. [DOI] [PubMed] [Google Scholar]
- 23.Curb JD, McTiernan A, Heckbert SR, et al. Outcomes ascertainment and adjudication methods in the Women's Health Initiative. Annals of epidemiology. 2003;13:S122–128. doi: 10.1016/s1047-2797(03)00048-6. [DOI] [PubMed] [Google Scholar]
- 24.Pottala JV, Djira GD, Espeland MA, Ye J, Larson MG, Harris WS. Structural equation modeling for analyzing erythrocyte fatty acids in Framingham. Computational and mathematical methods in medicine. 2014 doi: 10.1155/2014/160520. ID:160520. [DOI] [PMC free article] [PubMed] [Google Scholar]
- 25.Browning LM, Walker CG, Mander AP, et al. Incorporation of eicosapentaenoic and docosahexaenoic acids into lipid pools when given as supplements providing doses equivalent to typical intakes of oily fish. Am J Clin Nutr. 2012;96:748–758. doi: 10.3945/ajcn.112.041343. [DOI] [PMC free article] [PubMed] [Google Scholar]
- 26.Del Gobbo LC, Imamura F, Aslibekyan S, et al. omega-3 Polyunsaturated Fatty Acid Biomarkers and Coronary Heart Disease: Pooling Project of 19 Cohort Studies. JAMA internal medicine. 2016 doi: 10.1001/jamainternmed.2016.2925. [DOI] [PMC free article] [PubMed] [Google Scholar]
- 27.Mozaffarian D, Lemaitre RN, King IB, et al. Circulating long-chain omega-3 fatty acids and incidence of congestive heart failure in older adults: the cardiovascular health study: a cohort study. Annals of internal medicine. 2011;155:160–170. doi: 10.1059/0003-4819-155-3-201108020-00006. [DOI] [PMC free article] [PubMed] [Google Scholar]
- 28.Sala-Vila A, Guasch-Ferre M, Hu FB, et al. Dietary alpha-Linolenic Acid, Marine omega-3 Fatty Acids, and Mortality in a Population With High Fish Consumption: Findings From the PREvencion con DIeta MEDiterranea (PREDIMED) Study. Journal of the American Heart Association. 2016:5. doi: 10.1161/JAHA.115.002543. [DOI] [PMC free article] [PubMed] [Google Scholar]
- 29.Harris WS, Poston WC, Haddock CK. Tissue n-3 and n-6 fatty acids and risk for coronary heart disease events. Atherosclerosis. 2007;193:1–10. doi: 10.1016/j.atherosclerosis.2007.03.018. [DOI] [PubMed] [Google Scholar]
- 30.Harris WS. The omega-6/omega-3 ratio and cardiovascular disease risk: uses and abuses. Curr Atheroscler Rep. 2006;8:453–459. doi: 10.1007/s11883-006-0019-7. [DOI] [PubMed] [Google Scholar]
- 31.Chowdhury R, Warnakula S, Kunutsor S, et al. Association of dietary, circulating, and supplement fatty acids with coronary risk: a systematic review and meta-analysis. Annals of internal medicine. 2014;160:398–406. doi: 10.7326/M13-1788. [DOI] [PubMed] [Google Scholar]
- 32.Folsom AR, Demissie Z. Fish intake, marine omega-3 fatty acids, and mortality in a cohort of postmenopausal women. American journal of epidemiology. 2004;160:1005–1010. doi: 10.1093/aje/kwh307. [DOI] [PubMed] [Google Scholar]
- 33.Engeset D, Braaten T, Teucher B, et al. Fish consumption and mortality in the European Prospective Investigation into Cancer and Nutrition cohort. European journal of epidemiology. 2015;30:57–70. doi: 10.1007/s10654-014-9966-4. [DOI] [PMC free article] [PubMed] [Google Scholar]
- 34.Bell GA, Kantor ED, Lampe JW, Kristal AR, Heckbert SR, White E. Intake of long-chain omega-3 fatty acids from diet and supplements in relation to mortality. American journal of epidemiology. 2014;179:710–720. doi: 10.1093/aje/kwt326. [DOI] [PMC free article] [PubMed] [Google Scholar]
- 35.Balk EM, Lichtenstein AH, Chung M, Kupelnick B, Chew P, Lau J. Effects of omega-3 fatty acids on serum markers of cardiovascular disease risk: a systematic review. Atherosclerosis. 2006;189:19–30. doi: 10.1016/j.atherosclerosis.2006.02.012. [DOI] [PubMed] [Google Scholar]
- 36.Geleijnse JM, Giltay EJ, Grobbee DE, Donders AR, Kok FJ. Blood pressure response to fish oil supplementation: metaregression analysis of randomized trials. J Hypertens. 2002;20:1493–1499. doi: 10.1097/00004872-200208000-00010. [DOI] [PubMed] [Google Scholar]
- 37.Violi F, Pignatelli P, Basili S. Nutrition, supplements, and vitamins in platelet function and bleeding. Circulation. 2010;121:1033–1044. doi: 10.1161/CIRCULATIONAHA.109.880211. [DOI] [PubMed] [Google Scholar]
- 38.Mozaffarian D, Geelen A, Brouwer IA, Geleijnse JM, Zock PL, Katan MB. Effect of fish oil on heart rate in humans: a meta-analysis of randomized controlled trials. Circulation. 2005;112:1945–1952. doi: 10.1161/CIRCULATIONAHA.105.556886. [DOI] [PubMed] [Google Scholar]
- 39.Rauch B, Senges J. The effects of supplementation with omega-3 polyunsaturated Fatty acids on cardiac rhythm: anti-arrhythmic, pro-arrhythmic, both or neither? It depends. Frontiers in physiology. 2012;3:1–9. doi: 10.3389/fphys.2012.00057. [DOI] [PMC free article] [PubMed] [Google Scholar]
- 40.Fontes JD, Rahman F, Lacey S, et al. Red blood cell fatty acids and biomarkers of inflammation: A cross-sectional study in a community-based cohort. Atherosclerosis. 2015;240:431–436. doi: 10.1016/j.atherosclerosis.2015.03.043. [DOI] [PMC free article] [PubMed] [Google Scholar]
- 41.Li K, Huang T, Zheng J, Wu K, Li D. Effect of marine-derived n-3 polyunsaturated fatty acids on C-reactive protein, interleukin 6 and tumor necrosis factor alpha: a meta-analysis. PloS one. 2014;9:e88103. doi: 10.1371/journal.pone.0088103. [DOI] [PMC free article] [PubMed] [Google Scholar]
- 42.Cawood AL, Ding R, Napper FL, et al. Eicosapentaenoic acid (EPA) from highly concentrated n-3 fatty acid ethyl esters is incorporated into advanced atherosclerotic plaques and higher plaque EPA is associated with decreased plaque inflammation and increased stability. Atherosclerosis. 2010;212:252–259. doi: 10.1016/j.atherosclerosis.2010.05.022. [DOI] [PubMed] [Google Scholar]
- 43.Thies F, Garry JM, Yaqoob P, et al. Association of n-3 polyunsaturated fatty acids with stability of atherosclerotic plaques: a randomised controlled trial. Lancet. 2003;361:477–485. doi: 10.1016/S0140-6736(03)12468-3. [DOI] [PubMed] [Google Scholar]
- 44.Pase MP, Grima NA, Sarris J. Do long-chain n-3 fatty acids reduce arterial stiffness? A metaanalysis of randomised controlled trials. The British journal of nutrition. 2011;106:974–980. doi: 10.1017/S0007114511002819. [DOI] [PubMed] [Google Scholar]
- 45.Flock MR, Skulas-Ray AC, Harris WS, Etherton TD, Fleming JA, Kris-Etherton PM. Determinants of Erythrocyte Omega-3 Fatty Acid Content in Response to Fish Oil Supplementation: A Dose-Response Randomized Controlled Trial. Journal of the American Heart Association. 2013;2:e000513. doi: 10.1161/JAHA.113.000513. [DOI] [PMC free article] [PubMed] [Google Scholar]
- 46.Iso H, Kobayashi M, Ishihara J, et al. Intake of fish and n3 fatty acids and risk of coronary heart disease among Japanese: the Japan Public Health Center-Based (JPHC) Study Cohort I. Circulation. 2006;113:195–202. doi: 10.1161/CIRCULATIONAHA.105.581355. [DOI] [PubMed] [Google Scholar]
- 47.Investigators G-H. Effect of n-3 polyunsaturated fatty acids in patients with chronic heart failure (the GISSI-HF trial): a randomised, double-blind, placebo-controlled trial. Lancet. 2008;372:1223–1230. doi: 10.1016/S0140-6736(08)61239-8. [DOI] [PubMed] [Google Scholar]
- 48.Marchioli R, Barzi F, Bomba E, et al. Early protection against sudden death by n-3 polyunsaturated fatty acids after myocardial infarction: time-course analysis of the results of the Gruppo Italiano per lo Studio della Sopravvivenza nell'Infarto Miocardico (GISSI)-Prevenzione. Circulation. 2002;105:1897–1903. doi: 10.1161/01.cir.0000014682.14181.f2. [DOI] [PubMed] [Google Scholar]
- 49.Burr ML, Fehily AM, Gilbert JF, et al. Effects of changes in fat, fish, and fibre intakes on death and myocardial reinfarction: diet and reinfarction trial (DART) Lancet. 1989;2:757–761. doi: 10.1016/s0140-6736(89)90828-3. [DOI] [PubMed] [Google Scholar]
- 50.Rauch B, Schiele R, Schneider S, et al. OMEGA, a randomized, placebo-controlled trial to test the effect of highly purified omega-3 fatty acids on top of modern guideline-adjusted therapy after myocardial infarction. Circulation. 2010;122:2152–2159. doi: 10.1161/CIRCULATIONAHA.110.948562. [DOI] [PubMed] [Google Scholar]
- 51.Bosch J, Gerstein HC, Dagenais GR, et al. n-3 fatty acids and cardiovascular outcomes in patients with dysglycemia. The New England journal of medicine. 2012;367:309–318. doi: 10.1056/NEJMoa1203859. [DOI] [PubMed] [Google Scholar]
- 52.Roncaglioni MC, Tombesi M, Avanzini F, et al. n-3 fatty acids in patients with multiple cardiovascular risk factors. The New England journal of medicine. 2013;368:1800–1808. doi: 10.1056/NEJMoa1205409. [DOI] [PubMed] [Google Scholar]
- 53.Harris WS, Sands SA, Windsor SL, et al. Omega-3 Fatty Acids in Cardiac Biopsies from Heart Transplant Patients: Correlation with Erythrocytes and Response to Supplementation. Circulation. 2004;110:1645–1649. doi: 10.1161/01.CIR.0000142292.10048.B2. [DOI] [PubMed] [Google Scholar]
- 54.Gurzell EA, Wiesinger JA, Morkam C, Hemmrich S, Harris WS, Fenton JI. Is the omega-3 index a valid marker of intestinal membrane phospholipid EPA+DHA content? Prostaglandins, leukotrienes, and essential fatty acids. 2014 doi: 10.1016/j.plefa.2014.04.001. [DOI] [PMC free article] [PubMed] [Google Scholar]
- 55.Metcalf RG, Cleland LG, Gibson RA, et al. Relation between blood and atrial fatty acids in patients undergoing cardiac bypass surgery. Am J Clin Nutr. 2010;91:528–534. doi: 10.3945/ajcn.2009.28302. [DOI] [PubMed] [Google Scholar]
- 56.Rauch B, Schiele R, Schneider S, et al. Highly purified omega-3 fatty acids for secondary prevention of sudden cardiac death after myocardial infarction-aims and methods of the OMEGA-study. Cardiovasc Drugs Ther. 2010;20:365–375. doi: 10.1007/s10557-006-0495-6. [DOI] [PubMed] [Google Scholar]
- 57.Galan P, Kesse-Guyot E, Czernichow S, Briancon S, Blacher J, Hercberg S. Effects of B vitamins and omega 3 fatty acids on cardiovascular diseases: a randomised placebo controlled trial. BMJ. 2010;341:c6273. doi: 10.1136/bmj.c6273. [DOI] [PMC free article] [PubMed] [Google Scholar]
- 58.Eussen SR, Geleijnse JM, Giltay EJ, Rompelberg CJ, Klungel OH, Kromhout D. Effects of n-3 fatty acids on major cardiovascular events in statin users and non-users with a history of myocardial infarction. Eur Heart J. 2012;33:1582–1588. doi: 10.1093/eurheartj/ehr499. [DOI] [PMC free article] [PubMed] [Google Scholar]
- 59.Harris WS. Are n-3 fatty acids still cardioprotective? Current opinion in clinical nutrition and metabolic care. 2013;16:141–149. doi: 10.1097/MCO.0b013e32835bf380. [DOI] [PubMed] [Google Scholar]
- 60.Deckelbaum RJ, Calder PC. Different outcomes for omega-3 heart trials: why? Current opinion in clinical nutrition and metabolic care. 2012;15:97–98. doi: 10.1097/MCO.0b013e32834ec9e5. [DOI] [PubMed] [Google Scholar]
- 61.Manson JE, Bassuk SS, Lee IM, et al. The VITamin D and OmegA-3 TriaL (VITAL): rationale and design of a large randomized controlled trial of vitamin D and marine omega-3 fatty acid supplements for the primary prevention of cancer and cardiovascular disease. Contemp Clin Trials. 2012;33:159–171. doi: 10.1016/j.cct.2011.09.009. [DOI] [PMC free article] [PubMed] [Google Scholar]
- 62.Bowen KJ, Harris WS, Kris-Etherton PM. Omega-3 Fatty Acids and Cardiovascular Disease: Are There Benefits? Current treatment options in cardiovascular medicine. 2016;18:69. doi: 10.1007/s11936-016-0487-1. [DOI] [PMC free article] [PubMed] [Google Scholar]
- 63.Harris WS, Thomas RM. Biological variability of blood omega-3 biomarkers. Clinical biochemistry. 2010;43:338–340. doi: 10.1016/j.clinbiochem.2009.08.016. [DOI] [PubMed] [Google Scholar]
- 64.Virtanen JK, Mursu J, Voutilainen S, Uusitupa M, Tuomainen TP. Serum omega-3 polyunsaturated Fatty acids and risk of incident type 2 diabetes in men: the kuopio ischemic heart disease risk factor study. Diabetes Care. 2014;37:189–196. doi: 10.2337/dc13-1504. [DOI] [PubMed] [Google Scholar]
- 65.de Oliveira Otto MC, Wu JH, Baylin A, et al. Circulating and Dietary Omega-3 and Omega-6 Polyunsaturated Fatty Acids and Incidence of CVD in the Multi-Ethnic Study of Atherosclerosis. Journal of the American Heart Association. 2013;2:e000506. doi: 10.1161/JAHA.113.000506. [DOI] [PMC free article] [PubMed] [Google Scholar]
- 66.Zhang JY, Kothapalli KS, Brenna JT. Desaturase and elongase-limiting endogenous long-chain polyunsaturated fatty acid biosynthesis. Current opinion in clinical nutrition and metabolic care. 2016;19:103–110. doi: 10.1097/MCO.0000000000000254. [DOI] [PMC free article] [PubMed] [Google Scholar]
- 67.Tintle NL, Pottala JV, Lacey S, et al. A genome-wide association study of saturated, mono- and polyunsaturated red blood cell fatty acids in the Framingham Heart Offspring Study. Prostaglandins, leukotrienes, and essential fatty acids. 2015;94:65–72. doi: 10.1016/j.plefa.2014.11.007. [DOI] [PMC free article] [PubMed] [Google Scholar]
- 68.Harris WS, Kennedy KF, Maddox TM, Kutty S, Spertus JA. Multiple differences between patients who initiate fish oil supplementation post-myocardial infarction and those who do not: the TRIUMPH Study. Nutr Res. 2016;36:65–71. doi: 10.1016/j.nutres.2015.11.006. [DOI] [PMC free article] [PubMed] [Google Scholar]
Associated Data
This section collects any data citations, data availability statements, or supplementary materials included in this article.