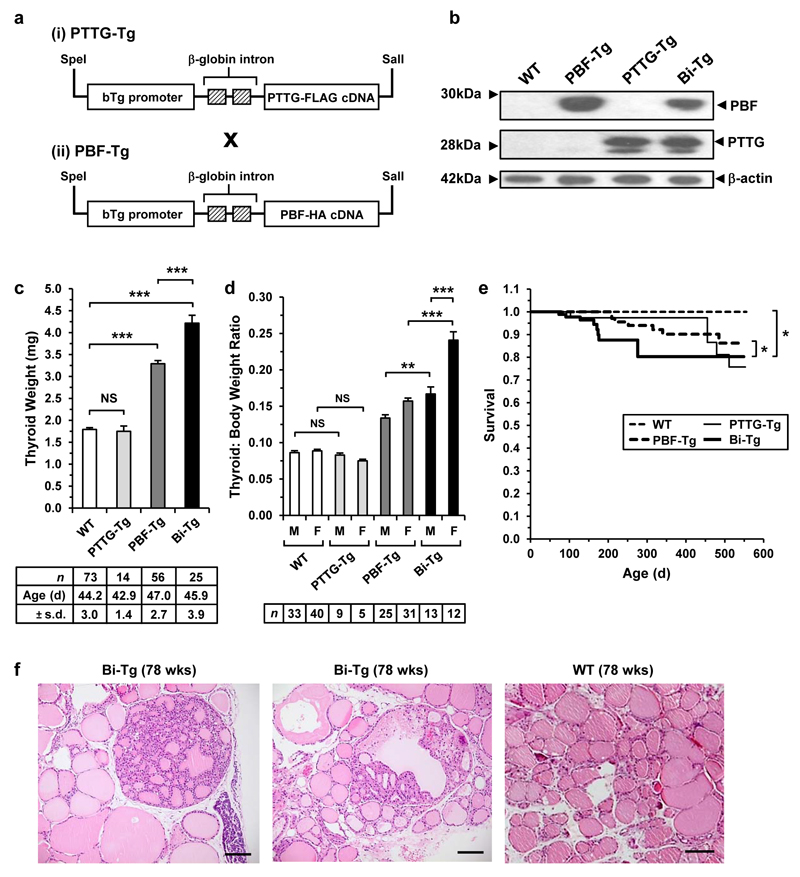
Figure 1. Enlargement of thyroid glands in Bi-Tg mice.
(a) Schematic of the bovine Tg-PTTG-FLAG and Tg-PBF-HA transgenes. (b) Detection of PBF and PTTG expression by Western blot analysis of WT and transgenic thyroids. (c) Thyroid weight of WT and transgenic mice (mean±s.d., number (n) and mean age (d) of mice are indicated, unpaired two-tailed t-test) (NS, not significant; ***P<0.001). (d) Thyroid: body weight ratios of male (M) and female (F) transgenic mice at 7 weeks of age (mean±s.d., number (n) of mice are indicated, unpaired two-tailed t-test) (NS, not significant; **P<0.01; ***P<0.001). (e) Kaplan-Meier survival curves for WT (n=30), PTTG-Tg (n=129), PBF-Tg (n=82) and Bi-Tg (n=89) mice. P-values were determined using the log-rank test (*P<0.05). (f) Representative H&E stained images of hyperplastic lesions in Bi-Tg thyroids from 78-week old mice. WT thyroid follicles (right) are shown for comparison. Scale bar, 100 μm.

