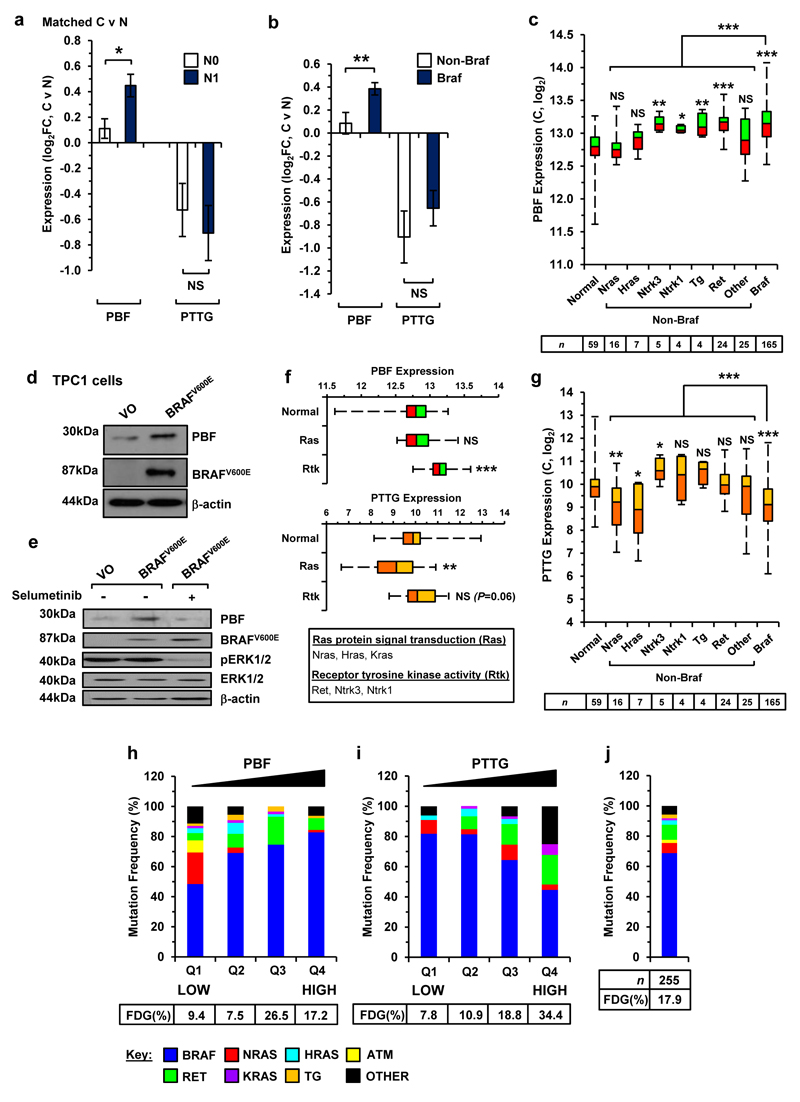
Figure 5. Genetic alterations associated with PBF and PTTG.
(a) Fold-change (FC) in PBF and PTTG expression in metastatic (N1) and non-metastatic (N0) DTC relative to matched normal tissue (N) (mean±s.e.m., N0, n=23; N1, n=21; Mann-Whitney test) (NS, not significant; *P<0.05). (b) Fold-change in PBF and PTTG expression in Braf-mutant and non-Braf mutant DTC relative to matched normal tissue (mean±s.e.m., non-Braf, n=21; Braf, n=32; Mann-Whitney test) (NS, not significant; **P<0.01). (c) Box-whisper plots of PBF expression (log2) in unmatched DTC with the indicated genetic alteration and number of samples (below) (NS, not significant; *P<0.05; **P<0.01; ***P<0.001; Mann-Whitney test). (d) Western blot analysis of PBF and BRAFV600E in TPC-1 cells transfected with either VO or BRAFV600E. (e) Western blot analysis of PBF, BRAFV600E, pERK1/2, and ERK1/2 in TPC-1 cells transfected with either VO or BRAFV600E and then incubated with 200 nM selumetinib. (f) Expression of PBF (top) and PTTG (bottom) in unmatched DTC with the indicated subgroup of genetic alteration (Normal, n=59; Ras, n=25; Rtk, n=33; Mann-Whitney test) (NS, not significant; **P<0.01; ***P<0.001). (g) Same as (c) but instead showing PTTG expression in unmatched DTC samples. (h) Frequency (%) of indicated genetic alterations in unmatched DTC with different quartiles (Q1-Q4) of PBF expression. Frequency of fusion driver genes (FDG) in each quartile is shown (below) (Q1, Q2 and Q4, n=64; Q3, n=63). P-values were determined by Fisher’s exact test. (i) Same as (h) but instead showing mutation frequency (%) present in DTC with different quartiles of PTTG expression. (j) Frequency of mutations and FDG in all 255 unmatched DTC cases.

