

Abstract
Rationale
Health disparities defined by neighborhood socioeconomic status (SES) are well established; it is less well understood whether neighborhood SES is differentially associated with health depending on one’s own SES.
Objective
The double jeopardy hypothesis, collective resources model, fundamental cause theory, and relative deprivation hypothesis, support differential patterns of association between neighborhood and individual SES with health. The first three models suggest that higher neighborhood SES predicts health more strongly among lower, as compared to higher, SES individuals. The relative deprivation hypothesis suggests that higher SES neighborhoods bring no extra health benefit to low SES individuals and could even bring a health deficit. This study examined competing hypotheses with prospective associations between cardiovascular (CV) health and individual SES, neighborhood SES, and their interaction.
Method
Data were from two waves of the Midlife in the United States (MIDUS) Study (N=1,012), a national survey of adults ages 25 and older at baseline. Neighborhood SES was a composite of five census tract-level SES indicators from the 1990 census. Individual SES was a composite of educational attainment and household income at wave one (1995–1996). CV health at wave two (2004–2008), was computed as a composite based on smoking status, body mass index, physical activity, diet, total cholesterol, blood pressure, and glucose.
Results
Individual and neighborhood SES were each associated with CV health net of baseline health status and other covariates. Interactions between individual and neighborhood SES showed that higher neighborhood SES was associated with better CV health for those of lower, not higher, individual SES.
Conclusion
Results are consistent with the double jeopardy hypothesis, the collective resources model, and the fundamental cause theory, but not with a relative deprivation hypothesis. Results suggest that additional attention to the neighborhood socioeconomic context of lower SES individuals may reduce SES disparities in cardiovascular health.
Keywords: Neighborhood socioeconomic status, socioeconomic status, cardiovascular health, double jeopardy hypothesis
Introduction
Coronary heart disease and stroke represent an incredible global public health burden, accounting for approximately 17% of all medical expenditures and being the leading cause of death worldwide (Mozaffarian et al., 2014; Trogdon, Finkelstein, Nwaise, Tangka, & Orenstein, 2007). Improving the cardiovascular health of all Americans is a key objective of the American Heart Association, as identified in their 2020 Impact Goals (Lloyd-Jones et al., 2010). Whereas the previous focus was on reducing cardiovascular risk factors, the new emphasis includes attention to increasing healthy behaviors (i.e., diet, physical activity, decreasing smoking) and healthy levels of risk factors (i.e., body mass index, blood pressure, lipids, glucose) at the population level. As such, a new metric was developed to evaluate cardiovascular health with clinical criteria for poor, intermediate, and ideal cardiovascular health based on the seven previously mentioned risk factors and health behaviors. Adults with ideal cardiovascular health on at least five of the seven metrics had lower risk of all-cause and cardiovascular mortality than adults meeting none of the ideal cardiovascular metrics over a median 5.8-year follow-up (Ford et al., 2012).
It is well established that there are systematic disparities in cardiovascular risk (Mensah, Mokdad, Ford, Greenlund, & Croft, 2005). In considering how to reduce cardiovascular disparities, the context in which these risk and behavioral factors are produced needs to be better understood. Robust evidence demonstrates an association between the socioeconomic status (SES) of one’s neighborhood and health. Individuals who live in more advantaged neighborhoods exhibit better profiles on many of the components of the cardiovascular health metric, better subjective health, fewer risk factors, and lower morbidity and mortality rates, compared to their counterparts residing in less advantaged neighborhoods (reviewed in Arcaya et al., 2016; Diez Roux & Mair, 2010; Pickett & Pearl, 2001; Robert, 1999). The linkages to health are independent of, but often smaller than, those associated with individual-level SES. Multiple mechanisms contribute to differential health as a function of neighborhood SES: differential access to material resources, the cost of available resources, access to medical care, the availability and quality of municipal services, the quality of education, environmental exposures (e.g., noise, lead), crime, crowding, and the availability of tobacco, fast food, and recreational resources, among others. At the biological level, there are also several pathways that link SES at the neighborhood level to the etiology and pathogenesis of cardiovascular disease, including elevated inflammation, greater cardiovascular responses to stress, and greater allostatic load (Bird et al., 2010; Brody et al., 2014; Finch et al., 2010; Merkin et al., 2009; Mujahid et al., 2017; Nazmi, Diez Roux, Ranjit, Seeman, & Jenny, 2010; Petersen et al., 2008; Pollitt, Rose, & Kaufman, 2005; Purser et al., 2008; Robinette et al., 2016; Theall et al., 2012). Although it is clear that, independent of individual SES, higher neighborhood SES is generally associated with better health, it is not yet clear if this association is stronger or weaker depending on a person’s own SES. The driving research question for the present study is: Do individual SES and neighborhood SES interact in their association with cardiovascular health?
There are four relevant theoretical models that inform predictions about how neighborhood SES and individual SES may interact in relation to cardiovascular health: the double jeopardy hypothesis, collective resources model, fundamental cause theory, and the relative deprivation hypothesis (Robert, 1999; Stafford & Marmot, 2003). Importantly, the first three models all predict the same pattern of associations between neighborhood SES and cardiovascular health for varying levels of individual level SES, making it empirically unfeasible to disentangle support among these theories in the present study. In contrast, the relative deprivation hypothesis posits a unique pattern of association between individual and neighborhood SES in relation to health, as described below. The goal of the present study is to use these complementary and competing theoretical models to situate our empirical findings in a framework of how the socioeconomic environment of the neighborhood may matter for health differently depending on individual SES.
The double jeopardy hypothesis (e.g., Ferraro & Farmer, 1996; Waitzman & Smith, 1998) posits that the health of lower SES individuals will be particularly worse off if they reside in lower SES neighborhoods. The double sources of disadvantage associated with (1) having fewer individual resources, and (2) residing in a neighborhood with relatively few resources is expected to take a toll on health more so than if only one type of socioeconomic disadvantage is present. Conversely, according to the collective resources model (Stafford & Marmot, 2003), the lower SES individuals should be healthier in higher SES neighborhoods given access to material and social resources at the neighborhood level. All individuals, regardless of SES, are expected to benefit from neighborhood resources in more advantaged areas, due to reasons such as access to quality services and fewer environmental exposures. However, these health benefits derived from an advantaged neighborhood are hypothesized to be greater among lower SES individuals as they may lack health-promoting resources at the individual level and rely more heavily on the services and surroundings in the local environment.
Fundamental cause theory is also relevant in this context. At the most basic level, fundamental cause theory suggests that higher SES individuals are more likely to be able to live in higher SES neighborhoods – to be able to access better neighborhoods as a health-enhancing resource. In this sense, fundamental cause theory hypothesizes that neighborhood context may be one mediator in the relationship between individual SES and health (Link and Phelan, 1995; Phelan et al., 2010). Still, since not all high SES people parlay their advantage to live in high SES neighborhoods, and not all low SES people live in low SES neighborhoods, neighborhood may also moderate the association between individual SES and poor health. For instance, the health of individuals with higher SES will be more impervious to the socioeconomic context of their neighborhoods. Higher SES individuals almost always have the ability to find ways to access resources that benefit their health; thus, neighborhood context should not matter as much as resources for higher SES individuals as it may for the health of lower SES individuals who in turn have access to fewer health-enhancing resources.
There is empirical support for the pattern of associations supported by the double jeopardy hypothesis, collective resources model, and fundamental cause theory in the prediction of health risk factors. For example, in a community sample of adults from the Detroit metropolitan area, greater neighborhood disadvantage was positively associated with higher probabilities of illicit drug use for all individuals, regardless of income; notably, however, this association between neighborhood disadvantage and drug use was significantly stronger among those with lower, as compared to higher, incomes (Boardman et al., 2001). Within the Health and Lifestyle Study, there were significant employment grade differences in mortality in areas marked by high deprivation, such that those with lower grade positions exhibited higher mortality rates, and employment grade differences in mortality were absent among those residing in areas with low deprivation (Jones, Gould, & Duncan, 2000). Further, Stafford and Marmot (2003) showed that the differences in self-rated health and waist circumference between higher and lower SES individuals, defined by employment grade, were greater in more deprived neighborhoods than in less deprived neighborhoods in the Whitehall II cohort. Finally, in the Atherosclerosis Risk in Communities (ARIC) study, Borrell and colleagues (2004) noted that neighborhood differences in all-cause mortality rates were smaller and less consistent among those with higher personal incomes, although the interaction between personal income and census block-group SES was not statistically significant. Also in ARIC, the disparity in rates of coronary heart disease as a function of neighborhood disadvantage were larger among those with lower incomes compared to those with higher incomes (Diez Roux et al., 2001).
As mentioned previously, it is empirically untenable to distinguish among the three models previously described. Specifically, they all predict a positive association between neighborhood SES and cardiovascular health among lower SES individuals, and a much weaker positive, or null, association between neighborhood SES and cardiovascular health among higher SES individuals. In other words, within low SES neighborhoods, lower SES individuals are predicted to have the worst health, while higher SES individuals are predicted to maintain better health. However, in high SES neighborhoods, the difference in health between lower and higher SES individuals is predicted to be smaller.
In contrast to the previous three theories, the relative deprivation hypothesis posits that lower SES individuals may not garner health benefits from living in higher SES neighborhoods. In fact, health may be worse than if lower SES individuals lived in lower SES neighborhoods given additional stressors and health risks associated with being and feeling “one-down” in a higher SES neighborhood. There are psychosocial costs associated with upward social comparisons, unmet expectations, and feeling deprived of social status, which may in turn affect health risks via chronic stress pathways (e.g., Kawachi & Kennedy, 1999; Wilkinson, 1997, 2002). Further, lower SES individuals in higher SES neighborhoods may not have access to the higher quality goods and services within the higher SES neighborhood given greater demand and higher prices. For example, low SES individuals living in high SES neighborhoods had the highest mortality rates compared to low SES individuals in moderate and low SES neighborhoods, respectively, over a 17-year follow-up within a population-based study (Winkleby, Cubbin, Ahn, 2006). Chuang and colleagues (2007) demonstrated that low SES women living in more educated neighborhoods were more likely to smoke than low SES women living in less educated neighborhoods. Using data from the US National Alcohol Survey, Mulia and Karriker-Jaffe (2012) likewise showed that low SES men had the highest odds of problem drinking when they resided in more advantaged neighborhoods. Mathur and colleagues (2013) further demonstrated among adolescents that lower individual SES predicted greater smoking behaviors, and the association between lower individual SES and higher smoking levels was significantly greater for higher SES neighborhoods than for lower SES neighborhoods. Finally, within a sample of adults from New York City, the association between personal income and body mass index was stronger in richer, compared to poorer, zip codes among women, but not men (Rundle et al., 2008).
The current study tests these complementary and competing hypotheses by examining the prospective associations between individual SES, neighborhood SES, and the interaction between the two with an index of cardiovascular health (i.e., composite of healthy behaviors and biological risk factors; Lloyd-Jones et al., 2010), in a large sample of middle aged and older adults. Though considering interactions between individual and neighborhood-level SES is not entirely novel, no clear consensus has emerged from the literature about the nature of this relationship. Therefore, there is no hypothesized direction of effect.
The current study extends the literature by explicitly testing these relationships using prospective rather than cross-sectional data, using a large, national study. Moreover, most prior research examines mortality, morbidity, or the presence of risk factors which predicts the poorest health states without considering optimal health as the outcome (Arcaya et al., 2016). This study makes an important contribution to the literature by considering a novel indicator of cardiovascular health that includes ideal health states – the presence of positive health. Due to the importance of cardiovascular health among middle-aged and older adults, this study will help us understand whether or not neighborhood-level interventions might be expected to be particularly important to maintain and improve the cardiovascular health of lower SES individuals.
Method
Sample
Data were from waves one and two of the MIDUS survey, which included over 7,000 non-institutionalized adults in wave one (1995–1996), recruited via random digit dialing (RDD) from the 48 contiguous states, siblings of the RDD sample, and a large sample of twins (Brim, Ryff, & Kessler, 2004; Radler & Ryff, 2010). Wave two began in 2004, with 75% retention (adjusted for mortality); 472 individuals were lost to mortality between waves one and two.
Biological data were collected only at wave two from a subset of wave two respondents who agreed to travel to one of three General Clinical Research Centers for an overnight visit. There was a 43% response rate among those eligible for biological data collection reflecting the demanding protocol and extensive travel for participants (Love, Seeman, Weinstein, & Ryff, 2010). Primary reasons for refusal were the extensive travel, having family obligations, and being too busy. The biological subsample was comparable to the full wave two sample on most demographic and health characteristics (age, gender, race, marital status, personal income, subjective physical health, body mass index, alcohol use, chronic conditions, physical activity, health insurance coverage, physician visits), though participants were better educated and less likely to smoke than nonparticipants. Detailed information on the biological sample, protocol, and available measures are reported elsewhere (Love et al., 2010). This study was approved by Institutional Review Boards at Georgetown University, University of California, Los Angeles, and University of Wisconsin-Madison. All participants provided written informed consent.
Our analytic sample includes only those who participated in wave one as well as the survey and biological subsample in wave two. Of the 1,054 individuals eligible for inclusion in the analysis, 42 individuals were excluded due to missing data. Of these, 28 individuals only completed the phone interview component of wave one but not the self-administered questionnaire (where covariate information was collected in wave one). Further, address information was unavailable from six individuals at the time of wave one, precluding the assessment of neighborhood SES, and the remaining eight excluded individuals failed to provide certain health information at wave one, including medication usage (n = 5), physical activity (n = 2), and status of chronic conditions (n = 1).
This analytic sample (n = 1,012) was comparable to those who were eligible but chose not to participate in the biological data collection (n = 1,668) in terms of age, gender, body mass index, alcohol consumption, rates of depression, and number of physician visits per year but also reported better physical health, fewer chronic conditions, higher personal incomes, more education, and less current smoking. The analytic sample includes 374 who were twins (51.3% monozygotic), and six who were siblings.
Study Measures
SES
Participants’ home addresses at wave one were linked to tract-level data from the 1990 United States Census. Neighborhood SES was calculated as a summed, z-scored composite of five census-tract level indicators: median household income, percentage of residents with high school education (reverse-coded), percentage of residents with a college education, percentage of residents with income below poverty (reverse-coded), and percentage of residents with working class occupations. These indicators collectively reflect the key socioeconomic dimensions of income, education, and occupation, and they loaded highly on a single factor. Higher values reflect higher neighborhood SES. A neighborhood SES composite was also created using tract-level data from the 2000 United States Census, linked to participants’ home addresses at wave two. As described in the Results, this allowed for examining changes in neighborhood SES among participants who moved between wave one and wave two.
Individual SES was defined as the mean of z-scored wave one individual educational attainment and total household income. Educational attainment was a 12-response categorical variable, ranging from no school/some grade school to completion of professional degree. Categories were a combination of years of schooling and degree attainment. Education was treated as a continuous variable, and only one individual had missing data. Total household income was calculated as the sum of all income (i.e., employers, social security, government assistance, other sources) for all household members. Fourteen individuals (1.4%) of the analytic sample had missing data on household income. No individuals had missing data on both educational attainment and household income. For the limited cases of missing data on one individual SES indicator (n = 15), individual SES was calculated as the z-scored mean of the available indicator. Results were unchanged with these individuals excluded from analysis (data not shown). Higher values on the composite score reflect higher individual SES.
Cardiovascular health
Cardiovascular health was assessed at the biomarker visit during wave two as a composite (defined below) of seven metrics, including smoking, body mass index (BMI), physical activity, diet, total cholesterol, blood pressure, and fasting glucose. Smoking, physical activity, and diet were self-reported. Physical activity was quantified as MET minutes per week (MMW). One MET is equivalent to the amount of energy burned while at rest. MMW was calculated by multiplying the number of exercise sessions per week by the average number of minutes per session by an intensity factor (6=vigorous, 3=moderate, 1.1=light; Haskell et al., 2007). Meeting 500 MET minutes per week is equivalent to meeting the federal physical activity guidelines (ODPHP, 2017). The five dietary components for the cardiovascular health measure include ≥ 4.5 cups of fruits and vegetables per day, ≥ two 3.5 ounce servings per week of fish, ≥ three, one-ounce equivalent servings per day of fiber-rich whole grains, < 1500 mg of sodium per day, and ≤ 36 ounces of sugar-sweetened beverages per week. MIDUS did not collect data on sodium consumption, and therefore no participants received credit for this dietary component. BMI was calculated based on height and weight assessed by clinic staff, using the formula of weight (kg) divided by height2 (m2). Blood pressure was assessed in a seated position three times consecutively with a 30-second interval between each measurement, and the two most similar readings were averaged. Participants rested for five minutes prior to the first blood pressure assessment. Total cholesterol and glucose were assessed from a fasting blood sample taken on the morning of the second day of the clinic visit (Roche Diagnostics, Indianapolis, IN).
Following definitions outlined by the American Heart Association in Lloyd-Jones and colleagues (2010), individuals were given points (two, one, or zero) for meeting criteria for ideal, intermediate, or poor cardiovascular health, respectively, on each of seven metrics. These points were summed to create an overall index of cardiovascular health (ranging from 0 to 14, higher values reflect better cardiovascular health). Ideal, intermediate, and poor cardiovascular health, respectively, were defined as follows for each of the seven metrics: smoking (never or not within the past 12 months, not currently but within the past 12 months, current smoker), BMI (less than 25, 25–30, greater than 30), physical activity (500 MET minutes per week or greater, 1–499 MET minutes per week, none), diet (4–5 components, 2–3 components, 0–1 components), total cholesterol (less than 200 mg/dL, 200–239 mg/dL or treated to goal, greater than or equal to 240 mg/dL), blood pressure (<120/<80 mm Hg, systolic 120–139 or diastolic 80–89 mm Hg or treated to goal, systolic greater than or equal to 140 or diastolic greater than or equal to 90 mm Hg), and fasting glucose (less than 100 mg/dL, 100–125 mg/dL or treated to goal, greater than or equal to 126 mg/dL).
Covariates
Age, gender, and race (coded as Caucasian American compared to all others) were included as covariates. Because the cardiovascular health outcome could not be computed at wave one due to lack of biological data, additional covariates reflecting self-reported cardiovascular health metrics at wave one were utilized: self-reported smoking (1 = yes, 0 = no), physical activity (self-reported occasions per month of moderate and vigorous activity), hypertension, diabetes, and high cholesterol medication usage (1 = yes, 0 = no for each medication type), and number of chronic health conditions (out of 29 possible conditions).
Statistical Analyses
Hierarchical linear regression models were used to test prospective, independent associations between wave two cardiovascular health and wave one individual SES, neighborhood SES, and their interaction. Model One included individual SES, neighborhood SES, as well as age, gender, race, and wave one cardiovascular health metric covariates. The interaction between neighborhood and individual SES was added in Model Two. Significant interactions were plotted by re-centering the continuous individual SES variable at plus and minus one standard deviation from the mean, respectively, and examining the strength of the coefficient between neighborhood SES and cardiovascular health in fully adjusted models (Jaccard & Turrisi, 2003).
Assumptions of the OLS model were verified, including assessments for outliers and other influential data, normality of residuals, homoscedascity of variance, and independence of errors. No weighting was applied to the data. Multilevel models that accounted for clustering of individuals within neighborhoods yielded identical results to those reported below, and 94% of the analytic sample had unique census tracts. Additionally, because the MIDUS sample includes siblings and twins (37.5% of the analytic sample), supplemental analyses were conducted using generalized estimating equations to adjust for biological dependencies in the data (data not shown). Conclusions regarding the results were identical to those presented below.
Results
As shown in Table 1, participants had an average of 7.8 points on the cardiovascular health metric (range 1–13). Figure 1 displays the distribution of cardiovascular health scores. The distribution of neighborhood SES metrics in this sample was slightly higher than national figures (median household income: $35.4 v. $30.8 nationally, in thousands; percentage with college degree: 24.1% v. 19.1% nationally; percentage below poverty: 9.7% v. 14.6% nationally; percentage in working class occupations: 63.0% v. 67.1% nationally), although was comparable to national figures in terms of the percentage of high school graduates per census tract (29.6% v. 30.3% nationally). At the individual level, median household income for the sample was $80.9 thousand and 55.5% had less than a college education. Individual and neighborhood SES were moderately correlated (r = .35).
Table 1.
Descriptive information on study sample (n = 1,012).
| Variable | M (SD) or % | Range |
|---|---|---|
| Wave Two Cardiovascular Health metric | 7.8 (2.3) | 1–13 |
| Systolic Blood Pressure (mm Hg) | 131.2 (17.7) | 83–191 |
| Diastolic Blood Pressure (mm Hg) | 75.0 (10.2) | 48–114 |
| Blood pressure criteria (% ideal) | 19.2% | |
| Total Cholesterol (mg/dL) | 187.2 (39.2) | 91–396 |
| Total cholesterol criteria (% ideal) | 40.4% | |
| Glucose (mg/dL) | 100.1 (22.2) | 67–418 |
| Glucose criteria (% ideal) | 60.4% | |
| Physical Activity (minutes/week) | 334.2 (547.6) | 0–4550 |
| Physical Activity criteria (% ideal) | 51.2% | |
| BMI | 29.1 (5.9) | 15–57 |
| BMI criteria (% ideal) | 25.6% | |
| Current Smoking (% yes) | 11.2% | |
| Smoking criteria (% ideal) | 88.4% | |
| Diet score | 1.2 (0.8) | 0–4 |
| Diet criteria (% ideal) | 0.8% | |
| Wave One Household income ($ in thousands) | 80.9 (60.6) | 0–300 |
| Wave One Educationa | ||
| ≤ High School (%) | 26.8% | |
| Some College (%) | 28.7% | |
| ≥ College Degree (%) | 44.5% | |
| Wave One Neighborhood SES metrics (from 1990 Census) | ||
| Median household income ($ in thousands) | 35.4 (14.1) | 5.1–139.4 |
| Residents with ≤ high school (%) | 29.6 (9.6) | 6%–54% |
| Residents with ≥ college degree (%) | 24.1 (15.3) | 0%–73% |
| Residents with income below poverty (%) | 9.7 (8.5) | 0%–96% |
| Residents with working class occupations (%) | 63.0 (11.5) | 27%–100% |
| Sociodemographic Variables | ||
| Age | 58.1 (11.6) | 35–86 |
| Gender (% female) | 55.0% | |
| Race (% non-White) | 6.8% | |
| Wave One Health Covariates | ||
| Current smoking (% yes) | 14.2% | |
| Physical activity (occasions per month) | 16.4 (8.3) | 0–27 |
| Hypertension medication (% yes) | 7.7% | |
| Cholesterol medication (% yes) | 4.1% | |
| Diabetes medication (% yes) | 1.7% | |
| Chronic conditions | 2.2 (2.2) | 0–12 |
Note.
Education was treated as a continuous variable but is presented categorically for descriptive purposes.
Figure 1.
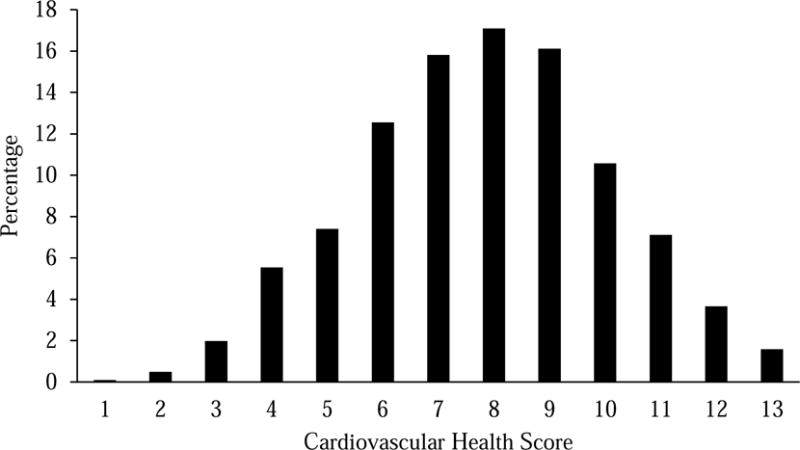
Histogram of cardiovascular health scores from wave two of the MIDUS biomarker sample.
Table 2 presents cross-tabs between tertiles of individual SES and neighborhood SES tertiles. There were fewer individuals (22.2%) with individual SES in the top tertile of the distribution residing in neighborhoods in the bottom tertile of the distribution. Nearly half of the individuals in the top tertile of the individual SES distribution also resided in neighborhoods in the top tertile (49.4%).
Table 2.
Percentage of individuals of varying individual SES in each tertile of neighborhood SES
| Neighborhood SES [% (n)] | ||||
|---|---|---|---|---|
| Bottom Tertile | Middle Tertile | Top Tertile | ||
| Individual | Bottom Tertile | 47.3% (160) | 33.2% (111) | 20.0% (68) |
| SES | Middle Tertile | 30.5% (103) | 38.6% (129) | 30.% (104) |
| Top Tertile | 22.2% (75) | 28.1% (94) | 49.4% (168) | |
Table 3 reports regression results. Model One shows that neighborhood SES was positively associated with cardiovascular health at trend level (β = .06, p = .052), controlling for individual SES, age, gender, race, number of chronic conditions, physical activity, smoking, and hypertension and cholesterol medication usage at wave one. The association between individual SES and cardiovascular health was also statistically significant (β = .16, p < .001) and larger in magnitude than the association for neighborhood SES and cardiovascular health. Model Two adds the interaction between neighborhood and individual SES; this interaction was statistically significant (β = −.08, p = .013). To illuminate the pattern of effects, simple slopes were calculated for the associations between neighborhood SES and cardiovascular health at the mean and at plus and minus one standard deviation of individual SES. This interaction is depicted in Figure 1. At the mean and one standard deviation below the mean on individual SES, there was a significant positive association between neighborhood SES and cardiovascular health (low individual SES: B(SE) = .33(.10), p = .002; mean individual SES: B(SE) = .19(.07), p = .010), whereas the association between neighborhood SES and cardiovascular health was not significantly different from zero among higher SES individuals (B(SE) = .04(.08), p = .61).
Table 3.
Cardiovascular health (wave two) regressed on wave one individual SES, neighborhood SES, and their interaction, adjusting for covariates (MIDUS study, n = 1,012)
| Model 1 | Model 2 | |||
|---|---|---|---|---|
| B (SE) | β | B (SE) | β | |
| Neighborhood SES | .13 (.07) | .06* | .19 (.07) | .08* |
| Individual SES | .36 (.07) | 16*** | .36 (.07) | 16*** |
| Age | −.02 (.01) | −.10** | −.02 (.01) | −.09** |
| Female gender | .64 (.14) | .14*** | .67 (.14) | .15*** |
| Non-white race | −.31 (.26) | −.04 | −.29 (.26) | −.03 |
| Physical activity | .05 (.01) | .17*** | .05 (.01) | .17*** |
| Current smoking | −1.15 (.19) | −.18*** | −1.13 (.19) | −.17*** |
| Hypertension medication | −.93 (.26) | .11*** | −.97 (.26) | .11*** |
| Cholesterol medication | −.65 (.34) | .06* | −.64 (.34) | .06 |
| Diabetes medication | −1.49 (.51) | .09** | −1.50 (.51) | .09** |
| Chronic conditions | −.07 (.03) | −.07* | −.06 (.03) | −.06* |
| Neighborhood x Individual SES | −.15 (.06) | −.08* | ||
|
| ||||
| Model R2 | .188 | .193 | ||
Note.
p ≤ .05,
p < .01,
p < .001.
All variables, except for the cardiovascular health outcome, were evaluated at wave one of MIDUS.
Given the length of time between the two waves of MIDUS (9–10 years), a number of individuals moved residences (23% of analytic sample). To consider the influence of movers, multiple sensitivity analyses were conducted. First, an additional control variable was added to reflect moving status (yes vs. no), and all results were identical to those presented above. Second, adding a control variable reflecting length of time at residence at wave one did not affect reported results. This likely reflects the fact that when individuals changed residences, they moved to neighborhoods of similar SES to their previous residence. Among the 223 individuals who changed residence between waves, the neighborhood SES composite measure at both waves was highly correlated (r = .93, p < .001).
Discussion
The primary objective of this manuscript was to test competing hypotheses about the ways in which individual and neighborhood SES interact to predict cardiovascular health, a metric that combines both biological data and self-reported behavior data. Results indicated that both individual and neighborhood SES were prospectively associated with cardiovascular health for middle aged and older adults, such that lower SES individuals and those living in lower SES neighborhoods had worse cardiovascular health compared to more advantaged individuals and those living in more advantaged neighborhoods, respectively. The magnitude of the association was nearly two times greater for individual, as compared to neighborhood SES, which is consistent with prior literature (Pickett & Pearl, 2001). These associations were also independent of baseline health, implying that the independent associations between individual and neighborhood SES and later cardiovascular health endure at least a decade and are consistent with a causal pathway. Most importantly, there was a significant interaction between individual and neighborhood SES in the prediction of cardiovascular health. Neighborhood SES was associated with cardiovascular health at low and average levels of individual SES. At high levels of individual SES, there was no association between neighborhood SES and cardiovascular health. Thus, living in higher SES neighborhoods may benefit the cardiovascular health of lower SES individuals, in particular.
The pattern of findings was consistent with three of the four models described in the Introduction. The positive association between neighborhood SES and cardiovascular health was larger among lower SES individuals as compared to higher SES individuals, as predicted by the double jeopardy model, collective resources model, and fundamental cause theory. Specifically, supporting the double jeopardy model, lower SES individuals had particularly poor cardiovascular health if they resided in a lower SES neighborhood (Ferraro & Farmer, 1996), and lower SES individuals had better cardiovascular health when they resided in a higher SES neighborhood, as predicted by the collective resources model (Stafford & Marmot, 2003). Neighborhood SES was not associated with cardiovascular health among higher SES individuals, consistent with fundamental cause theory (Link & Phelan, 1995; Phelan et al., 2010). While fundamental cause theory predicts that having access to higher SES neighborhoods is one key health-protective resources available to higher SES individuals (Phelan et al., 2010), the present data support the idea that additional resources may be relevant to cardiovascular health among those with high individual SES, as neighborhood SES and cardiovascular health were unrelated among this subset of individuals.
One reason why high SES individuals in lower SES neighborhoods may not exhibit poorer health is that these individuals may spend less time in their neighborhood than lower SES counterparts. Moreover, there may be additional resources available to higher SES individuals that could act to offset any health detrimental effects associated with living in a lower SES neighborhood, such as increased mobility, less reliance on neighborhood services, and financial and psychosocial resources to offset risks at the neighborhood level. However, it is important to recognize that there are also potential selection issues, as higher SES individuals have more choices regarding the neighborhoods in which they reside than lower SES individuals. Phelan et al. (2010) posit that one of the ways in which higher SES individuals are afforded better health is by selecting into more advantaged neighborhoods. Indeed, in this sample, while individual and neighborhood SES were modestly correlated, there were fewer individuals (22.2%) with individual SES in the top tertile of the distribution residing in neighborhoods in the bottom tertile of the distribution. Nearly half of the individuals in the top tertile of the individual SES distribution also resided in neighborhoods in the top tertile (49.4%). Nevertheless, and consistent with our extension of the fundamental cause theory, there was no significant association between neighborhood SES and cardiovascular health for the highest SES individuals.
Prior empirical studies also demonstrate differential associations between neighborhood SES and health as a function of individual SES, in a similar pattern to that reported here. For example, area-level deprivation was more strongly associated with poorer self-reported health for poorer individuals than for more wealthy individuals in the Whitehall II study (Stafford & Marmot, 2003). Further, neighborhood differences in mortality rates were less consistent among those with higher personal income in the ARIC study (Borrell et al., 2004) and employment grade differences in mortality were absent among those residing in areas marked with low deprivation in the Health and Lifestyle Study (Jones et al., 2000). Similarly, the disparity in rates of coronary heart disease as a function of neighborhood disadvantage were larger among those with low income compared to those with higher income in the Atherosclerosis Risk in Communities Study (Diez Roux et al., 2001). In terms of health behaviors, the association between neighborhood disadvantage and illicit drug use was significantly stronger among those with lower, as compared to higher, incomes within a community sample in Detroit (Boardman et al., 2001). The present study lends additional evidence by showing for the first time that the cardiovascular health of low SES individuals varies strongly by the SES of their neighborhoods.
The cardiovascular health metric utilized in the present study represents a relatively new initiative by the American Heart Association (AHA) to focus population efforts on cardiovascular health as a positive construct instead of the absence of the clinical disease (Lloyd-Jones et al., 2010). As such, points are awarded for healthy behaviors and biological factors within low-risk physiological ranges. The AHA 2020 objectives include not only reducing rates of cardiovascular disease and stroke by 20% but also increasing cardiovascular health by 20%. Unfortunately, prevalence of cardiovascular health is relatively rare in the United States. In the National Health and Nutrition Examination Survey, less than 1% of adults had ideal levels of all seven cardiovascular health factors (Shay et al., 2012). Data from the present study show that there are disparities in cardiovascular health as a function of both individual and neighborhood level SES, consistent with a large corpus of evidence documenting disparities on many independent cardiovascular outcomes (Mensah et al., 2005). It is critical that efforts to improve cardiovascular health at the population level examine the extent to which these disparities are reduced or exacerbated.
The present results did not support the relative deprivation hypothesis. This hypothesis posits that lower SES individuals may be healthier in lower SES neighborhoods as compared to higher SES neighborhoods, given that stress associated with upward social comparisons may pose greater health risks (Wilkinson, 1997), or that access to health enhancing resources may be worse for low SES individuals in high SES neighborhoods. Although there has been prior support for this hypothesis in predicting smoking and drinking behavior (Chuang et al., 2007; Mathur et al., 2013; Mulia & Karriker-Jaffe, 2012), there was clear evidence that lower SES individuals had better cardiovascular health within higher, and not lower, SES neighborhoods in the present sample. It may be that subjective social status, such as one’s perceived position in their community, is a more sensitive individual SES measure to assess relative deprivation than income and educational attainment, given that individuals have latitude in how they define their “community.” Likewise, it is important to note that the current neighborhood assessments were at the census-tract level, which may be a larger geographic area than individuals may intuitively utilize when performing social comparisons and assessing relative deprivation. Therefore, these data may not provide the most robust test of the relative deprivation theory, and an important avenue for future research is to assess concordance between both objective and subjective SES assessments with regard to health risks.
An important consideration in the broader literature on neighborhood effects on health is whether associations are causal in nature, and empirical findings are conflicting. Some support selective residential mobility as the primary source of between-person differences in health as a function of neighborhood disadvantage. That is, Jokela (2014) reported that poor health predicted mobility into less advantaged neighborhoods within a 10-year prospective cohort study in Australia. Similar within-person analyses failed to support causal associations between neighborhood deprivation and poor health among adults in the British Household Panel Survey (Jokela, 2015). Notwithstanding these examples, another major limitation in this literature is a strong reliance on observational data (Oakes, 2015), making causal claims untenable. However, in support of a causal argument, the landmark Moving to Opportunity study demonstrated that individuals who were randomized to receive vouchers to move to areas with less poverty had lower BMIs and lower glycosylated hemoglobin (HbA1c; marker of diabetes risk) than the control group ten to fifteen years following randomization (Ludwig et al., 2011). Another factor deserving of consideration is the neighborhood context at birth, as this has enduring effects on health (Glass & Bilal, 2016). Within the Moving to Opportunity cohort, children who moved out poverty at younger ages had better health outcomes than those who moved later in adolescence (Chetty et al., 2015). While the present study makes an important contribution by examining prospective associations, the data are insufficient for establishing causality. Nevertheless, results emphasize the necessity of considering individual and neighborhood level socioeconomic factors in combination to discern the pattern of health risks within a population.
Limitations
Several limitations of the present study warrant consideration. First, the sample was limited in terms of racial/ethnic diversity (7.1% non-White), thus it is unclear if results will generalize to other racial/ethnic groups or vary by race/ethnicity. Prior research shows that neighborhood SES was differentially associated with insulin resistance and metabolic syndrome as a function of race (Chichlowska et al., 2008; Diez Roux, Jacobs, & Kiefe, 2002). As such, an important direction for future research is to test the intersection of race/ethnicity, individual SES, and neighborhood SES with regard to cardiovascular health using a more diverse sample. This analytic sample is also significantly better educated and in better health than the baseline MIDUS sample, which may limit representation at the lower end of the individual hierarchy. However, there were no differences in income between the analytic sample and baseline sample, and the present measure of individual SES incorporated both income and educational attainment. Concerns about high attrition, selective participation, and differential mortality over the 10-year window may have biased the sample toward healthier and more advantaged individuals.
Therefore, empirical replications of the present findings within more representative samples are necessary, a point echoed by Oakes (2015). A final limitation is that the cardiovascular health assessment was only available at the second wave of data collection, so true change in this metric cannot be detected over time. However, statistical adjustment for several components of the cardiovascular health measure (albeit self-reported) and other health measures at baseline did not alter the primary associations. It is also worth noting that categorization of some of the individual components within the cardiovascular health measure may not adequately denote health status. For example, those with underweight BMI (< 18.5 kg/m2) have higher mortality rates than those with normal BMI (18.5–24.9; Flegal et al., 2005). Given the cardiovascular health definition, these individuals receive points for meeting ideal criteria. However, there is very low prevalence of underweight individuals (n = 4 in analytic sample; <2% nationally, Fryar & Ogden, 2014), and there are important benefits of the overall cardiovascular health measure, described below, that outweigh this limitation.
Conclusions
Despite these limitations, strengths of the study included using multidimensional assessments of both individual and neighborhood level SES (and their interaction), a 10-year prospective window, a national survey of middle aged and older adults, and including as our health measure a novel and important cardiovascular health marker, that includes measurement of the whole range of biological and behavioral risk and cardiovascular health rather than just the absence or presence of disease or risk. The conclusion is that reducing SES disparities in cardiovascular health will require attention to the neighborhood context of low SES middle aged and older adults.
Figure 2.

Interaction between neighborhood and individual SES in the prospective prediction of cardiovascular health. Lines represent the association between neighborhood SES and cardiovascular health at the mean and plus and minus one standard deviation of individual SES. Simple slopes are significantly different from zero at low and mean levels of individual SES. Estimated values reflect statistical adjustment for age, gender, race, physical activity, smoking, chronic conditions, and hypertension, cholesterol, and diabetes medication at baseline.
Research Highlights.
Higher individual and neighborhood SES predicted better cardiovascular (CV) health.
Neighborhood SES predicted better CV health for lower, not higher, SES individuals.
Supported fundamental cause theory, double jeopardy and collective resources models.
Results were inconsistent with the relative deprivation hypothesis.
Acknowledgments
This work was supported by the National Institute on Aging at the National Institutes of Health (P01-AG020166) to conduct a longitudinal follow-up of the MIDUS investigation (Dr. Ryff). The original study was supported by the John D. and Catherine T. MacArthur Foundation Research Network on Successful Midlife Development. Support also came from the following grants M01-RR023942 (Georgetown), M01-RR00865 (UCLA) from the General Clinical Research Centers Program and 1UL1RR025011 (UW) from the Clinical and Translational Science Award (CTSA) program of the National Center for Research Resources, National Institutes of Health. JMB was supported by a training grant (T32HD049302) from the Eunice Kennedy Shriver National Institute of Child Health & Human Development when this project was started. The content is solely the responsibility of the authors and does not necessarily represent the official views of the National Institutes of Health.
Footnotes
Publisher's Disclaimer: This is a PDF file of an unedited manuscript that has been accepted for publication. As a service to our customers we are providing this early version of the manuscript. The manuscript will undergo copyediting, typesetting, and review of the resulting proof before it is published in its final citable form. Please note that during the production process errors may be discovered which could affect the content, and all legal disclaimers that apply to the journal pertain.
The authors declare no conflicts of interest.
References
- Arcaya MC, Tucker-Seeley RD, Kim R, Schnake-Mahl A, So M, Subramanian SV. Research on neighborhood effects on health in the United States: a systematic review of study characteristics. Social Science and Medicine. 2016;168:16–29. doi: 10.1016/j.socscimed.2016.08.047. [DOI] [PMC free article] [PubMed] [Google Scholar]
- Bird CE, Seeman T, Escarce JJ, Basurto-Dávila R, Finch BK, Dubowitz T, Lurie N. Neighbourhood socioeconomic status and biological “wear and tear” in a nationally representative sample of US adults. Journal of Epidemiology and Community Health. 2010;64(10):860–5. doi: 10.1136/jech.2008.084814. http://doi.org/10.1136/jech.2008.084814. [DOI] [PMC free article] [PubMed] [Google Scholar]
- Boardman JD, Finch BK, Ellison CG, Williams DR, Jackson JS. Neighborhood disadvantage, stress, and drug use among adults. Journal of Health and Social Behavior. 2001;42(2):151–65. [PubMed] [Google Scholar]
- Borrell LN, Diez Roux AV, Rose K, Catellier D, Clark BL. Neighbourhood characteristics and mortality in the Atherosclerosis Risk in Communities Study. International Journal of Epidemiology. 2004;33:398–407. doi: 10.1093/ije/dyh063. [DOI] [PubMed] [Google Scholar]
- Brim OG, Ryff CD, Kessler RC. How healthy are we: A national study of well-being at midlife. Chicago: The University of Chicago Press; 2004. [Google Scholar]
- Brody GH, Lei M, Chen E, Miller GE. Neighborhood poverty and allostatic load in African American youth. Pediatrics. 2014;134:e1362–8. doi: 10.1542/peds.2014-1395. [DOI] [PMC free article] [PubMed] [Google Scholar]
- Chetty R, Hendren N, Katz LF. The effects of exposure to better neighborhoods on children: new evidence from the Moving to Opportunity experiment (NBER Working paper) 2015 doi: 10.1257/aer.20150572. [DOI] [PubMed] [Google Scholar]
- Chichlowska KL, Rose KM, Diez-Roux AV, Golden SH, McNeill AM, Heiss G. Individual and neighborhood socioeconomic status characteristics and prevalence of metabolic syndrome: the Atherosclerosis Risk in Communities (ARIC) Study. Psychosomatic Medicine. 2008;70(9):986–92. doi: 10.1097/PSY.0b013e318183a491. http://doi.org/10.1097/PSY.0b013e318183a491. [DOI] [PMC free article] [PubMed] [Google Scholar]
- Chuang YC, Li YS, Wu YH, Chao HJ. A multilevel analysis of neighborhood and individual effects on individual smoking and drinking in Taiwan. BMC Public Health. 2007;7:151. doi: 10.1186/1471-2458-7-151. [DOI] [PMC free article] [PubMed] [Google Scholar]
- Diez Roux AV, Jacobs DR, Kiefe CI. Neighborhood characteristics and components of the insulin resistance syndrome in young adults: the coronary artery risk development in young adults (CARDIA) study. Diabetes Care. 2002;25(11):1976–82. doi: 10.2337/diacare.25.11.1976. [DOI] [PubMed] [Google Scholar]
- Diez Roux AV, Mair C. Neighborhoods and health. Annals of the New York Academy of Sciences. 2010;1186:125–145. doi: 10.1111/j.1749-6632.2009.05333.x. http://doi.org/10.1111/j.1749-6632.2009.05333.x. [DOI] [PubMed] [Google Scholar]
- Diez Roux AV, Merkin SS, Arnett D, Chambless L, Massing M, Nieto FJ, Watson RL. Neighborhood of residence and incidence of coronary heart disease. New England Journal of Medicine. 2001;345(2):99–106. doi: 10.1056/NEJM200107123450205. http://doi.org/10.1056/NEJM200107123450205. [DOI] [PubMed] [Google Scholar]
- Ferraro KF, Farmer MM. Double jeopardy to health hypothesis for African Americans: analysis and critique. Journal of Health and Social Behavior. 1996;37:27–43. [PubMed] [Google Scholar]
- Finch BK, Phuong Do D, Heron M, Bird C, Seeman T, Lurie N. Neighborhood effects on health: Concentrated advantage and disadvantage. Health and Place. 2010;16(5):1058–60. doi: 10.1016/j.healthplace.2010.05.009. http://doi.org/10.1016Zj.healthplace.2010.05.009. [DOI] [PMC free article] [PubMed] [Google Scholar]
- Flegal KM, Graubard BI, Williamson DF, Gail MH. Excess deaths associated with underweight, overweight, and obesity. Journal of the American Medical Association. 2005;293:1861–7. doi: 10.1001/jama.293.15.1861. [DOI] [PubMed] [Google Scholar]
- Ford ES, Greenlund KJ, Hong Y. Ideal cardiovascular health and mortality from all causes and diseases of the circulatory system among adults in the United States. Circulation. 2012;125(8) doi: 10.1161/CIRCULATIONAHA.111.049122. [DOI] [PMC free article] [PubMed] [Google Scholar]
- Fryar CD, Ogden CL. Prevalence of underweight among adults aged 20 and over: Untied States, 1960–1962 through 2011–2012. 2014 Retrieved from: https://www.cdc.gov/nchs/data/hestat/underweight_adult_11_12/underweight_adult_11_12.htm.
- Glass TA, Bilal U. Are neighborhoods causal? Complications arising from the ‘stickiness’ of ZNA. Social Science and Medicine. 2016;166:244–53. doi: 10.1016/j.socscimed.2016.01.001. [DOI] [PubMed] [Google Scholar]
- Haskell WL, Lee IM, Pate RR, Powell KE, Blair SN, Franklin BA, Bauman A. Physical activity and public health. Medicine & Science in Sports & Exercise. 2007;39(8):1423–1434. doi: 10.1249/mss.0b013e3180616b27. http://doi.org/10.1249/mss.0b013e3180616b27. [DOI] [PubMed] [Google Scholar]
- Jaccard J, Turrisi R. Interaction effects in multiple regression. 2nd. Thousand Oaks, CA: Sage; 2003. [Google Scholar]
- Jokela M. Are neighborhood health associations causal? A 10-year prospective cohort study with repeated measurements. American Journal of Epidemiology. 2014;180(8):776–784. doi: 10.1093/aje/kwu233. http://doi.org/10.1093/aje/kwu233. [DOI] [PubMed] [Google Scholar]
- Jokela M. Does neighbourhood deprivation cause poor health? Within-individual analysis of movers in a prospective cohort study. Journal of Epidemiology and Community Health. 2015;69:899–904. doi: 10.1136/jech-2014-204513. [DOI] [PubMed] [Google Scholar]
- Jones K, Gould MI, Duncan C. Death and deprivation: an exploratory analysis of deaths in the health and lifestyle survey. Social Science & Medicine (1982) 2000;50(7–8):1059–79. doi: 10.1016/s0277-9536(99)00355-x. [DOI] [PubMed] [Google Scholar]
- Kawachi I, Kennedy BP. Income inequality and health: pathways and mechanisms. Health Services Research. 1999;34:215–27. [PMC free article] [PubMed] [Google Scholar]
- Link BG, Phelan J. Social conditions as fundamental causes of disease. Journal of Health and Social Behavior. 1995:80–94. Extra Issue. [PubMed] [Google Scholar]
- Lloyd-Jones DM, Hong Y, Labarthe D, Mozaffarian D, Appel LJ, Van Horn L, Rosamond WD. Defining and setting national goals for cardiovascular health promotion and disease reduction: the American Heart Association’s strategic Impact Goal through 2020 and beyond. Circulation. 2010;121(4):586–613. doi: 10.1161/CIRCULATIONAHA.109.192703. http://doi.org/10.1161/CIRCULATIONAHA.109.192703. [DOI] [PubMed] [Google Scholar]
- Love GD, Seeman TE, Weinstein M, Ryff CD. Bioindicators in the MIDUS national study: protocol, measures, sample, and comparative context. Journal of Aging and Health. 2010;22(8):1059–80. doi: 10.1177/0898264310374355. http://doi.org/10.1177/0898264310374355. [DOI] [PMC free article] [PubMed] [Google Scholar]
- Ludwig J, Sanbonmatsu L, Gennetian L, Adam E, Duncan GJ, Katz LF, McDade TW. Neighborhoods, obesity, and diabetes–a randomized social experiment. New England Journal of Medicine. 2011;365(16):1509–19. doi: 10.1056/NEJMsa1103216. [DOI] [PMC free article] [PubMed] [Google Scholar]
- Mathur C, Erickson DJ, Stigler MH, Forster JL, Finnegan JR. Individual and neighborhood socioeconomic status effects on adolescent smoking: a multilevel cohort-sequential latent growth analysis. American Journal of Public Health. 2013;103:543–8. doi: 10.2105/AJPH.2012.300830. [DOI] [PMC free article] [PubMed] [Google Scholar]
- Mensah GA, Mokdad AH, Ford ES, Greenlund KJ, Croft JB. State of disparities in cardiovascular health in the United States. Circulation. 2005;111(10):1233–41. doi: 10.1161/01.CIR.0000158136.76824.04. http://doi.org/10.1161/01.CIR.0000158136.76824.04. [DOI] [PubMed] [Google Scholar]
- Merkin SS, Basurto-Dávila R, Karlamangla A, Bird C, Lurie N, Escarce J, Seeman T. Neighborhoods and cumulative biological risk profiles by race/ethnicity in a national sample of U.S. adults: NHANES III. Annals of Epidemiology. 2009;19:194–201. doi: 10.1016/j.annepidem.2008.12.006. [DOI] [PMC free article] [PubMed] [Google Scholar]
- Mozaffarian D, Benjamin EJ, Go AS, Arnett DK, Blaha MJ, Cushman M, Turner MB. Heart Disease and Stroke Statistics-2015 Update: A Report From the American Heart Association. Circulation. 2014;131(4):e29–322. doi: 10.1161/CIR.0000000000000152. http://doi.org/10.1161/CIR.0000000000000152. [DOI] [PubMed] [Google Scholar]
- Mujahid MS, Moore LV, Petito LC, Kershaw KN, Watson K, Diez Roux AV. Neighborhoods and racial/ethnic differences in ideal cardiovascular health (the Multi-Ethnic Study of Atherosclerosis) Health and Place. 2017;44:61–9. doi: 10.1016/j.healthplace.2017.01.005. [DOI] [PMC free article] [PubMed] [Google Scholar]
- Mulia N, Karriker-Jaffe KJ. Interactive Influences of Neighborhood and Individual Socioeconomic Status on Alcohol Consumption and Problems. Alcohol and Alcoholism. 2012;47(2):178–186. doi: 10.1093/alcalc/agr168. http://doi.org/10.1093/alcalc/agr168. [DOI] [PMC free article] [PubMed] [Google Scholar]
- Nazmi A, Diez Roux A, Ranjit N, Seeman TE, Jenny NS. Cross-sectional and longitudinal associations of neighborhood characteristics with inflammatory markers: Findings from the multi-ethnic study of atherosclerosis. Health and Place. 2010;16(6):1104–1112. doi: 10.1016/j.healthplace.2010.07.001. [DOI] [PMC free article] [PubMed] [Google Scholar]
- Oakes JM, Andrade KE, Biyoow IM, Cowan LT. Twenty years of neighborhood effect research: an assessment. Current Epidemiology Reports. 2015;2:80–87. doi: 10.1007/s40471-015-0035-7. [DOI] [PMC free article] [PubMed] [Google Scholar]
- Office of Disease Prevention and Health Promotion (ODPHP) Appendix 1. Translating scientific evidence about total amount and intensity of physical activity into guidelines. 2017 Retrieved from https://health.gov/paguidelines/guidelines/appendix1.aspx.
- Petersen KL, Marsland AL, Flory J, Votruba-Drzal E, Muldoon MF, Manuck SB. Community socioeconomic status is associated with circulating interleukin-6 and C-reactive protein. Psychosomatic Medicine. 2008;70(6):646–52. doi: 10.1097/PSY.0b013e31817b8ee4. http://doi.org/10.1097/PSY.0b013e31817b8ee4. [DOI] [PubMed] [Google Scholar]
- Phelan JC, Link BG, Tehranifar P. Social Conditions as Fundamental Causes of Health Inequalities: Theory, Evidence, and Policy Implications. Journal of Health and Social Behavior. 2010;51:S28–S40. doi: 10.1177/0022146510383498. http://doi.org/10.1177/0022146510383498. [DOI] [PubMed] [Google Scholar]
- Pickett KE, Pearl M. Multilevel analyses of neighbourhood socioeconomic context and health outcomes: a critical review. Journal of Epidemiology and Community Health. 2001;55(2):111–122. doi: 10.1136/jech.55.2.111. http://doi.org/10.1136/jech.55.2.111. [DOI] [PMC free article] [PubMed] [Google Scholar]
- Pollitt RA, Rose KM, Kaufman JS. Evaluating the evidence for models of life course socioeconomic factors and cardiovascular outcomes: a systematic review. BMC Public Health. 2005;57 doi: 10.1186/1471-2458-5-7. http://doi.org/10.1186/1471-2458-5-7. [DOI] [PMC free article] [PubMed] [Google Scholar]
- Purser JL, Kuchibhatla MN, Miranda ML, Blazer DG, Cohen HJ, Fillenbaum GG. Geographical segregation and IL-6: a marker of chronic inflammation in older adults. Biomarkers in Medicine. 2008;2(4):335–348. doi: 10.2217/17520363.2.4.335. http://doi.org/10.2217/17520363.2.4.335. [DOI] [PMC free article] [PubMed] [Google Scholar]
- Radler BT, Ryff CD. Who participates? Accounting for longitudinal retention in the MIDUS national study of health and well-being. Journal of Aging and Health. 2010;22(3):307–31. doi: 10.1177/0898264309358617. http://doi.org/10.1177/0898264309358617. [DOI] [PMC free article] [PubMed] [Google Scholar]
- Robert SA. Socioeconomic position and health: The Independent Contribution of Community Socioeconomic Context. Annual Review of Sociology. 1999;25(1):489–516. http://doi.org/10.1146/annurev.soc.25.1.489. [Google Scholar]
- Robinette JW, Charles ST, Almeida DM, Gruenewald TL. Neighborhood features and physiological risk: an examination of allostatic load. Health and Place. 2016;41:110–118. doi: 10.1016/j.healthplace.2016.08.003. http://dx.doi.org/10.1016/j.healthplace.2016.08.003. [DOI] [PMC free article] [PubMed] [Google Scholar]
- Rundle A, Field S, Park Y, Freeman L, Weiss CC, Neckerman K. Personal and neighborhood socioeconomic status and indices of neighborhood walk-ability predict body mass index in New York City. Social Science and Medicine. 2008;67:1951–8. doi: 10.1016/j.socscimed.2008.09.036. [DOI] [PMC free article] [PubMed] [Google Scholar]
- Shay CM, Ning H, Allen NB, Carnethon MR, Chiuve SE, Greenlund KJ, Daviglus ML, Lloyd-Jones DM. Status of cardiovascular health in US adults: prevalence estimates from the National Health and Nutrition Examination Surveys (NHANES) 2003–2008. Circulation. 2012;125:45–56. doi: 10.1161/CIRCULATIONAHA.111.035733. [DOI] [PMC free article] [PubMed] [Google Scholar]
- Stafford M, Marmot M. Neighbourhood deprivation and health: does it affect us all equally? International Journal of Epidemiology. 2003;32(3):357–366. doi: 10.1093/ije/dyg084. http://doi.org/10.1093/ije/dyg084. [DOI] [PubMed] [Google Scholar]
- Theall KP, Drury SS, Shirtcliff EA. Cumulative neighborhood risk of psychosocial stress and allostatic load in adolescents. American Journal of Epidemiology. 2012;176:S164–S174. doi: 10.1093/aje/kws185. [DOI] [PMC free article] [PubMed] [Google Scholar]
- Trogdon JG, Finkelstein EA, Nwaise IA, Tangka FK, Orenstein D. The economic burden of chronic cardiovascular disease for major insurers. Health Promotion Practice. 2007;8(3):234–242. doi: 10.1177/1524839907303794. http://doi.org/10.1177/1524839907303794. [DOI] [PubMed] [Google Scholar]
- Waitzman NJ, Smith KR. Separate but lethal: the effects of economic segregation on mortality in metropolitan America. Milbank Quarterly. 1998;76:341–73. doi: 10.1111/1468-0009.00095. [DOI] [PMC free article] [PubMed] [Google Scholar]
- Wilkinson RG. Socioeconomic determinants of health. Health inequalities: relative or absolute material standards? British Medical Journal. 1997;314(7080):591–595. doi: 10.1136/bmj.314.7080.591. [DOI] [PMC free article] [PubMed] [Google Scholar]
- Wilkinson RG. Unhealthy societies: the afflictions of inequality. London: Routledge; 2002. [Google Scholar]
- Winkleby M, Cubbin C, Ahn D. Effect of cross-level interaction between individual and neighborhood socioeconomic status on adult mortality rates. American Journal of Public Health. 2011;96(12):2145–53. doi: 10.2105/AJPH.2004.060970. http://dx.doi.org/10.2105/AJPH.2004.060970. [DOI] [PMC free article] [PubMed] [Google Scholar]