

Abstract
Model-based metabolic flux analysis (MFA) using isotope-labeled substrates has provided great insight into intracellular metabolic activities across a host of organisms. One challenge with applying MFA in mammalian systems, however, is the need for absolute quantification of nutrient uptake, biomass composition, and byproduct release fluxes. Such measurements are often not feasible in complex culture systems or in vivo. One way to address this issue is to estimate flux ratios, the fractional contribution of a flux to a metabolite pool, which are independent of absolute measurements and yet informative for cellular metabolism. Prior work has focused on “local” estimation of a handful of flux ratios for specific metabolites and reactions. Here, we perform systematic, model-based estimation of all flux ratios in a metabolic network using isotope labeling data, in the absence of uptake/release data. In a series of examples, we investigate what flux ratios can be well estimated with reasonably tight confidence intervals, and contrast this with confidence intervals on normalized fluxes. In a series of examples, we find that flux ratios can provide useful information on the metabolic state, and is complementary to estimates of normalized fluxes: for certain metabolic reactions, only flux ratios can be well estimated, while for others normalized fluxes can be obtained. Simulation studies of a large human metabolic network model suggest that estimation of flux ratios is technically feasible for complex networks, but additional studies on data from actual isotopomer labeling experiments are needed to validate these results. Finally, we experimentally study serine and methionine metabolism in cancer cells using flux ratios. We find that, in these cells, the methionine cycle is truncated with little remethylation from homocysteine, and polyamine synthesis in the absence of methionine salvage leads to loss of 5-methylthioadenosine, suggesting a new mode of overflow metabolism in cancer cells. This work highlights the potential for flux ratio analysis in the absence of absolute quantification, which we anticipate will be important for both in vitro and in vivo studies of cancer metabolism.
Keywords: Metabolic flux analysis, metabolic network, methionine, serine, cancer metabolism, optimization, simulation studies
1. Introduction
Assessment of metabolic fluxes in living cells has proven critical for understanding cellular metabolism, and may potentially identify state-specific metabolic vulnerabilities in disease, including cancer (Duckwall et al., 2013; Gunther et al., 2015). Intracellular metabolic activities in living cells are often analyzed using isotope labeling experiments, in which cells are exposed to stable isotope-labeled nutrients and the resulting intracellular isotope patterns within metabolic products are measured. In model-based metabolic flux analysis (MFA), a stoichiometric, atom-level model of a metabolic network is constructed, and a number of metabolic fluxes are simultaneously estimated by fitting the model to isotope labeling data. To obtain absolute fluxes (in moles per unit time), however, requires absolute quantification of nutrient uptake rates, biomass growth, and release of metabolic products, in order to constrain the model. In microorganisms such measures are often feasible, as cells can be grown on a single carbon source whose uptake can be readily quantified, and biomass rate and composition can be measured as well (Sauer et al., 1999; Lange and Heijnen, 2001). Consequently, MFA has provided a wealth of information regarding intracellular metabolic activities in microorganisms (Tang et al., 2009). In contrast, for mammalian cells, measuring uptake and release rates has proven much more challenging (Niklas et al., 2010). While uptake rates for major nutrients (glucose, amino acids) can be quantified in cell cultures (Kell et al., 2005; Jain et al., 2012), mammalian cells require complex growth medium that also contains significant amounts of serum-derived protein and fat-containing lipoproteins which are consumed by cells (Commisso et al., 2013; Beloribi-djefa et al., 2016), and are more difficult to quantify. Moreover, the biomass generated by proliferating human cells varies by cell type, and consists not only of new cellular material, but also extracellular matrix proteins deposited on culture dishes and various biosynthesized products released into the medium (Xie and Wang, 1994). Finally, for MFA of tissues or tumors in vivo, for example in tumor-bearing animals (Marin-Valencia et al., 2012), accurate quantification of comprehensive uptake/release measures can prove challenging. In such situations, artificial constraints must often be imposed on uptake/release fluxes to perform MFA, and may substantially influence the final results. This problem also arises when modeling a subset of the metabolic network, since estimates of fluxes crossing the “boundary” of the model are then needed for MFA, yet are rarely available.
One potential approach to overcome this limitation is to instead estimate metabolic flux ratios, defined as the relative contributions of each reaction feeding into a specific metabolite pool, since these ratios do not depend on absolute uptake/release fluxes. If data is available for isotope labeling of the metabolite of interest and for all metabolite substrates that feed into the specific pool, then flux ratios can be estimated at this metabolite, either from steady-state (Sauer et al., 1999; Zamboni et al., 2009) or time-course data (Hörl et al., 2013). Since isotope distributions are directly related to flux ratios, this “local” approach is relatively straightforward and robust. However, usually not all required isotopomers are measurable, and although missing data can sometimes be substituted from “proxy” metabolites (Rantanen et al., 2008), still only a limited number of flux ratios have been accessible by the local method. For example, in the study of Hörl et al. (2013), flux ratios at three TCA cycle metabolites could be obtained, while a more extensive recent study using machine learning approaches estimated six flux ratios, including one novel ratio in the glyoxylate shunt (Kogadeeva and Zamboni, 2016). In human cells, and in particular in the study of cancer metabolism, flux ratios have been used to estimate the relative activity of alternative synthesis pathways. This has provided important insights into cellular metabolism: for example, the relative contributions of glucose and glutamine to lactate (DeBerardinis et al., 2007) or lipogenic acetyl-CoA (Metallo et al., 2012) have been proven to be important factors in the metabolic reprogramming of cancer cells. Yet, to our knowledge systematic estimation of flux ratios in arbitrary metabolic networks has not been performed. It is not even clear whether flux ratios are indeed a valid parametrization, that is, if flux ratios contain all information about the flux state. Also, we do not know how many flux ratios can be well-estimated in large metabolic networks, particularly in central human metabolism, or how measurement error propagates to uncertainty about flux ratios in large models.
In this paper, we propose and evaluate a systematic, model-based method for estimating flux ratios, as a means of analyzing isotope labeling experiments in the absence of uptake/release data. This approach makes use of all available isotopomer information and yields confidence intervals for all flux ratios in a metabolic network, also for metabolites that were not measured or do not carry labeled atoms, such as metabolic cofactors. We also prove that flux ratios are valid parameters of the flux state, in that they are in one-to-one correspondence with fluxes normalized to the total release flux. In simulation studies with a large human metabolic network, we find that many flux ratios are well-estimated, indicating that studies of human cellular metabolism using our approach are at least theoretically feasible. Finally, we apply this method to study serine and methionine metabolism in human cancer cells.
2. Methods
2.1. Cell culture
HeLa cells were cultured in six-well plates in RPMI-1640 medium containing either unlabeled nutrients (control), 50% U-13C-methionine (Cambridge Isotopes, no. CLM-893-H), or 50% 1-13C-serine (Cambridge Isotopes no. CLM-1574-H), and supplemented with 5% fetal bovine serum (Life Technologies) dialyzed using Snakeskin 10K MWCO dialysis tubing (Nordic Biolabs, Taby, Sweden, no. 88245-P) to remove additional metabolites. An intermediate (50%) amount of tracer was used since this tends to generate more informative MIDs for MFA (Möllney et al., 1999). After 48 hours of culture in this medium (at a confluence of 85%), wells were rapidly rinsed twice with 500 μL of Hanks balanced salt solution (Sigma-Aldrich, St. Louis, no. H6648) and metabolites extracted through the addition of 540 μL of precooled 100% methanol. Cells were scraped and transferred to a 1.5 mL tube. Cell material was subjected to three freeze-thaw cycles whereby the sample tubes were partially submerged in an acetone dry ice bath for 45 seconds followed by partial submersion in a room temperature water bath. After complete lysis, 200 μL of ice cold methanol was added to each sample. Samples were then vortexed for 30 seconds, sonicated for 2 minutes and allowed to sit at −20°C for 30 minutes to facilitate protein precipitation. Samples were then centrifuged at 14,000 rpm for 10 minutes at 4°C, after which 200 μL of supernatant was transferred to new microfuge tubes, dried in vacuo using a vacuum concentrator, and the resulting pellets resuspended in 40 μL of 80:20 methanol:water for analysis.
2.2. Mass spectrometry
For liquid chromatography-mass spectrometry (LC-MS), sample volumes were transferred to glass 100 μL volume LCMS vials and kept at 4°C in the autosampler compartment until 2 μl of sample was injected for analysis. Compounds were separated using a Thermo Vanquish UPLC coupled to a Thermo QExactive Orbitrap mass spectrometer. Separation was performed using a Millipore (Sequant) Zic-pHILIC 2.1 × 150 mm 5 μm column maintained at 25°C using a flow rate of 0.3 mL/min and a 15 minute linear gradient starting from 90:10 acetonitrile: 20mM ammonium bicarbonate pH 9.6 to 45:55 acetonitrile: 20mM ammonium bicarbonate pH 9.6. Detection was performed in positive and negative ion modes through sequential sample injections using a heated electrospray ionization (HESI) source operated at 2.5 kV (negative mode) and 3.5 kV (positive mode), sheath gas flow of 40, auxiliary gas flow of 20, sweep gas flow of 2, capillary temperature of 275°C and auxiliary gas heater temperature of 350°C. Data was collected using data-dependent tandem MS collection with MS1 parameters of 70,000 mass resolution, 100 ms maximum IT time, 3 × 10⁶ AGC volume and a mass range of 67 to 1000 m/z, and MS2 parameters of 17,500 mass resolution, 50 ms maximum IT time, 1 × 10⁵ AGC volume, loop count of 5, isolation window of 0.5 m/z, NCE of 35 and 10 second dynamic exclusion. LC-MS peaks were assigned metabolite identity by matching accurate mass and retention time against pure standards, and further confirmed by observing plausible mass isotopomer patterns in tracing experiments. Peak areas were obtained from chromatogram data by integrating total intensity within the retention time range. Mass isotopomer peaks were manually inspected in labeled samples and unlabeled controls. A small false +2 mass isotopomer of serine (ser-L) deriving from an unrelated compound was excluded by setting this MI fraction to zero. All experiments were performed in triplicate cultures with independent LC-MS analysis.
2.3. Metabolic network models
The metabolic network models used herein were assembled based on a previously described reconstruction of the human metabolite network (Duarte et al., 2007), with some modifications and simplifications. Complete model descriptions are provided as supplementary data. All reactions in each the model were able to carry flux in the forward (reference) direction. For the large network model, we also verified that the model is capable of biomass synthesis as well as terminal oxidation of all the major nutrients (glucose and amino acids) to CO2. The large model comprises 554 reactions, of which 236 were reversible, including all transporters; 140 of these cannot carry net flux in the reverse direction, but were kept reversible since nonzero exchange flux though these reactions may still be possible, and can affect simulated MIDs. Throughout, we use metabolite identifiers established by the original reconstruction.
2.4. Atom mappings and isotopomer distributions
Atom mappings for carbon in each reaction in the metabolic network were obtained from two previously published data sets (Arita, 2004; Mu et al., 2007). Both data sets were translated to InChi canonical numbering, and reactions present in both were verified to agree. Metabolite symmetry information was obtained from the Mu et al. (2007) data set; there were 21 rotationally symmetric metabolites in the network. The EMU framework was used to generate a system of mass isotopomer balance equations from the atom-level network Antoniewicz et al. (2007). Equivalent atom group due to rotational symmetry was handled using EMU equivalence classes. Unlabeled network subtrates (nutrients) were defined to have an isotopomer distribution where n is the number of atoms in the molecule, nx is the number of 13C atoms in the isotopomer x, and p13 = 0.0107 is the natural 13C fraction (this corresponds to a binomial MID). Tracer isotopomer distributions pT were modeled based on 98% purity (manufacturer’s specificiation) for labeled atoms and natural 13C fractions for unlabeled atoms. For the HeLa tracing experiemnt, the isotopomer distribution p(x) achieved in fresh medium was then modeled as a mixture distribution
where α is the fraction of tracer used (here 50%). EMU balance equations were generated using in-house software based on Mathematica v.10 (Wolfram Research), available from the authors, and exported as model files in the General Algebraic Modeling System (GAMS) format.
2.5. Metabolic flux analysis
Throughout, we performed MFA as previously described (Suthers et al., 2007; Nilsson and Jain, 2016) by considering both isotopomers x and fluxes v ≥ 0 as free variables, related by the EMU balance constraints denoted as c(v, x) = 0, and minimizing the variance-weighted L2 distance to the measured mass isotopomers fractions y,
subject to the constraints c(v, x) = 0, Sv = 0 and v0 = Σj∈R vj fixed to 100, where R indexes the release fluxes. Here Σ was diagonal with standard deviations set as described below. The stoichiometry constraint Sv = 0 is needed in addition to c(v, x) = 0 to ensure mass balance also for metabolites that are not part of the EMU networks, including unlabeled metabolites, cofactors, and non-carbon metabolites. The flux ratios ϕij was then obtained from the optimal flux solution via equation (1). Confidence intervals were calculated by maximizing/minimizing each parameter (fluxes vj or flux ratios ϕij) subject to the MFA constraints and with the objective , where f* is the objective at optimum. All nonlinear optimization problems were solved using the CONOPT solver (ARKI Consulting & Development A/S, Bagsvaerd, Denmark) controlled via the GAMS modeling system.
For the simulations onthe TCA cycle and large network model, standard deviations σi = 0.1 were used for all metabolites. The true flux vector was chosen manually to involve all reactions of interest (shown in Figure 5). Confidence intervals around the true flux vector was examined, so that f* = 0.
Figure 5.

Simplified view of the TCA cycle model. Numbers indicate the flux vector used to simulate data for testing. Gray arrowheads indicate reversible reactions, while fluxes refer to the direction of black arrows; exchange fluxes were zero. Pyruvate carboxylase was present in the model but zero in the simulated flux state. Citrate lyase was modeled in the cytosolic compartment, here shown separated by double gray lines. Asterisks indicate measured metabolites. Cofactors and some intermediate steps are not shown; see supplementary dataset S1 for full model.
For the large network model, compartmentalization was handled by representing each measured MI fraction i as a mixture ΣkMikxk, where xk is the corresponding compartment-specific MI fraction (Nilsson and Jain, 2016). The objective can then be written
The mixing coefficients Mik were considered unknown parameters and were estimated jointly with the other parameters. To generate an interesting flux state for simulation with as many active pathways as possible, we chose a flux vector v ≥ 0 that brought the ratios ϕij as close as possible to by minimizing (ϕij − ri)2 subject to the stoichiometry constraints Sv = 0.
For the methionine/serine experiments, MID measurements from HeLa cells were modeled with a standard deviation σi = 0.01 for all isotopomers except 2-ketomethylthioburytate (2kmb) for which σ = 0.1 due to uncertainty in measurements. MID measurements from the 1-13C-serine and U-13C-methionine experiments were combined, and a single flux vector was fit to both data sets, as previously described (Leighty and Antoniewicz, 2012). To examine possible local minima, we solved this optimization problem 1,000 times, starting from distinct initial points obtained as random linear combiniations of a set of flux vectors obtained by flux variability analysis (Schilling et al., 2000). From the resulting solution vectors v1, …, v1000, a set of smaller candidate solutions C was identified by initializing C = {v1, …, v1000} and iteratively removing from C any vector vk that was not “extreme” in any dimension, satisfying for all j. Hence, the vectors v ∈ C cover the full range of each flux vj found across all restarts. Similarly, a set of vectors was generated to cover the ranges observed for the flux ratio parameters. We then calculated confidence intervals for all parameters at all such “extreme” points, and finally took for each parameter the union of all intervals obtained, as a conservative estimate.
3. Theory
In this section, we prove some theoretical properties of flux ratios. In particular, we show that flux ratios contain all information required to calculate all fluxes in a metabolic network, except for a scale factor which turn out to be the total release flux from the system. These results demonstrate that flux ratios are indeed a valid parameterization of the flux state of any metabolic network.
3.1. Preliminaries
We begin by stating some definitions used throughout. A metabolic network with m metabolites and n reactions is described by its m×n stochiometry matrix S, such that Sij < 0 if metabolite i is consumed by reaction j, Sij > 0 if metabolite i is produced by reaction j, and Sij = 0 otherwise. Throughout, we consider the flux vj through each reaction j to be nonnegative, and represent reversible reactions by two fluxes in opposing directions. Uptake or release of a metabolite i from/to the surroundings is represented by a column j with a single nonzero element Sij = 1 or −1, respectively. Hence, at steady-state we have Sv = 0 due to mass balance. We denote the set of feasible fluxes 𝒱 = {v ≥ 0ΛSv = 0}. We now define the flux ratio ϕij as the relative contribution of flux j to the total flux “through” metabolite i,
| (1) |
Here S+ denotes the (element-wise) positive part, which identifies reactions producing metabolite i (Figure 1). Note that by this definition, higher stoichiometries Sij > 1 are incorporated into the ratio ϕij, and of course Σj ϕij = 1 for all i.
Figure 1.
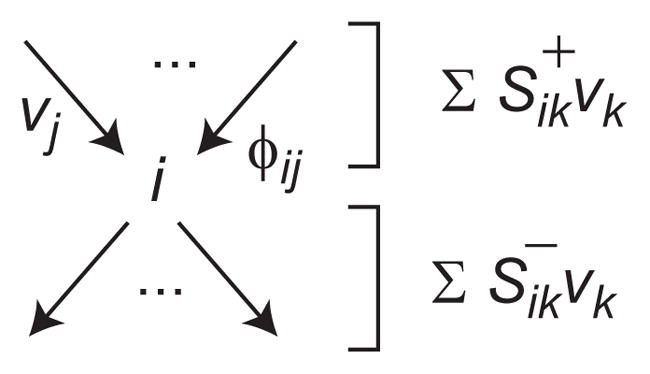
Illustration of notation for fluxes vj, flux ratios ϕij, and summations for a metabolite i. Elements represent reactions entering into metabolite pool i, and elements of reactions leaving the pool.
In isotope labeling experiments, the flux ratios ϕ are directly related to the observed isotopomer distributions at steady-state. To see this, consider the molar fraction xik of some isotopomer k of a metabolite i, and let denote the molar fraction of a corresponding isotopomer formed by a reaction j that produces i. Then, at steady state, xik is a linear mixture over all reactions
| (2) |
This shows that isotopomer data x provides direct information only about ϕ, not about v. If for some metabolite i both xik and all its “parent” isotopomers can be measured, then we can estimate flux ratios ϕij directly from (2) by solving a linear system (Sauer et al., 1999; Zamboni et al., 2009).
3.2. Mapping between fluxes and flux ratios
If flux ratios ϕ are a valid parameterization of the flux state, it must be possible to reconstruct the flux vector v from ratios ϕ. While equation (1) defines ϕ as a function of v that maps the set of feasible fluxes 𝒱 onto a set of feasible flux ratios Φ = {ϕ(v): v ∈ 𝒱}, this function is clearly not invertible, since ϕ is independent of the magnitude of v, that is, ϕ(αv) = ϕ(v) for any scale factor α > 0. However, we will prove that, provided this scale factor α is chosen correctly, we can uniquely determine v from any ϕ in Φ, for any metabolic network. To establish the scale parameter, it is helpful to augment the metabolic network S by adding a “sink” metabolite i = 0, replacing all release fluxes in the original network with reactions producing this sink metabolite, and adding a single release flux v0 from the sink, which is the sum of all release fluxes. This parametrization is convenient because release fluxes can themselves be interdependent, which complicates the analysis. This arrangement is exemplified for a simple network model in Figure 2; in this case v6 and v7 are dependent. Then, in the augmented network, the flux v0 together with ϕ (which now includes ratios for reactions entering the sink) is sufficient to reconstruct the full vector v.
Figure 2.

Toy example. (A) Network with flux vector used in simulations indicated. Atoms indicated by circles; top, substrate isotopomer used for simulaton experiments. Isotopomers in remaining metabolites are not shown. (B) Network as in A, augmented with a sink metabolite S, and with fluxes v1, …, v7 indicated (release fluxes R = {6, 7}). Asterisks mark a set of free fluxes. (C) Same as B, with flux ratios ϕij indicated at arrowheads. In this example metabolites are indexed by letters for clarity.
Theorem 1
The function v ↦ (ϕ, v0) from 𝒱 to Φ × ℝ+ is one-to-one.
To our knowledge, this result has not been obtained before. The proof and method of calculating v for any (ϕ, v0) is given in appendix A. This result shows how to interconvert between v and ϕ, and establishes that the sought scale factor α is the total release flux v0. Perhaps counter-intuitively, uptake fluxes do not yield a suitable scale factor, due to the asymmetry inherent in flux ratios: in the case of a “split” in the metabolic network, the associated flux ratios are trivially 1, and contains no information about the absolute fluxes. (Note also that uptake and release fluxes are not necessarily equal, because of bimolecular reactions like A → B + C.) Another way of stating this result is that the normalized fluxes vj/v0 are one-to-one with ϕ. In the remainder of the paper, we will therefore use vj/v0 as our measure of flux, and contrast this with the flux ratios ϕ. Note that v0 is always an unknown arbitrary constant in our setting.
Finally, we consider the question of how to identify a minimal set of free flux ratios, in analogy with free fluxes. Clearly, both v and ϕ are over-parameterized, partly because many fluxes vj (on which ϕ depends) are fixed by the mass balance constraint, and also because Σj ϕij = 1 for each metabolite i. However, if a given metabolic network has n free fluxes, we have found that one can always determine a set of n − 1 free parameters ϕij, so that (ϕ, v0) effectively has the same dimension as v. A proof sketch of this fact and a method for determining the free flux ratios is provided in appendix B. With this theoretical foundation in place, in the rest of the paper we will investigate estimation of ϕ and v/v0 in the presence of noise.
4. Results
4.1. Small example network
Since flux ratios have not previously been systematically studied with global, model-based MFA, we began by testing our approach on a simple example network (Figure 2). This network has 3 free fluxes (including the “sink” flux v0) and 2 free flux ratios. The space of possible metabolic states in terms of free fluxes and free flux ratios is shown in Figure 3, demonstrating that not all flux ratios correspond to a valid flux vector, due to the mass balance constraint. This implies that “local” methods can result in estimates that are incompatible with the overall stoichiometry of the net-work. Following Antoniewicz et al. (2007), we simulated isotopomer data x from this model for the MID of metabolite C, at the flux vector v given in Figure 2A, corrupted with normal distributed noise with a standard deviation σ = 0.003 (0.3 mol %). To assess how this noise propagates to uncertainty about flux ratios ϕij, we calculated 90% confidence intervals for each parameter as the smallest and largest values around the optimal vector compatible with an objective value , where is the 90% quantile of the χ2 distribution with 1 degree of freedom (Antoniewicz et al., 2006). For comparison, we also calculated confidence intervals on the fluxes vj normalized to the sink flux v0, in the same manner. The resulting intervals are given in Table 1, indicating that in this simple model, it is indeed possible to estimate certain flux ratios and also some normalized fluxes from isotopomer data alone.
Figure 3.

Feasible fluxes and flux ratios for the sink-augmented network in Figure 2. (A) Portion of the feasible set of free fluxes, restricted to [0, 1]3 as indicated by dashed lines. With the sink flux v0 fixed, v7 is bounded but v3 is not, due to exchange flux with v4. (B) Set of feasible flux ratios (gray area) corresponding to the set in A. Cross indicates an infeasible flux state given by ϕA3 = 0.1, ϕS3 = 0.9.
Table 1.
Confidence intervals for normalized fluxes vj/v0 (left) and flux ratios (right) for the example network of Figure 2. Here v0 = v6 + v7 was fixed. Flux ratios given in parentheses were fixed by stoichiometry alone.
| Flux | CI Low | CI Hi | Flux ratio | CI Low | CI Hi |
|---|---|---|---|---|---|
| v1 | 0.65 | 0.75 | ϕA1 | 0.27 | 1.00 |
| v2 | 0.50 | 2.09 | ϕC2 | 0.80 | 0.92 |
| v3 | 0.00 | 1.80 | ϕA3 | 0.00 | 0.73 |
| v4 | 0.12 | 0.18 | ϕB4 | (1.00) | (1.00) |
| ϕD4 | (0.33) | (0.33) | |||
| v5 | 0.12 | 0.18 | ϕC5 | 0.08 | 0.20 |
| ϕD5 | (0.67) | (0.67) | |||
| v6 | 0.47 | 0.63 | ϕS6 | 0.47 | 0.63 |
| v7 | 0.37 | 0.53 | ϕS7 | 0.37 | 0.53 |
Interestingly, in this model, flux ratios and normalized fluxes convey complementary information. For example, the ratio ϕC2 is well-determined, with 90% confidence interval (0.80, 0.92), while the corresponding normalized flux v2 has a wide confidence interval (0.5, 2.09) due to the poorly estimated exchange flux between metabolites A and C. In this case, the CI for ϕC2 remains reasonably tight because ϕC2 = 0.80 already at the lowest value for v2. In contrast, the ratio ϕA1 is poorly determined since it is affected by the poorly determined flux v3, while the uptake flux v1 is not and remains fairly well estimated with CI (0.65, 0.75). The ratios ϕS6 and ϕS7 (which are identical to normalized fluxes v6/v0 and v7/v0) are also well estimated, likely because the synthesis of C and D is linked via flux v5. Thus, based solely on the MID of metabolite C and the mass balance constraints, one can in this case determine the routes of synthesis of C, and also the release flux for C and D relative to the total outflux v0.
While it is well known that wide confidence intervals on metabolic fluxes can arise due to redundant parameters (Wiechert et al., 1997), this issue has not been considered for flux ratios. In this example, confidence intervals for flux ratios were rather wide, particularly considering the low measurement noise level of 0.3%. To investigate the source of uncertainty, we visualized the objective function f in the space of the free flux ratios ϕA3 and ϕS7 (Figure 4). In this parametrization, we see that the region is in fact a narrow “valley”, where ϕA3 contributes nearly all of the uncertainty: at a fixed value for ϕA3, the interval for ϕS7 is actually very narrow, but as the two parameters become dependent given the MID data x, uncertainty in ϕA3 translates to uncertainty in ϕS7. Hence, wide confidence intervals on flux ratios can arise due to dependencies between parameters.
Figure 4.
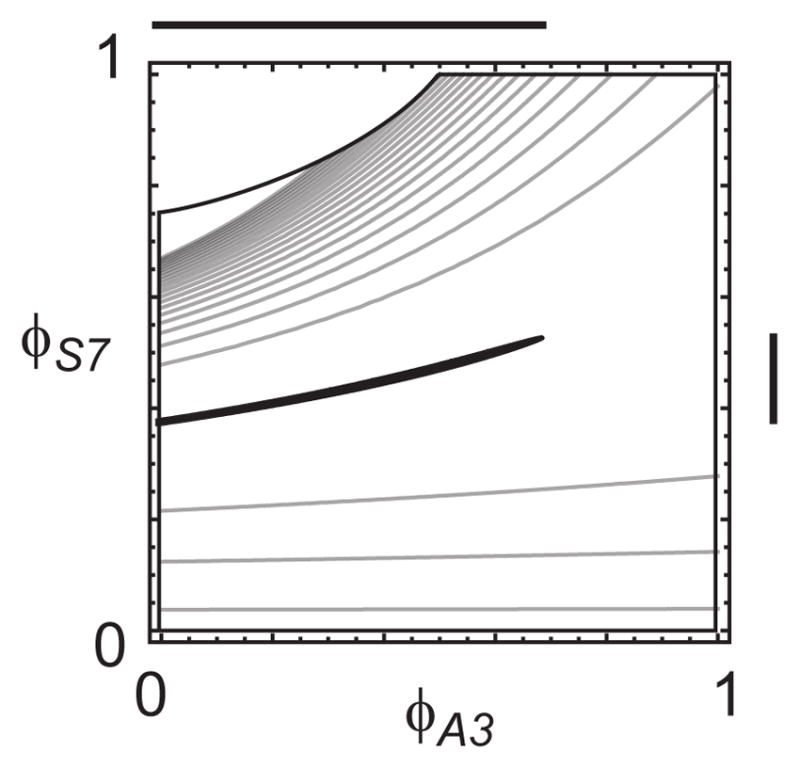
Objective function f(ϕ) for the example of Figure 2, indicated by gray contours. Black region indicates the 90% confidence set with . Thick lines at the axes indicate the corresponding 90% confidence intervals for ϕA3 and ϕS7.
4.2. TCA cycle model
As a more realistic example, we next tested estimation of flux ratios on a model of the TCA cycle (Figure 5), a system that has been thoroughly studied with MFA methods (Jones et al., 2001; Metallo et al., 2009). Our model includes pyruvate and simplified fatty acid (acetate) oxidation, citrate export to the cytosol for fatty acid synthesis, and anaplerosis from glutamine and pyruvate (via pyruvate carboxylase). This model was chosen as it contains some biologically important flux ratios, including citrate synthase vs. reverse aconitase flux (reductive carboxylation), which is considered important for fatty acid synthesis in hypoxic conditions (Metallo et al., 2012), anaplerosis at oxaloacetate via pyruvate carboxylase, which is important in some cancer types (Sellers et al., 2015), and pyruvate uptake vs. cycling via malic enzyme, which may be regulated by p53 in senescence (Jiang et al., 2013). Our model includes pyruvate and simplified fatty acid (acetate) oxidation, citrate export to the cytosol for fatty acid synthesis, and anaplerosis from glutamine and pyruvate (via pyruvate carboxylase). A complete specification of the model is provided as supplementary material. While the model contains two compartments, this does not confound flux analysis in this case since, of the measured variables, only citrate is present in both compartments, and its cytosolic MID is identical to the mitochondrial MID.
We simulated a tracing experiment from this model with U-13C-glutamine as tracer and with measurements of citrate, glutamate, malate, pyruvate and succinate MIDs, compounds that are readily measurable by LC-MS methods. With these measurements, flux ratios cannot be estimated locally, since in each case there is at least one non-measured metabolite, so that equation (2) is not solvable. In contrast, we were able to obtain estimates of some flux ratios with the global MFA approach (Table 2). For example, we were able to estimate at the 90% confidence level that isocitrate dehydrogenase provides at least 75% of α-ketoglutarate, implying that glutaminase is a minor source of TCA cycle carbon; and that no more than 19% of mitochondrial oxaloacetate can derive from pyruvate carboxylate. While some confidence intervals are very wide, they still allow us to conclude whether reactions must be active, which is not always trivial: for example, we find that at least 21% of acetyl-CoA must derive from pyruvate dehydrogenase, showing that the reaction is active, even though pyruvate was not used as a tracer. For comparison, it was not possible to estimate any fluxes vj with good confidence from the isotope data alone and with the sink flux v0 fixed. Hence, in this case, global model-based estimation of flux ratios allows us to draw some conclusions that would not otherwise be accessible.
Table 2.
Selected 90% confidence intervals for flux ratios for the TCA cycle model. Confidence intervals (CI) of flux ratios are given for indicated reaction-metabolite pairs, named as in Figure 5. A complete list of intervals is given in supplementary dataset S2.
| Metabolite | Reaction | Actual | CI Low | CI Hi |
|---|---|---|---|---|
| akg | IDH | 0.75 | 1.00 | |
| accoa | PDH | 0.21 | 1.00 | |
| glu | GLN | 0.97 | 1.00 | |
| oaa | PC | 0.0 | 0.19 | |
| oaa | MDH | 0.58 | 1.00 |
4.3. Large human metabolic network model
To test our approach in a large-scale setting that reflects the complexity of mammalian cell metabolism, we next performed flux ratio estimation in a large network model of human metabolism. A network model was assembled that covers major metabolic routes active in cultured human cells, including central carbon metabolism, amino acid, nucleotide and fatty acid synthesis and catabolism, as well as synthesis of biomass components such as sterols and polyamines (Supplementary dataset S3). The model comprises 453 metabolic reactions compartmentalized into the cytosol, mitochondria, peroxisomes and the endoplasmic reticulum, with complete cofactor balancing. Of the 465 metabolites in the model, 387 (83%) contain carbon atoms reachable from substrates and may be informative for MFA. The remainder are cofactors not synthesized by the model, including Coenzyme A, NAD, NADP, FAD, folate, phosphate groups, and various small inorganic ions. To our knowledge, such comprehensive models of mammalian cellular metabolism are yet to be analyzed by 13C MFA, and it remains unknown what flux ratios could theoretically be estimated by our approach.
Fixing the total release flux v0 does not by itself constrain any fluxes in this model, indicating that carbon may exit the network in various ways, and that fluxes are not locked to the biomass rate as previously found for a large-scale E. coli model (Gopalakrishnan and Maranas, 2015). Also, 598 fluxes can participate in internal “cycles” (type III pathways) within this network (data not shown), and are therefore unbounded despite fixing v0 (Schilling et al., 2000). Hence, any fluxes and flux ratios in this model must be estimated based on measureable MID data. To provide a realistic assessment, we limited our analysis to a set of 99 metabolites that we have found to be measurable with acceptable quality using LC-MS. In total, these metabolites comprised 770 mass isotopomers, while there were 395 free fluxes in the metabolic network (with v0 fixed), suggesting that flux analysis is possible. To account for compartmentalization, we modeled measured MIDs as linear mixtures of compartment-specific MIDs (see Methods).
We simulated MID data from this model using U-13C-glucose and U-15C-glutamine as tracers, based on a single “true” flux vector v chosen so that all pathways are active at comparable rates (see Methods), to ensure that there are “interesting” fluxes and flux ratios to estimate. At this flux vector, 3,593 EMUs (82%) and 311 metabolites (84%) were enriched for 13C, indicating that glucose and and glutamine carbon can reach a large portion of the metabolic network. Unlabeled metabolites were mainly found in pathways of essential amino acid and choline catabolism, as might be expected.
We then estimated 90% confidence intervals for all flux ratios and normalized fluxes (with v0 fixed to 1) as before, here assuming a measurement standard deviation of 1% (Supplementary dataset S4). All intervals were calculated around the true flux vector. Note that this analysis covers all fluxes and ratios in the metabolic network, including cofactors and other non-carbon metabolites. The distribution of widths of the obtained confidence intervals is shown in Figure 6. Of the 1,438 non-trivial flux ratios, 811 (56%) were well-estimated, having confidence intervals at most than 0.1 wide. Surprisingly, of the 823 normalized fluxes, 245 (30%) were also well estimated, with interval width < 10% of the true flux, even though there were many possible release fluxes. It appears that normalized release fluxes themselves are well estimated in this case, indicating that the combination of isotopic data and stoichiometry is sufficient to constrain normalized fluxes.
Figure 6.

Estimated confidence intervals from human network model. (A) Histogram of width of confidence intervals (CIs) for normalized fluxes. (B) Histogram of width of CIs for flux ratios. Solid line indicates cumulative density function (CDF). (C) Scatter plot of CI widths for normalized fluxes and flux ratios. Examples discussed in text are indicated. GLUN, glutaminase; glu, glutamate; PDH, pyruvate dehydrogenase; accoa, acetyl-CoA; ALT, alanine transaminase; pyr, pyruvate.
As before, we find that the normalized flux and flux ratio measurements are complementary in that some flux ratios are well-estimated while the associated flux is not, and vice versa (Figure 6C). Central metabolites with high in-degrees, such as common cofactors like ATP, small ions, and central metabolites like glutamate (Figure 6C, GLUN/glu) tend to have tight flux ratio intervals, while the flux may be poorly estimated. This is likely because the large number of contributing fluxes leads to small flux ratios for each reaction, and hence little variation. On the other hand, narrow CIs for normalized fluxes but wide CIs for flux ratios may be observed when a certain flux is constrained by mass balance, but other fluxes into the same metabolite pool are not; for example, in this simulation this occured for mitochondrial alanine transaminase feeding into the mitochondrial pyruvate pool (Figure 6C, ALT/pyr).
Narrow confidence intervals were obtained also for metabolites that were not directly measured. For example, among fluxes entering mitochondrial acetyl-CoA, pyruvate dehydrogenase contributed 10% at this flux state (Figure 6C, PDH/accoa), and we obtained a CI of 3.7–11%; while each of the eight steps of palmitate oxidation contributed 3%, for a total of 24%, and the CI was 7.2–30%, indicating that the relative sources of acetyl-CoA can theoretically be well estimated, despite the fact that acetyl-CoA itself was not measured. In this case, the corresponding normalized fluxes were also well estimated. Moreover, due to stoichiometry constraints, information was obtained also for metabolites that do not carry 13C, including turnover of cofactors such as NAD and estimates of energy metabolism. For example, mitochondrial respiratory complex I activity was well estimated, likely as it depends on major oxidative pathways labeled by glucose and glutamine. Although these simulation results depend on a number of assumptions discussed below, taken together, these results indicate that it is theoretically possible to obtain rich information about the metabolic state of large networks with global estimation using a flux ratio approach in conjunction with common tracers and currently measureable metabolites.
4.4. Methionine and serine metabolism in a human cell line
Metabolism of methionine and serine is important for cancer cells to supply one-carbon units for biosynthesis and methylation reactions (Mattaini et al., 2016; Cavuoto and Fenech, 2012). We therefore chose to experimentally test model-based estimation of flux ratios from stable isotope labeling experimentson a metabolic network model of serine/methionine metabolism. We performed two parallel labeling experiments using U-13C-methionine and 1-13C-serine as tracers (see Methods for details). The model used covers major metabolic pathways of methionine/serine metabolism (Figure 7A), including the S-adenosylmethionine (SAM) cycle, methionine salvage, folate metabolism, and purine synthesis (to account for label introduced into the purine ring from serine). In this case, metabolites at the model boundaries are represented as uptake/release fluxes. This model is challenging for flux estimation, since there are many “boundary” fluxes that cannot be estimated experimentally: in the augmented network, 24 metabolites are released via the sink. Measured MIDs from nine metabolites were used to fit this model, combining data from both tracer experiments. For this model, all metabolites were cytosolic. The model was fitted to data 1,000 times, restarting optimization from distinct initial points. An acceptable model fit was achieved in 93% of restarts, with a chi square statistic of 68.7 (90% bound = 75.5). To be conservative in case multiple minima were present, we took as the final confidence intervals the widest possible parameters ranges obtained when combining confidence intervals from the multiple restarts (see Methods).
Figure 7.

Estimates of flux ratios in methionine/serine metabolism identifies a truncated methionine cycle. (A) Simplified view of metabolic network model with estimated parameters. Asterisks indicate metabolites with experimentally measured mass isotopomers. Percentages indicate 90% confidence bounds on flux ratios, other numbers indicate 90% bounds on normalized fluxes. See supplementary dataset S5 for full model. (B) Accumulation of 5-methylthioadenosine (5mta) in spent culture medium. Low values in fresh medium demonstrates that 5mta indeed derives from cells.
For most fluxes and flux ratios, a wide range of values were compatible with an acceptable objective, indicating that additional data is needed to constrain the solution, as might be expected given the limited measurements available. Yet, 20 nontrivial flux ratios (21%) were well estimated (CI width ≤ 10%) in this analysis. On the other hand, nearly all CIs for normalized fluxes included zero and so were not informative; this is probably due to alternative pathways and the large number of boundary fluxes. Focusing on reactions in the SAM cycle and methionine salvage (Figure 7A), we noted that very little methionine was synthesized by remethylation from homocysteine, with methionine synthase contributing at most 2% of total methionine synthesis. If methionine synthase is coupled to methylation in the SAM cycle rather than protein synthesis, then this implies that flux through the SAM cycle is small compared to total methionine uptake. Alternatively, the SAM cycle might be truncated so that either homocysteine or S-adenosylhomocysteine escapes the cycle, leading to a low methionine synthase flux. These results, obtained from a small steady-state experiment, are consistent with a recent analysis of the SAM cycle using more extensive time-course isotope labeling (Shlomi et al., 2014).
The analysis also indicated that methionine salvage from 5-methylthioadenosine, the other major pathway of methionine synthesis in human cells, is not active in these cancer cells, with a normalized flux of at most 0.002 (relative to v0 = 1). Active methionine salvage should yield an M+1 mass isotopomer in methionine from the U-13C-methionine, which was not observed. It is notable that this inference cannot be made by examining methionine and its immediate precursor in the pathway, 2-ketomethylbutyrate (2kmb), since there is substantial exchange flux between these metabolites, rendering flux ratios uninformative. This result is also intriguing since we did observe 13C labeling of 5-methylthioadenosine (5mta), indicating that polyamine synthesis is active, and 5mta has no other known fate in human cells besides the methionine salvage pathway (Figure 7A), suggesting that 5mta might be discarded from these cells into the culture medium. Consistent with this hypothesis, in a follow-up analysis we found that 5mta was clearly present in spent medium, but nearly undetectable in the fresh medium, resulting in a 200-fold increase over 48h of culture (Figure 7B).
We also found that most of the 1-carbon units entering purine synthesis was from serine, with ≥ 97% of 10-formyl-THF derived from this source and at most 3% from an unlabeled sources (such as formate obtained from the culture medium), consistent with previous reports (Fu et al., 2001). Finally, we estimated that 88–95% of cystathionine, an intermediate in cysteine and glutathione synthesis, was synthesized from homocysteine and serine (Figure 7A). Taken together, these results indicate that, although unique flux vectors cannot be determined from limited isotopomer data alone, it is nevertheless possible to estimate some parameters in this experimental setting, revealing truncation of the methionine cycle and failure to recycle the 5-methylthioadenosine produced in polyamine synthesis.
5. Discussion
In this paper, we have investigated global, model-based estimation of metabolic flux ratios in the absence of uptake and release measures. Unlike previously reported methods that estimate flux ratios in a local manner (Zamboni et al., 2009; Hörl et al., 2013), our approach uses model-based MFA, which lets us take advantage of isotopomer balances and stoichimetry constraints to reveal additional flux ratios. Notably, the recently published SUMOFLUX method (Kogadeeva and Zamboni, 2016) is model-based as well, but is targeted in the sense that particular ratios are selected for analysis, which are then estimated by a machine learning method trained on a large number of simulated isotopomers. In comparison, our approach relies only on MFA and the well-established profile likelihood method to explore confidence intervals for all flux ratios. While the lack of uptake/release data renders parameters estimation difficult in many cases, we still find that certain parameters can be obtained, and we believe that the examples given herein are representative of the experimental data that is realistically available in the cancer metabolism and related fields with current metabolomics methods.
We also find that flux ratios and normalized fluxes (scaled to total release flux) convey complementary information, as in some cases, isotope data allows normalized fluxes to be well estimated, but in other cases only flux ratios can be determined. This is not unexpected, as the two measures represent different views of the flux state. Hence, given an isotope labeling experiment, it is worth calculating confidence intervals on both parameters. More generally, these two measures can be viewed as special cases from the wider class of rational functions of fluxes, and there might be other measures in this class that are more natural in a specific situation, or that can be estimated with better accuracy. In particular, with careful analysis of a specific model it is often possible to choose a reference flux vr so that the ratio vj/vr can be well determined for certain fluxes vj of interest. For example, it is well established that in the TCA cycle model (Figure 5), it is feasible to estimate fluxes relative to the citrate synthase flux. Choice of reference fluxes, however, depend on the question at hand, and this approach does not represent a generally applicable method for analyzing larger networks. To our knowledge, no general method is known for parameterizing a metabolic network (with flux ratios, reference fluxes, or other representations) to ensure that parameters are identifiable, although some progress has been made on identifiability of absolute fluxes (Isermann and Wiechert, 2003; Crown et al., 2012). This represents an important topic for future studies.
The application of our methodology to serine/methionine metabolism in cancer cells show that, although many parameters are not identifiable, it is nevertheless possible to estimate key parameters from isotope labeling data alone using model-based analysis. In the serine/methionine model, based on a small data set consisting of two steady-state tracer experiments, we find that the methionine cycle is “truncated” in these cells, with very low homocysteine remethylation and methionine salvage, while polyamine syntheisis and the transsulfuration pathway that forms cystathonine is active (Figure 7A). These data are consistent with more extensive time-course analyses (Shlomi et al., 2014) and suggest a mode of “overflow” metabolism in cancer cells, where methyl groups in the form of 5-methylthioadenosine are not salvaged but discarded into the medium, analogous to the well-known loss of glucose-derived lactate and glutamine-derived glutamate from cancer cells (Jain et al., 2012). Yet, it should be pointed out that accurate estimation of flux ratios in this model is subject to a number of caveats. Quantifying mass isotopomer distributions using full-scan, high resolution mass spectrometry as done herein (and which is increasingly common) is advantageous in that mass isotopomers in a wide variety of metabolites can be assessed, which enables analysis of less well understood metabolic systems and helps constrain flux solutions by increasing the number of measured variables. However, the statistical properties of this data type is not well understood. For example, with orbitrap-based mass analyzers, low mass isotopomer frequencies are often underestimated, since low intensity signals tend to ”drop off” towards zero (Nilsson and Jain, 2016), creating bias and possible underestimating variation across replicates. This data may does not satisfy the normal distribution assumptions that underlie all metabolic flux analysis methods, including confidence interval estimates (Antoniewicz et al., 2006), the chi-square model fit criterion, and even the sum-of-squared-residual type of objective function itself. It would be valuable to examine the statistical properties of MID data obtained from full-scan instruments in more depth, and perhaps consider alternative, more robust model fitting criteria such as L1 norm methods or regularization techniques, which are common in other fields utilizing large-scale model fitting techniques (Tibshirani, 2011).
Our simulation study suggests that estimating normalized fluxes and flux ratios on a large scale from mammalian cell cultures is theoretically feasible in the absence of quantitative data on metabolite uptake and release, using commonly available tracers and experiementally measurable isotopomers. To our knowledge, this is the first study of identifiability in a large human metabolic network. A previous analysis of similar scope was performed by Gopalakrishnan and Maranas (2015) for E.coli ; in their model, about 2/3 of the reactions were completely determined by biomass. This did not occur in our model, although we did find a surprisingly large fraction (30%) of well-estimated normalized fluxes, and this may be due to flux coupling via the biomass reaction. It must be emphasized that this simulation study is theoretical, and only addresses how MID measurement error propagates to uncertainty in fluxes and flux ratios, assuming that the correct flux vector can be found. Although we were able to fit this model to simulated data, achieving an objective close to zero (data not shown), it is not known how many local minima might be present. Also, a caveat is that our analysis was performed at a flux vector chosen so that most fluxes and flux ratios are nonzero, which may not be true in practice — indeed, in the methionine/serine data set, a number of flux ratios were estimated to be near zero — and identifiability may be different in such cases. Moreover, in a real situation, any number of model errors might occur that makes such large-scale studies difficult to realize in practice. Nevertheless, the present work shows that, with data and conditions typical of isotope experiments in cultured cancer cells, it is possible to recover at least partial information on the metabolic state using global analysis of flux ratios. Importantly, in contrast to ad hoc manual analysis of isotopomer data, the model-based approach generally yields more information, and also helps reveal inconsistencies that may otherwise have gone unnoticed. We therefore believe that that flux ratio analysis will be an increasingly important tool for cancer metabolism and related fields.
Supplementary Material
Acknowledgments
We would like to thank Yaroslav Lyutvinskiy for support with mass spectrometry data analysis. This work was generously supported by the Swedish Foundation for Strategic Research no. FFL12-0220.006 (R.N); the Strategic Programme in Cancer Research at Karolinska Institutet (I.R.); V Foundation for Cancer Research, Mary Kay Foundation and Sidney Kimmel Foundation (M.J.).
Appendix A. Proof of bijection
Here we prove that the function v ↦ (ϕ, v0) is one-to-one, so that v is always uniquely determined by (ϕ, v0). Let S be the m × n stoichimetry matrix of a metabolic network with m metabolites and n reactions. First, transform the metabolic network to graph G by replacing each reaction having more than 1 substrate and 1 product with an intermediate metabolite and associated reactions, as exemplified in Figure A.8A. Next, let L be the adjoint graph (line graph) of G, having an edge j → k iff for some metabolite i the edges j → i and i → k are in G. Note that each such edge j → k in L is associated with exactly one flux ratio ψjk = ϕij. In the cases where i was not in the original metabolic network, we may (arbitrarily) choose ψjk = 1/di where di is the in-degree of i in G; see Figure A.8B. We now have for each reaction j (each node in L) that
Figure A.8.

(A) Example network from figure 3 transformed to graph form (fluxes have been renumbered). (B) the adjoint graph of the graph in A, with flux ratios indicated as edge weights.
where the sum is over all edges j → k exiting node j in L. (For the sink j = 0 this sum is zero.) If we now define the matrix
and the vector b = (0 0 · · · v0), then it holds that T(ϕ)v = b. Moreover, for each column k of T we have Σj Tjk = 0 because the sum ranges over precisely the flux ratios ψjk = ϕij associated with metabolite i, minus 1 for the diagonal element; the exception is columns k corresponding to uptake fluxes, for which Σj Tjk = −1. Hence, T is a compartmental matrix. Moreover, T cannot contain traps, because the graph G does not. This implies that T is invertible (Fife, 1972), and therefore (ϕ, v0) ↦ v is one-to-one, with inverse given by v = −T(ϕ)−1b.
Appendix B. Free flux ratios
The flux ratios ϕij are heavily overparameterized. In this section, we outline how to obtain a minimal set of free flux ratios, in analogy with free fluxes. First, sinceΣj ϕij = 1, one of the ϕij is always redundant. Moreover, for reactions j that yield two or more products, one of the associated flux ratios will be redundant, since they derive from the same flux vj. To obtain a set of free flux ratios, we must first choose a single ratio ϕij for each reaction j such that v is still uniquely determined by the one-to-one mapping v ↔ (ϕ, v0). The choice of which ϕij to retain is not entirely arbitrary; to see this, define the bipartite graph G over the m metabolites and n reactions in the metabolic network S that has an edge i → j if Sij < 0 and j → i if Sij > 0, and associate each edge j → i with the ratio parameter ϕij, and each edge i → j with the ”throughput” . Then a flux vj can be determined if and only if there exists a path in G from vj to the sink v0. Discarding a ratio ϕij from the parameter set corresponds to deleting the edge j → i in G. For each reaction j, we must therefore choose a single ratio ϕij so that vj remains connected to v0 in G after deleting all other edges j → i′, i′ ≠ i. This is always possible, because at least one i must be connected to v0 in G through path that does not involve j, and also the operation of deleting an edge cannot break any paths from other reactions j to v0, so the reactions j can be processed in any order, and this will always result in exactly n remaining ratio parameters ϕij, one for each flux. These n ratios must determine the complete ϕ, and therefore they are 1-to-1 with v by Theorem 1. Now, if v is fully determined by a set of free fluxes {vj, j ∈ F}∪{v0}, then the corresponding free ratios must be exactly ϕij, j ∈ F, because there must be exactly |F| free ratios, and any ϕik with k ∉ F cannot be a free ratio as it determines vk which is not a free flux.
For example, in the toy model, a possible choice of free fluxes within the augmented network is {v0, v3, v7}. (In this case, the two release fluxes v7, v8 are linearly dependent.) Hence, of the 8 possible flux ratios, only 2 are free parmeters. We may for example choose ϕS7 and ϕA3 as free variables, as in Figure 3.
References
- Antoniewicz MR, Kelleher JK, Stephanopoulos G. Determination of confidence intervals of metabolic fluxes estimated from stable isotope measurements. Metabolic engineering. 2006 Jul;8(4):324–37. doi: 10.1016/j.ymben.2006.01.004. [DOI] [PubMed] [Google Scholar]
- Antoniewicz MR, Kelleher JK, Stephanopoulos G. Elementary metabolite units (EMU): a novel framework for modeling isotopic distributions. Metabolic engineering. 2007 Jan;9(1):68–86. doi: 10.1016/j.ymben.2006.09.001. [DOI] [PMC free article] [PubMed] [Google Scholar]
- Arita M. The metabolic world of escherichia coli is not small. Proceedings of the National Academy of Sciences of the United States of America. 2004;101(6):1543–1547. doi: 10.1073/pnas.0306458101. [DOI] [PMC free article] [PubMed] [Google Scholar]
- Beloribi-djefa S, Vasseur S, Guillaumond F. Lipid metabolic reprogramming in cancer cells. Oncogenesis. 2016;5:e189. doi: 10.1038/oncsis.2015.49. [DOI] [PMC free article] [PubMed] [Google Scholar]
- Cavuoto P, Fenech MF. A review of methionine dependency and the role of methionine restriction in cancer growth control and life-span extension. Cancer treatment reviews. 2012;38(6):726–736. doi: 10.1016/j.ctrv.2012.01.004. [DOI] [PubMed] [Google Scholar]
- Commisso C, Davidson SM, Soydaner-Azeloglu RG, Parker SJ, Kamphorst JJ, Hackett S, Grabocka E, Nofal M, Drebin JA, Thompson CB, Rabinowitz JD, Metallo CM, Vander Heiden MG, Bar-Sagi D. Macropinocytosis of protein is an amino acid supply route in ras-transformed cells. Nature. 2013;497(7451):633–637. doi: 10.1038/nature12138. [DOI] [PMC free article] [PubMed] [Google Scholar]
- Crown SB, Ahn WS, Antoniewicz MR. Rational design of 13 C-labeling experiments for metabolic flux analysis in mammalian cells. BMC Systems Biology. 2012;6:43. doi: 10.1186/1752-0509-6-43. [DOI] [PMC free article] [PubMed] [Google Scholar]
- DeBerardinis RJ, Mancuso A, Daikhin E, Nissim I, Yudkoff M, Wehrli S, Thompson CB. Beyond aerobic glycolysis: transformed cells can engage in glutamine metabolism that exceeds the requirement for protein and nucleotide synthesis. Proceedings of the National Academy of Sciences. 2007;104(49):19345–19350. doi: 10.1073/pnas.0709747104. [DOI] [PMC free article] [PubMed] [Google Scholar]
- Duarte NC, Becker SA, Jamshidi N, Thiele I, Mo ML, Vo TD, Srivas R, Palsson BØ. Global reconstruction of the human metabolic network based on genomic and bibliomic data. Proceedings of the National Academy of Sciences. 2007;104(6):1777–1782. doi: 10.1073/pnas.0610772104. [DOI] [PMC free article] [PubMed] [Google Scholar]
- Duckwall CS, Murphy TA, Young JD. Mapping cancer cell metabolism with (13)c flux analysis: Recent progress and future challenges. Journal of Carcinogenesis. 2013;12:13. doi: 10.4103/1477-3163.115422. [DOI] [PMC free article] [PubMed] [Google Scholar]
- Fife D. Which linear compartmental systems contain traps? Mathematical Biosciences. 1972;14(3):311–315. [Google Scholar]
- Fu TF, Rife JP, Schirch V. The role of serine hydroxymethyltransferase isozymes in one-carbon metabolism in MCF-7 cells as determined by (13)C NMR. Archives of biochemistry and biophysics. 2001 Sep;393(1):42–50. doi: 10.1006/abbi.2001.2471. [DOI] [PubMed] [Google Scholar]
- Gopalakrishnan S, Maranas CD. 13c metabolic flux analysis at a genome-scale. Metabolic Engineering. 2015;32:12–22. doi: 10.1016/j.ymben.2015.08.006. [DOI] [PubMed] [Google Scholar]
- Gunther UL, Chong MG, Volpari T, Koczula KM, Atkins K, Bunce CM, Khanim FL. Metabolic Fluxes in Cancer Metabolism. In: Mazurek S, Shoshan M, editors. Tumor Cell Metabolism. Ch. 14. 2015. pp. 315–347. [Google Scholar]
- Hörl M, Schnidder J, Sauer U, Zamboni N. Non-stationary (13)C-metabolic flux ratio analysis. Biotechnology and Bioengineering. 2013 Dec;110(12):3164–3176. doi: 10.1002/bit.25004. [DOI] [PubMed] [Google Scholar]
- Isermann N, Wiechert W. Metabolic isotopomer labeling systems. Part II : structural flux identifiability analysis. Mathematical biosciences. 2003;183:175–214. doi: 10.1016/s0025-5564(02)00222-5. [DOI] [PubMed] [Google Scholar]
- Jain M, Nilsson R, Sharma S, Madhusudhan N, Kitami T, Souza AL, Kafri R, Kirschner MW, Clish CB, Mootha VK. Metabolite profiling identifies a key role for glycine in rapid cancer cell proliferation. Science. 2012;336(6084):1040–1044. doi: 10.1126/science.1218595. [DOI] [PMC free article] [PubMed] [Google Scholar]
- Jiang P, Du W, Mancuso A, Wellen K, Yang X. Reciprocal regulation of p53 and malic enzymes modulates metabolism and senescence. Nature. 2013;493:689–693. doi: 10.1038/nature11776. [DOI] [PMC free article] [PubMed] [Google Scholar]
- Jones JG, Solomon Ma, Cole SM, Sherry aD, Malloy CR. An integrated (2)H and (13)C NMR study of gluconeogenesis and TCA cycle flux in humans. American journal of physiology. Endocrinology and metabolism. 2001;281(4):E848–E856. doi: 10.1152/ajpendo.2001.281.4.E848. [DOI] [PubMed] [Google Scholar]
- Kell DB, Brown M, Davey HM, Dunn WB, Spasic I, Oliver SG. Metabolic footprinting and systems biology: the medium is the message. Nature reviews microbiology. 2005;3(7):557–565. doi: 10.1038/nrmicro1177. [DOI] [PubMed] [Google Scholar]
- Kogadeeva M, Zamboni N. SUMOFLUX: A generalized method for targeted 13C metabolic flux ratio analysis. PLoS Computational Biology. 2016;12(9):e1005109. doi: 10.1371/journal.pcbi.1005109. [DOI] [PMC free article] [PubMed] [Google Scholar]
- Lange HC, Heijnen JJ. Statistical reconciliation of the elemental and molecular biomass composition of Saccharomyces cerevisiae. Biotechnology and Bioengineering. 2001;75(3):334–344. doi: 10.1002/bit.10054. [DOI] [PubMed] [Google Scholar]
- Leighty RW, Antoniewicz MR. Parallel labeling experiments with [U-13C]glucose validate E. coli metabolic network model for 13C metabolic flux analysis. Metabolic engineering. 2012;14(5):533–41. doi: 10.1016/j.ymben.2012.06.003. [DOI] [PubMed] [Google Scholar]
- Marin-Valencia I, Yang C, Mashimo T, Cho S, Baek H, Yang XL, Rajagopalan KN, Maddie M, Vemireddy V, Zhao Z, Cai L, Good L, Tu BP, Hatanpaa KJ, Mickey BE, Matés JM, Pascual JM, Maher Ea, Malloy CR, Deberardinis RJ, Bachoo RM. Analysis of tumor metabolism reveals mitochondrial glucose oxidation in genetically diverse human glioblastomas in the mouse brain in vivo. Cell metabolism. 2012 Jun;15(6):827–37. doi: 10.1016/j.cmet.2012.05.001. [DOI] [PMC free article] [PubMed] [Google Scholar]
- Mattaini KR, Sullivan MR, Vander Heiden MG. The importance of serine metabolism in cancer. The Journal of Cell Biology. 2016 doi: 10.1083/jcb.201604085. jcb-201604085. [DOI] [PMC free article] [PubMed] [Google Scholar]
- Metallo CM, Gameiro PA, Bell EL, Mattaini KR, Yang J, Hiller K, Jewell CM, Johnson ZR, Irvine DJ, Guarente L, et al. Reductive glutamine metabolism by idh1 mediates lipogenesis under hypoxia. Nature. 2012;481(7381):380–384. doi: 10.1038/nature10602. [DOI] [PMC free article] [PubMed] [Google Scholar]
- Metallo CM, Walther JL, Stephanopoulos G. Evaluation of 13C isotopic tracers for metabolic flux analysis in mammalian cells. Journal of biotechnology. 2009;144(3):167–74. doi: 10.1016/j.jbiotec.2009.07.010. [DOI] [PMC free article] [PubMed] [Google Scholar]
- Möllney M, Wiechert W, Kownatzki D, de Graaf aa. Bidirectional reaction steps in metabolic networks: IV. Optimal design of isotopomer labeling experiments. Biotechnology and bioengineering. 1999 Jan;66(2):86–103. doi: 10.1002/(sici)1097-0290(1999)66:2<86::aid-bit2>3.0.co;2-a. [DOI] [PubMed] [Google Scholar]
- Mu F, Williams RF, Unkefer CJ, Unkefer PJ, Faeder JR, Hlavacek WS. Carbon-fate maps for metabolic reactions. Bioinformatics. 2007;23(23):3193–3199. doi: 10.1093/bioinformatics/btm498. [DOI] [PubMed] [Google Scholar]
- Niklas J, Schneider K, Heinzle E. Metabolic flux analysis in eukaryotes. Current opinion in biotechnology. 2010;21(1):63–69. doi: 10.1016/j.copbio.2010.01.011. [DOI] [PubMed] [Google Scholar]
- Nilsson R, Jain M. Simultaneous tracing of carbon and nitrogen isotopes in human cells. Mol BioSyst. 2016;12:1929–1937. doi: 10.1039/c6mb00009f. [DOI] [PMC free article] [PubMed] [Google Scholar]
- Rantanen A, Rousu J, Jouhten P, Zamboni N, Maaheimo H, Ukkonen E. An analytic and systematic framework for estimating metabolic flux ratios from 13C tracer experiments. BMC bioinformatics. 2008 Jan;9:266. doi: 10.1186/1471-2105-9-266. [DOI] [PMC free article] [PubMed] [Google Scholar]
- Sauer U, Lasko DR, Fiaux J, Hochuli M, Glaser R, Szyperski T, Wüthrich K, Bailey JE. Metabolic flux ratio analysis of genetic and environmental modulations of Escherichia coli central carbon metabolism. Journal of bacteriology. 1999;181(21):6679–88. doi: 10.1128/jb.181.21.6679-6688.1999. [DOI] [PMC free article] [PubMed] [Google Scholar]
- Schilling CH, Letscher D, Palsson BØ. Theory for the systemic definition of metabolic pathways and their use in interpreting metabolic function from a pathway-oriented perspective. Journal of theoretical biology. 2000;203(3):229–248. doi: 10.1006/jtbi.2000.1073. [DOI] [PubMed] [Google Scholar]
- Sellers K, Fox MP, Ii MB, Slone SP, Higashi RM, Miller DM, Wang Y, Yan J, Yuneva MO, Deshpande R, Lane AN, Fan TW. Pyruvate carboxylase is critical for non small-cell lung cancer proliferation. The Journal of clinical investigation. 2015;125(2):687–698. doi: 10.1172/JCI72873. [DOI] [PMC free article] [PubMed] [Google Scholar]
- Shlomi T, Fan J, Tang B, Kruger WD, Rabinowitz JD. Quantitation of cellular metabolic fluxes of methionine. Analytical Chemistry. 2014;86(3):1583–1591. doi: 10.1021/ac4032093. [DOI] [PMC free article] [PubMed] [Google Scholar]
- Suthers PF, Burgard AP, Dasika MS, Nowroozi F, Van Dien S, Keasling JD, Maranas CD. Metabolic flux elucidation for large-scale models using 13 c labeled isotopes. Metabolic engineering. 2007;9(5):387–405. doi: 10.1016/j.ymben.2007.05.005. [DOI] [PMC free article] [PubMed] [Google Scholar]
- Tang Y, Martin H, Myers S, Rodriguez S, Baidoo E, Keasling J. Advances in analysis of microbial metabolic fluxes via 13C isotopic labeling. Mass spectrometry reviews. 2009;28:362–375. doi: 10.1002/mas.20191. [DOI] [PubMed] [Google Scholar]
- Tibshirani R. Regression shrinkage and selection via the lasso: a retrospective. Journal of the Royal Statistical Society: Series B (Statistical Methodology) 2011;73(3):273–282. [Google Scholar]
- Wiechert W, Siefke C, de Graaf aa, Marx A. Bidirectional reaction steps in metabolic networks: II. Flux estimation and statistical analysis. Biotechnology and bioengineering. 1997;55(1):118–35. doi: 10.1002/(SICI)1097-0290(19970705)55:1<118::AID-BIT13>3.0.CO;2-I. [DOI] [PubMed] [Google Scholar]
- Xie L, Wang DI. Applications of improved stoichiometric model in medium design and fed-batch cultivation of animal cells in bioreactor. Cytotechnology. 1994 Jan;15(1–3):17–29. doi: 10.1007/BF00762376. [DOI] [PubMed] [Google Scholar]
- Zamboni N, Fendt SM, Rühl M, Sauer U. (13)C-based metabolic flux analysis. Nature protocols. 2009 Jan;4(6):878–92. doi: 10.1038/nprot.2009.58. [DOI] [PubMed] [Google Scholar]
Associated Data
This section collects any data citations, data availability statements, or supplementary materials included in this article.