

Abstract
This study examines network centrality of inter-venue networks formed by collaboration, competition, and sponsorship relationships among venues that serve young men who have sex with men (MSM) aged 16 to 29 years in relation to their geographical concentrations in Chicago, Illinois, and Houston, Texas. Our data on the physical venues comprised 116 venues in Chicago and 102 venues in Houston. We examined the relationship between the network centrality of different relations and the geographical intensity among these venues, and considered neighborhood-level socioeconomic determinants of health. The results indicate that young MSM-serving social and service venues found in close physical proximity to one another tended to have large centrality indegree values based on competition in both cities, and based on collaboration only in Chicago. No evidence, however, was found that occupying a central position in the sponsorship networks was related to geographic concentration. Combined, these results suggest that HIV prevention interventions should consider the organizing force for competition. Such a strategy could result in better services, yet there may still be potential for overlap and redundancy in services at the expense of under-served regions where proven interventions could have the greatest impact.
Keywords: social capital, young MSM, HIV, social network analysis, spatial analysis, venue networks, gay community, gay neighborhood
Introduction
Men who have sex with men (MSM) have been severely affected by HIV in the United States, with notable increases in the number of new infections among young MSM (YMSM).1 YMSM often socialize with other men in the community contexts of gay neighborhoods. Some gay neighborhoods form “gay enclaves” that take visible forms of community contexts, with concentrations of gay institutions, such as gay bars and clubs, and represented by gay subcultures.2,3 These gay neighborhoods accentuate social behaviors of gay men, serving as both HIV health promoters and as risk subcultures.2 That is, they encourage both risk-taking and protective health behaviors.4
The influence of neighborhood-level social environments on these men’s health interacts in a complex way with individual-level characteristics, such as socioeconomic status, sexual orientation, and racial/ethnic identification.5 In some regions, many residents in gay enclaves are not gay, and, thus, the gay enclaves are distinct from other neighborhoods without concentrations of gay institutions but with substantial concentrations of MSM.3 YMSM of color and low SES often travel outside of their home neighborhoods to socialize with other MSM.6
Irrespective of whether gay neighborhoods exist in a given city or not, spatial clustering of HIV is associated with neighborhood characteristics.7 HIV risk behaviors may be clustered by neighborhood, and thus HIV transmission tends to be geographically bounded in high HIV-prevalence areas.8 Neighborhood factors that influence HIV-related risk and disease prevalence among MSM include sexual orientation-based discrimination,9 the level of physical or social isolation, living in less “walkable” neighborhoods, and the proportion of vacant buildings.10 In this regard, the migration to urban gay communities5 is an important factor to consider with regard to HIV-related behaviors.
Gay presence within a neighborhood may influence protective sexual behaviors among MSM.11 Social support networks among gay men provide sources of social capital12 through their reinforcement of norms about protective behaviors or the constraint of norms of conformity to risk behaviors3 and shape MSM’s health and risk behaviors.13–17 These social networks are interrelated with neighborhood and geographic factors that influence HIV risk and transmission, as the networks are likely to be formed and maintained in the same neighborhood.8 More specifically, the association between gay neighborhoods and HIV risk behaviors is mediated by the composition of the social networks among gay men.2 For instance, network membership in residential neighborhoods is different from those of urban areas, as has been documented in the case of African American MSM who have younger, gay-identified friends as social network members at bars and clubs, and who are different from the members of their network based on the location of their residence.18 This implies that the social capital resources that flow into gay men’s personal networks are shaped by neighborhoods and geographic factors, highlighting the importance of neighborhood conditions on health inequalities at the community level.
In this study, we conceptualize social capital at the neighborhood level and assume that resources that serve YMSM aged 16 to 29 flow through relationships among venues with different network contexts. These venues include YMSM-related social and health service venues, and network contexts include inter-venue linkages based on collaboration, competition, and sponsorship relations.19 By theoretically framing neighborhood-based social capital with network theory in organizational studies, our study aims at investigating whether venues that are centrally located in network contexts are also geographically concentrated, thus indicating that they have power over HIV-related resources. Methodologically, we examine the associations between network centralities of various relational types (i.e., competition, collaboration, and sponsorship) and any geographical clustering among them, taking into account several neighborhood-level factors such as HIV seroprevalence, poverty level, and income inequality. In our analysis, we employ both a social network analytic approach, to compute network centralities, and a spatial statistical approach that models the intensity of the venue location patterns in Chicago and Houston.
Neighborhood-based Social Capital Resources
Social science research on socioeconomic determinants of health integrates Pierre Bourdieu’s resource-related conceptualization of social capital20 into a theoretical framework of neighborhood social processes.21,22 The Bourdieu-based neighborhood social capital theory conceptualizes social capital as constituting the resources that are inherent within a social network in a neighborhood.21,22 Consequently, residents’ differential access to the neighborhood-level social capital resources determines individual or population health.23
The neighborhood-based social capital theory, however, is limited to a view of social capital resources that flow through the personal networks; it does not encompass a system-level view of social capital resources that flow through those “networked with other communities, institutions, and the political structures,”21 from which a neighborhood can draw its resources. Neighborhoods exhibit the levels of available resources through the existence of gay institutions, which constitute a community structure. Social capital also can be conceptualized at the neighborhood level as resources that flow through a networked system among physical spaces that are formed in response to the community’s need to serve the marginalized population.8 To examine the contextual network conditions that impose resource inequalities across communities, we incorporate the structure of the inter-organizational networks into the theoretical framework of neighborhood-level social capital resources.
Centrality in Organizational/Venue Networks
A network perspective conceives of a community structure as an aggregate network of interorganizational relations,24 and the position determines the degree of power that an organization has to generate resource dependencies from others in the network.24–28 A central position based on indegree, which is a measure of relative frequency of receiving resources from network members, reflects the proximity of power and dependence in the network.28
In the context of the MSM community, organizational/venue networks that serve MSM are often geographically concentrated in gay enclaves, such as Montrose in Houston, Boystown in Chicago, Chelsea in New York, and Castro in San Francisco. As grounded in the network concept of centrality, we posit that a few gay-serving institutions are located at the center of the inter-venue networks, have power over HIV-related resources, and generate dependencies from other marginal venues in different geographical locations. Community structures driven by the geographically based power and dependence among venues reflect a disparity in the resource distributions that serve young MSM. HIV testing, prevention, and treatment services tend to be clustered in a central community, and this centralization constitutes a structural barrier to more universally accessible community resources in low-income, marginal communities, such as in the case of the San Salvador Metropolitan area within which no health-related NGOs are located.29
Methods
Sampling Procedure and Data
The current study uses data collected from the larger multisite longitudinal network study, “YMAP: Young Men’s Affiliation Project of HIV Risk and Prevention Venue,” which is ongoing in Houston, Texas, and Chicago, Illinois. For YMAP, we created a list of 161 venues in Chicago and a list of 168 venues in Houston, based on their importance to the YMSM population (16–29 years old) as identified by investigators, staff members, community consultants’ experience and familiarity with the sites, and from prior research conducted in similar YMSM populations. We further validated the lists based on consultation with the members of Community Advisory Boards (CABs) and various community informants to ensure the listed venues did in fact serve YMSM. These venues were then categorized into four types according to HIV/STD risk and prevention: (1) Risk (bars, sex establishments, circuit parties, etc.), (2) Social (religious or sporting organizations, homeless shelters), (3) Health (clinics, HIV testing centers), and (4) Others (non-fixed-address organizations such as student or gaming groups).
We conducted two- to three-hour semi-structured interviews with a representative identified from each venue. The selection criteria for the representatives were: (1) having been affiliated with that venue for at least six or more months; (2) not planning to leave the venue in the next two years; (3) being legally able to enter/join the venue; (4) not being intoxicated, mentally or emotionally unstable, or otherwise unable to participate adequately in the interview. The interview included questions about venue characteristics and their relationships with other venues on the master list. Venue interviews were conducted using a computer-assisted personal interviewing protocol programmed in Qualtrics software.30
Data
Venue network data
This study used three different types of relationships between venues. The first relationship is “collaboration,” which concerns whether venues have worked together on any activity, project, or event with a common goal, formally or informally. The second relation is “competition,” which focuses on whether a venue regards the other venue as a competitor for revenue, clientele or membership, employees, or other resources. The third relationship is “sponsorship,” which pertains to whether a venue financed part or all of an activity, project, or event carried out by the other venue. Respondents were provided with a roster of all venues, inclusive of both physical and virtual venues (158 venues in Chicago and 162 in Houston) and were asked to nominate any additional venue(s) under each of the relational types.
Spatial venue data
A point-pattern dataset was created from the spatial locations of all of the observed “gay venues” in Chicago and Houston. We used Euclidean coordinates, measured in kilometers, by projecting the coordinate system for the data from longitude and latitude onto the appropriate UTM coordinates (in meters) through the R packages “sp” and “proj4.” For our analysis, we used 116 physical venues (with addresses) in Chicago and 102 venues in Houston, excluding other venues that are virtual or without physical addresses.
Community-level data
CDC HIV surveillance data through 2012 at the ZIP code level were obtained through AIDSVu.31 We used ZIP code-level HIV prevalence rates from 2008 to 2014, per 100,000; equivalent HIV rates in cases per 100,000 Blacks; an index of income inequality measured by the Gini coefficient, with 0 reflecting complete equality and 1 reflecting complete inequality; and percentage of population that was living in poverty for Houston and Chicago. We used ZIP code level data because this produces relatively small geographic regions compared to census tract or county level data.
Social Network Analysis
Visualization of networks among venues
We employed the igraph software package v0.7.132 in the R statistical software system v3.1.2 to visualize the structure of venue networks for each relational type in each city.
Centrality measure
We computed indegree centrality33 by counting the number of received ties from other venues for collaboration, competition, and sponsorship ties, using UCINET 6.34 Among various measures of centrality,33 we chose indegree centrality that is based on direct incoming ties for both theoretical and methodological reasons. Theoretically, indegree centrality better reflects the influential and prestigious roles that venues incorporate within the network, and, methodologically, it is more robust to low sampling rates when compared with most other centrality measures.35
Spatial Statistical Analysis
We fitted parametric models of the intensity (i.e., localized expected number of points per unit area) of the assumed spatial Poisson point processes that underlie the observed point patterns of gay venues. These models took the form of the exponential of a “linear predictor.” Such models are referred to in the literature as “log linear models.” Our datasets of spatial locations of MSM-serving venues were augmented by two conceptually different types of numerical variables, namely “marks” and “covariates.”36 The marks are associated with the spatial locations that constitute the point pattern and may be conceptualized as being additional coordinates of the points. In contrast, “covariates” are variables that are defined at all points of the observation window. For the point patterns under study, the observation windows consisted of the cities of Chicago and Houston. Covariates are potentially explanatory variables from which the intensity of the underlying process may be estimated.
The marks that we have used in the analyses are numeric marks that consist of the three types of indegree centrality measure, as discussed in the preceding section on social network analysis. We also created a categorical mark, with the categories “surveyed” and “other.” A point (gay venue) is designated as “surveyed” if that venue was included (agreed to participate) in the survey that was conducted to collect data. Otherwise, the point was categorized as “other.” The Chicago point pattern data consisted of a total of 116 venues, of which 53 were “surveyed” and 63 were “other” venues. The Houston data consisted of a total of 102 venues, of which 59 were “surveyed” and 43 were “other” venues.
In our model-fitting procedure, we considered as potential explanatory covariates four ZIP code-level variables, namely, the overall HIV prevalence rate (HIV rate), the equivalent rate for the Black population (Black rate), the Gini index (Gini), and the percentage of the population that was living in poverty (Poverty). We also considered linear and quadratic terms in the Cartesian coordinates. For each city, a model-fitting exercise was undertaken in which we sought the simplest model that was not significantly different in its explanatory power from an initial full model that included all of the covariates referred to above. The modeling was conducted using the ppm() function from the spatstat package, version 1.40-0,37 in the R statistical software system v3.1.2.
The indegree marks are of primary interest in this study, but there is little or nothing available in the currently available methodology of spatial analysis for modeling point processes in terms of numeric marks. Consequently, we conducted a “diagnostic” analysis of the indegree marks in terms of the “mark correlation function” of the patterns for each of the three indegree measures (collaboration, competition, and sponsorship).
The “mark correlation function”37 measures, for each distance r, the statistical dependence between the marks attached to two points (i.e., venues) of the process at locations separated by that distance. Using the mark correlation function, we can test the null hypothesis that there is no relationship between the mark values—indegree values—of pairs of venues and the distance that separates these pairs of venues (i.e., that there is no correlation). The goal here is to investigate whether the indegree values influence interaction between venues (i.e., their tendency to attract or repulse each other). In estimating the mark correlation, we allowed for the fact that the underlying pattern of gay venues is inhomogeneous (i.e., has non-constant intensity) by using weights computed as the reciprocal of the estimated intensity function of the process.
The mark correlation functions were estimated using the markcorr() function from the spatstat package, version 1.40-0,37 in the R statistical software system v3.1.2. Hypothesis testing was conducted using the envelope function from the spatstat package and the Diggle-Cressie-Loosmore-Ford test implemented in the spatstat function dclf.test().
Results
Spatial Analysis
Figure 1 shows kernel density maps that are overlaid on top of HIV prevalence rates in Houston and Chicago.
Figure 1.
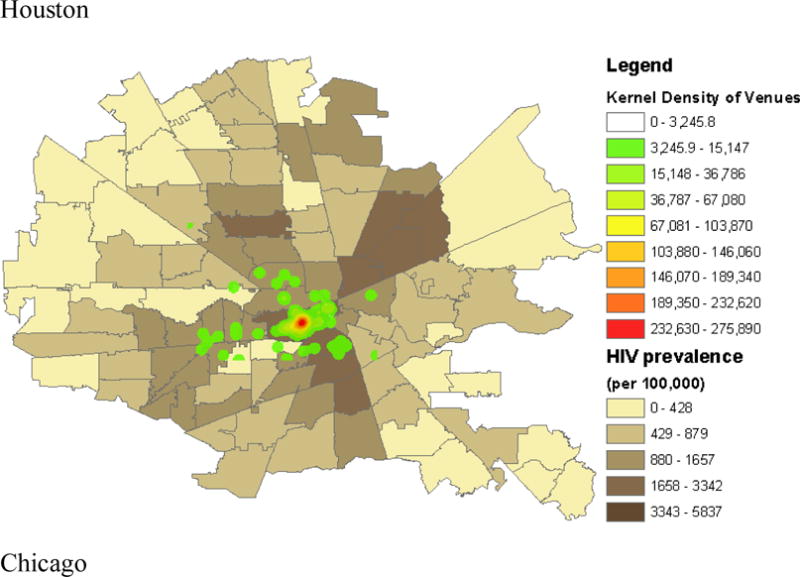
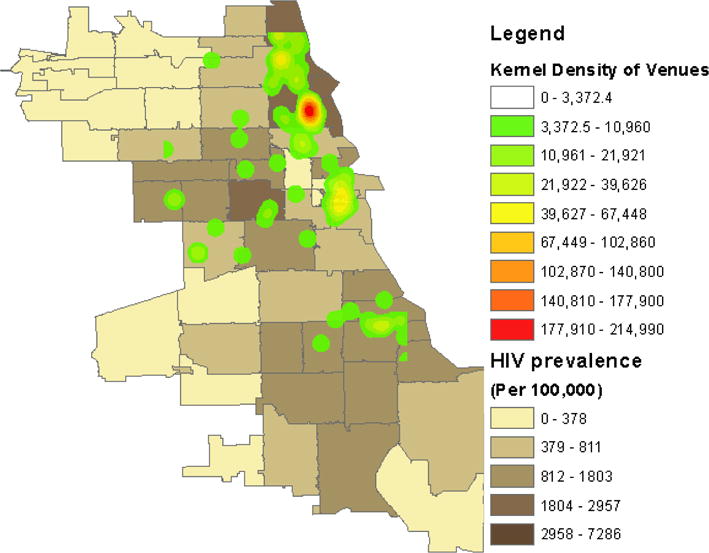
Display of kernel density of venue location superimposed on 2012–2013 Average Annual HIV Infection Diagnosis Case Rates (per 100,000) by Zip Code, Houston (top images: 59 interviewed venues and 43 other venues), and by Community Area, Chicago (bottom images: 53 interviewed venues and 63 other venues).
The results demonstrate that venues are distributed in a spatially inhomogeneous manner in both cities. In Houston, physical venues are concentrated in central Houston (the Montrose area), which is a region with high HIV prevalence rates.
In Chicago, in contrast, venues are concentrated in two major areas on the north side (Boystown), an area that is described as a gay enclave, and the mid-east sides of the central business district (The Loop), with high and middle levels of HIV prevalence rates. There are also small pockets of concentration on the south side. The concentration is most dense around Hyde Park, an area that is most generally frequented by young adults from the gay community but by other young adults as well.
Social Network Analysis
Figure 2 presents graphs of venue networks based on collaboration, competition, and sponsorship relationships for Houston and Chicago. The nodal size indicates the level of indegree, and nodal color indicates venue types (service, entertainment, and social).
Figure 2.
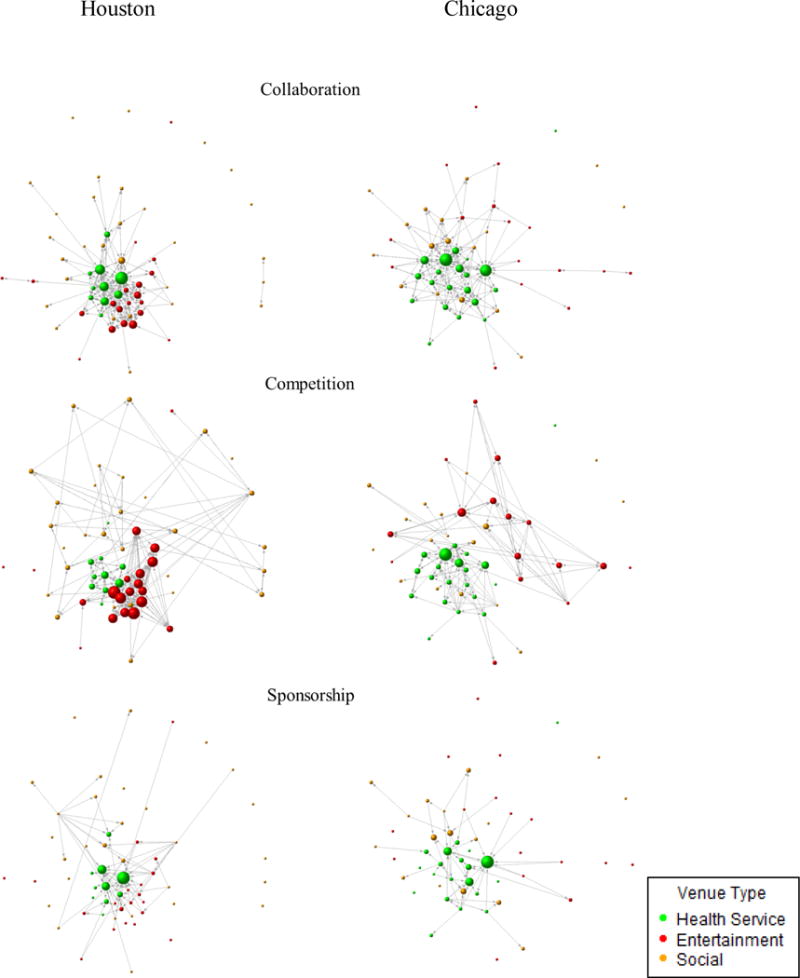
Venue networks of collaboration, competition, and sponsorship relationships for Houston and Chicago.
Collaboration networks exhibit different structural characteristics by city. Houston’s collaboration network comprises two major clusters, one of which was formed by a few high-indegree service venues and the other by several social venues. In contrast, the structure of Chicago’s collaboration network was determined mainly by a cluster of a few high-indegree service venues, with entertainment and social venues’ occupying marginal positions in the network. These marginal entertainment venues in Chicago’s collaboration network, however, turned out to be high-indegree venues in the competition network. In both cities, sponsored networks show similar structural patterns, with entertainment venues’ rarely being funded (low indegree), while a few service venues are well funded (high indegree). Table 1 shows the descriptive statistics of the variables observed in our sample.
Table 1.
Descriptive Statistics of Percentage (n) or Mean (SD; Min, Max) of Characteristics for Venue Sample (n = total across cities), YMAP, 2014
| Houston | Chicago | ||||
|---|---|---|---|---|---|
|
|
|||||
| Variable | Surveyed Venues (n = 59) | Other Venues (n = 43) | Surveyed Venues (n = 53) | Other Venues (n = 63) | |
| Venue Type | |||||
| Service | 16.95% (10) | 4.65% (2) | 37.70% (20) | 0% (0) | |
| Entertainment | 33.90% (20) | 30.23% (13) | 30.20% (16) | 57.14% (36) | |
| Social | 49.15% (29) | 65.12% (28) | 32.10% (17) | 42.86% (27) | |
| HIV Overall Rate | 3,855 (2,237.23; 278, 5,837) | 3,598 (1,974.38; 223, 5,837) | 2,101 (1,513.50; 483, 7,286) | 1,706 (948.35; 176, 2,957) | |
| Black HIV Rate | 9,873 (5,481.70; 1199, 14,460) | 9,136 (5,309.34; 738, 14,460) | 4,488 (2,586.44; 1,061, 8,107) | 4,200 (2,731.63; 416, 8,107) | |
| Gini Index | 0.54 (0.03; 0.43, 0.60) | 0.54 (0.04; 0.39, 0.58) | 0.51 (0.04; 0.40, 0.60) | 0.37 (0.04; 0.37, 0.60) | |
| Percentage of Poverty | 14.16 (6.54; 2.70, 38.10) | 14.78 (6.68; 3.2, 36.1) | 19.39 (9.29; 6.10, 36.70) | 17.91 (8.89; 5.10, 46.20) | |
| Collaboration Indegree | 3.93 (4.64; 0, 21) | 1.98 (3.04; 0, 13) | 3.55 (4.02; 0, 19) | 1.06 (1.60; 0, 6) | |
| Competition Indegree | 3.64 (3.20; 0, 12) | 1.98 (2.06; 0, 8) | 2.49 (2.27; 0, 12) | 1.37 (1.68; 0, 7) | |
| Sponsorship Indegree | 1.24 (2.78; 0, 16) | 0.53 (1.22; 0, 7) | 1.06 (1.68; 0, 9) | 0.37 (0.79; 0, 4) | |
Note: HIV Overall Rate: ZIP code-level HIV prevalence rates from 2008, to June 30, 2014, per 100,000; Black HIV Rate: equivalent HIV rates in cases per 100,000 Blacks; Gini index: Index of income inequality measured by the coefficient, with 0 as reflecting complete equality and 1 as reflecting complete inequality; Percentage of Poverty: Percentage of population that lives in poverty in Houston and Chicago.
Spatial Statistical Analysis
Fitting Poisson intensity model for venue patterns
Chicago
Fitting a Poisson intensity model that included four major ZIP code level covariates produced results in which three of the predictors, namely, HIV rate (estimated coefficient equal to 0.0005, SE = 1.221e−4), Black HIV rate (estimated coefficient equal to 0.0003, SE = 5.914e−5), and the Gini index (estimated coefficient equal to 14.23, SE = 2.244e+00), were significant at the α = 0.001 level. The fourth predictor, Poverty (estimated coefficient equal to −0.043, SE = 1.369e−02), was significant at the α = 0.01 level.
The estimated coefficients of the first three predictors are all positive, indicating a tendency for the intensity of the process to increase as the values of these covariates increase. It should be noted that the value of the positive coefficients of HIV rate and Black rate were very small, indicating that the influence of these covariates on the intensity of the process may not be practically significant. The coefficient of the Poverty covariate is negative, indicating a tendency for the intensity of the process to decrease as the percentage of the population that lives in poverty increases. A possible explanation for this phenomenon is that gay venues might tend to become established in regions that can afford them, i.e., wealthier regions. The addition of linear and quadratic terms in the Cartesian coordinates did not produce a significant improvement over the model with only the four ZIP code-level covariates.
Houston
Choosing a Poisson intensity model for the Houston data required a more complex and elaborate fitting and simplification procedure, the details of which we omit. The model that was finally chosen contains the predictors HIV rate (alone out of the four ZIP code-level covariates) and linear and quadratic terms in each of the Cartesian coordinates (the product term xy does not appear in the chosen model). All coefficients in the chosen model were significant at the α = 0.001 level. The estimated coefficient of the HIV rate covariate is 0.0007 (SE = 5.8920e−05), which is positive, as one might expect, but very small and, as such, may not be of practical significance. The intensity surface is roughly conical, with its maximum at x = 30.93 and y = 26.58, and it falls away from its maximum very rapidly. This roughly conical surface is a distortion (due to the influence of the HIV rate covariate) of the smooth surface that arises from the effect of the Cartesian coordinates.
Diagnostic analysis of indegree mark correlation functions
Figure 3 displays plots of the estimated mark correlation functions36 for the pattern of gay venues, marked by each of the indegree variables for Chicago (left) and Houston (right).
Figure 3.

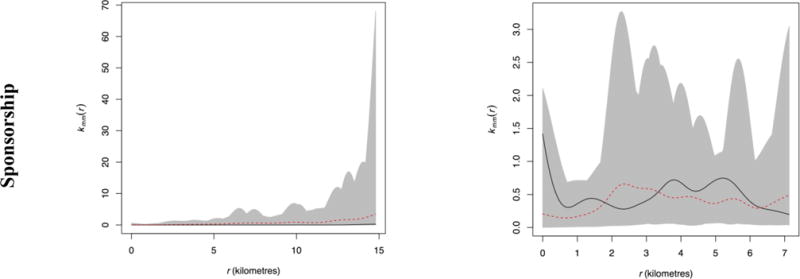
Mark correlation functions for the pattern of Houston gay venues (left) and Chicago gay venues (right), marked by each of the indegree centralities (collaboration, competition, and sponsorship).
The black lines are the estimated mark correlation functions for the observed venue pattern. The dashed red lines are the means of the estimated mark correlation functions of 99 patterns generated under the null hypothesis that there is no relationship between the mark values— indegree values—of pairs of venues and the distance that separates the corresponding pairs of venues (i.e., there is no correlation). The envelopes indicated by the boundaries of the grey area show the limits of the way that one would expect the mark correlation function to behave if the null model were appropriate to the data. Deviations or excursions above the upper envelope are an indication that venues separated by such distances tend to have large indegree values. The range of r-values over which the excursions occur is an indication of the separation distances at which pairs of venues tend to both have large (or small) marks. If a result is significant, the black line deviates from the mean in a more extreme manner than any of individual mark correlation functions that come from the randomly generated patterns. If the results are not significant, there is no evidence that the observations differ in any way from what one would expect under the null hypothesis (i.e., the black line behaves in the same way as any of the randomly generated mark correlation functions).
Chicago
The collaboration and competition indegree variables have mark correlation functions that differ significantly from that which would be expected under the null hypothesis (of no correlation). The corresponding Monte Carlo p-values (from the Diggle-Cressie-Loosmore-Ford test, based on 99 simulations) are 0.05 and 0.04 respectively. We observe that the mark correlation function for collaboration makes no actual excursion outside the simulation envelopes, and that for competition makes only a small excursion. However, the estimated functions for the real data deviate substantially from the mean of the functions estimated from simulated data sets with the deviations being most pronounced at distances from 4 to 4.5 kilometers. The mark correlation functions for the real data are noticeably larger than the mean from the simulated data sets at such distances. The interpretation of this result is that pairs of venues separated by distances of 4 to 4.5 kilometers tend both to have large values of the collaboration and competition indegree variables. The Monte Carlo p-values for other two indegree variables are both equal to 0.47, very far from being statistically significant.
Houston
Only the competition mark correlation function deviates significantly from the mean of those from the corresponding simulated patterns (p = 0.03). The observed mark correlation function for competition tracks the upper envelope fairly closely and consistently lies above the mean from the simulated patterns. It makes a substantial excursion above the upper envelope at around 12 km., where its deviation from the mean is greatest. This implies that pairs of venues separated by distances of about 12 km. tend both to have large values of the competition indegree variable. This may be a reflection of venues being more geographically dispersed in Houston as compared to those in Chicago. The Diggle-Cressie-Loosmore-Ford test p-values for collaboration and sponsorship are very large; 0.86 and 0.55 respectively. The shapes of the envelopes for the Houston data are very different from those for the Chicago data, which may be related to the quasi-circular shape of the Houston pattern and its window, as contrasted with the more elongated quasi-rectangular shapes that appear in the case of the Chicago data.
Discussion
The current study employed both social network analysis and spatial statistical analysis to examine the structural characteristics of indegree centrality in various types of relations of venue networks as a correlate of the geographical clustering of venues that serve young MSM. Our results indicate that gay-serving social and service venues found in clusters tend to have large centrality indegree values based on competition in both cities, and collaboration only in Chicago. This result could be interpreted as indicating that spatial proximity may create competition at the very least. For example, service venues might tend to be located where a community is located or where there are other similar venues, and such circumstances might lead to competition. It also may be the case that competition between venues drives the decision-making process by which venues determine where to locate. In Chicago, a long-standing gay enclave and more mature HIV service organizations could have resulted in increased collaboration over the years that comes from prolonged conflict or competition. In neither city was there evidence that venues that occupy a central position in the sponsorship network are geographically clustered. This observation indicates that resource recipients are not concentrated or focused geographically.
For Chicago, our analysis of the community-level environment in relation to social determinants of service indicates a tendency for venues to become more concentrated as the HIV rate and the Black HIV rate increase and as the income inequality becomes wider. In contrast, we found a tendency for venues to become less concentrated as the percentage of the population that lives in poverty increases. On the other hand, in Houston, the concentration of venues appears to be determined largely on a geographical basis, with a slight tendency for the concentration to increase as the HIV rate increases. The difference between cities is likely explained by the marked geographic segregation by race in Chicago, with limited investment in Black neighborhoods and with high HIV rates in both the Black neighborhoods and the gay enclave. This may reflect the existence of venues that cater to young MSM beyond the gay enclave in Chicago, following the spread of the epidemic to largely Black communities. That is, social capital in the form of health service and social venues and related individual networks may have spread (or co-existed) along with the venues. This could be the result of more social openness for such venues in these communities in Chicago and the economic and civic resources to support them. Ultimately, however, poverty may be a limiting factor.
Our results have several limitations. First, we analyzed a single (temporal) cross-section of data, and, thus, the directionality of influence between network centrality and geographic concentration is uncertain. Further, often, the distinction between relational context (social networks) and physical context (spatial locations) may not be clearcut.37 Although our results indicate a correlation between a specific type of network centrality and geographical proximity, it is not possible to infer that resource-rich venues choose to physically locate in the center of MSM-serving communities or around areas where other resource-rich venues are located for ease of communication among those venues. It is also possible that venues at the center of MSM communities may become influential and, thus, resource rich due to their physical location, having more opportunities to interact with the other resource-rich venues. Future research should investigate the dynamics that link network centrality to spatial location.
Second, in our modeling of the intensity of the process that generates the locations of gay venues, we have (so far) assumed a Poisson process. Some diagnostics that we have run indicate that, for both Chicago and Houston, this assumption may be invalid. That is, there may be some form of interaction between the points of the process. Our diagnostics indicate that the interaction, if present, takes the form of attraction or clustering. Exploring the nature of this interaction is a topic for future research.
Third, the venues are located on city streets; thus, strictly speaking, distances between them should be ideally measured along the streets. Consequently, these patterns should ideally be analyzed as patterns on a linear network,36 not as patterns in the Euclidean plane. Such an analysis, however, would require obtaining the locations on street maps (of Chicago and Houston) as well as determining the scale of the distances along the streets. Because the analysis of patterns on linear networks is much more subtle and complex than the analysis of patterns in the plane, and the development of the theory and methodology is in its infancy, we consider our method of using planar point pattern analysis to be an acceptable approximation. Nevertheless, it could be re-examined by means of the analysis of patterns on linear networks in future research.
Fourth, while our venue samples are representative within each city, our findings may have some limitations in respect to generalization to other cities in the U.S. or other cities internationally. The patterns found within each city, however, may apply to other northern and southern urban areas at the national level, i.e., results from Chicago may be applicable to other large segregated Midwest cities and those from Houston to other large Southern cities. In addition, because of particular political structures in different regions of the US, the resulting funding climate may influence formation of venue networks in gay communities.19 Although such generalizability is beyond the scope of this two-city study, it is worth exploring in future research.
Lastly, as the goal of this paper is to examine geographical concentration in relation to network characteristics, our analysis excluded venues that are not public such as private parties. We also excluded events assuming given that singular events likely have limited impact on venues over time. Our analysis also excluded virtual venues (online dating sites, or social networking sites), and non-physical based organizations, for the same reasons, i.e., lack of a physical address, and the potentially nested nature of virtual venues within physical venues (e.g. Hook-up apps are often used within physical venues, such as gay bars) that may confound results. Virtual venues are becoming increasingly important in how YMSM meet one another and may in fact play an important role in understanding how the YMSM community is structured. Future research should explore potentially mediating effect of such venues on the association between network centrality and geographical proximity.
Despite these limitations, our study demonstrates the utility of conceptualizing neighborhood-level social capital at the venue level and examining structural/contextual factors that characterize a networked system among geographically based MSM-serving venues. Further, this study demonstrates the potential importance of competition relationships among risk/social or service venues. It is unclear, however, whether competition among venues has a positive or negative impact on service delivery or socialization. Nevertheless, we expect that this competition to increase as the HIV epidemic continues to decline, with the concomitant decreases in funding for services and with the MSMs becoming more integrated into society and more evenly dispersed geographically. Future HIV prevention interventions must thus account for this competition and take advantage of the efficiency that such competition may bring to the table, while, at the same time, ensure that clients are able to socialize and receive services that are based upon their individual needs and the respective agencies.
Acknowledgments
Funding information
This study was supported by the National Institutes of Health/NIMH 1R01MH100021, 1R01DA039934, and NIGMS 1R21GM113694. The content is the sole responsibility of the authors and does not necessarily represent the official views of the National Institutes of Health. The authors acknowledge contributions of Dennis Li and YMAP staff in both Houston and Chicago to this study.
Research involved human participants and informed consent was obtained. All study procedures were approved by the Committees for the Protection of Human Subjects at the University of Texas Health Science Center at Houston, the University of Chicago, and the Ann & Robert H. Lurie Children’s Hospital of Chicago.
Footnotes
Conflict of Interest: The authors declare that they have no conflict of interest.
References
- 1.Centers for Disease Control and Prevention (CDC) CDC fact sheet: HIV among gay and bisexual men. National Center for HIV/AIDS, Viral Hepatitis, STD, and TB Prevension, Division of HIV/AIDS Prevention; 2015. [Google Scholar]
- 2.Kelly BC, Carpiano RM, Easterbrook A, Parsons JT. Sex and the community: the implications of neighbourhoods and social networks for sexual risk behaviours among urban gay men. Sociol Health Illn. 2012;34(7):1085–1102. doi: 10.1111/j.1467-9566.2011.01446.x. [DOI] [PubMed] [Google Scholar]
- 3.Carpiano RM, Kelly BC, Easterbrook A, Parsons JT. Community and drug use among gay men: the role of neighborhoods and networks. J Health Soc Behav. 2011;52(1):74–90. doi: 10.1177/0022146510395026. [DOI] [PubMed] [Google Scholar]
- 4.Buttram M, Kurtz SP. Risk and protective factors assocaited with gay neighborhood residence. Am J Mens Health. 2013;7(2):110–118. doi: 10.1177/1557988312458793. [DOI] [PMC free article] [PubMed] [Google Scholar]
- 5.Egan JE, Frye V, Krutz SP, et al. Migration, neighborhoods, and networks: Approaches to understanding how urban environmental conditions affect syndemic adverse health outcomes among gay, bisexual and other men who have sex with men. AIDS Behav. 2011;15(Suppl 1):S35–S50. doi: 10.1007/s10461-011-9902-5. [DOI] [PMC free article] [PubMed] [Google Scholar]
- 6.Dragowski EA, Halkitis PN, Moeller RW, Siconolfi DE. Social and sexual contexts explains sexual risk taking in young gay, bisexual, and other young men who have sex with men, ages 13–29 years. J HIV AIDS Soc Serv. 2013;12:236–255. [Google Scholar]
- 7.Martinez AN, Mobley LR, Lorvick J, Novak SP, Lopez A, Kral AH. Spatial analysis of HIV positive injection drug users in San Francisco, 1987 to 2005. Int J Environ Res Public Health. 2014;11:3937–3955. doi: 10.3390/ijerph110403937. [DOI] [PMC free article] [PubMed] [Google Scholar]
- 8.Latkin CA, German D, Vlahov D. Neighborhoods and HIV: A social ecological approach to prevention and care. Am Psychol. 2013;68(4):210–224. doi: 10.1037/a0032704. [DOI] [PMC free article] [PubMed] [Google Scholar]
- 9.Frye V, Nandi V, Egan JE, et al. Sexual orientation- and race-based disrimination and sexual HIV risk behavior among urban MSM. AIDS Behav. 2015;19:257–269. doi: 10.1007/s10461-014-0937-2. [DOI] [PMC free article] [PubMed] [Google Scholar]
- 10.Phillips GI, Birkett M, Kuhns L, Hatchel T, Garofalo R, Mustanski B. Neighborhood-level associations with HIV infection among young men who have sex with men in Chicago. Arch Sex Behav. 2015;44:1773–1786. doi: 10.1007/s10508-014-0459-z. [DOI] [PMC free article] [PubMed] [Google Scholar]
- 11.Frye V, Koblin B, Chin J, et al. Neighborhood-level correlates of consistent condom use among men who have sex with men: A multi-level analysis. AIDS and Behav. 2010;14(4):974–985. doi: 10.1007/s10461-008-9438-5. [DOI] [PMC free article] [PubMed] [Google Scholar]
- 12.Portes A. Social capital: Its origins and applications in modern sociology. Am Rev Sociol. 1998;24:1–24. [Google Scholar]
- 13.Wohl AR, Galvan FH, Myers HF, et al. Do social support, stress, disclosure and stigma influence retention in HIV care for Latino and African American men wh o have sex with men and women? AIDS Behav. 2011;15:1098–1110. doi: 10.1007/s10461-010-9833-6. [DOI] [PubMed] [Google Scholar]
- 14.Wong CF, Schrager SM, Holloway IW, Maeyer IH, Kipke MD. Minority stress experiences and psychological well-being: The impact of support from and connection to social netowrks within the Los Angeles house and ball communities. Prev Sci. 2014;15:44–55. doi: 10.1007/s11121-012-0348-4. [DOI] [PMC free article] [PubMed] [Google Scholar]
- 15.Kapadia F, Siconolfi DE, Barton S, Olivieri B, Lombardo L, Halkitis PN. Social support network characteristics an sexual risk taking among a racially/ethnically diverse sample of young, urban men who have sex with men. AIDS Behav. 2013;17:1819–1828. doi: 10.1007/s10461-013-0468-2. [DOI] [PMC free article] [PubMed] [Google Scholar]
- 16.Schneider JA, Stuart M, Alida B. Family network proportion and HIV risk among Black men who have sex with men. J Acquir Immune Defic Syndr. 2012;61(5):627–635. doi: 10.1097/QAI.0b013e318270d3cb. [DOI] [PMC free article] [PubMed] [Google Scholar]
- 17.Schneider JA, Cornwekk B, Ostrow D, Michaels S, Schumm P. Network mixing and network influences most linked to HIV infection and risk behavior in the HIV epidemic among Black men who have sex with men. Am J Public Health. 2013;103(1):E28–E36. doi: 10.2105/AJPH.2012.301003. [DOI] [PMC free article] [PubMed] [Google Scholar]
- 18.Tobin KE, Latkin CA, Curriero FC. An examination of places where African American men who have sex with men (MSM) use drugs/drink alcohol: A focus on social and spatial characteristics. Int J Drug Policy. 2014;25:591–597. doi: 10.1016/j.drugpo.2013.12.006. [DOI] [PMC free article] [PubMed] [Google Scholar]
- 19.Fujimoto K, Wang P, Kuhns L, et al. Multiplex competition, collaboration, and funding networks among social and health organizations: towards organization-based HIV interventions for young men who have sex with men. Med Care. doi: 10.1097/MLR.0000000000000595. in press. [DOI] [PMC free article] [PubMed] [Google Scholar]
- 20.Bourdieu P. The forms of capital. In: Richardson JG, editor. Handbook of Theory and Research for the Sociology of Education. New York: Greenwood; 1986. pp. 241–258. [Google Scholar]
- 21.Carpiano RM. Toward a neighborhood resouce-based theory of soical capital for health: Can Bourdieu and sociology help? Soc Sci Med. 2006;62:165–175. doi: 10.1016/j.socscimed.2005.05.020. [DOI] [PubMed] [Google Scholar]
- 22.Carpiano RM. Actual or potential neighborhood resouces for health: What can Broudieu offer for understanding mechanisms linking soical capital to health? In: Kawachi I, Kim D, Subramanian SV, editors. Social Capital and Health. New York: Springer; 2008. pp. 83–94. [Google Scholar]
- 23.Carpiano RM. Neighborhood social capital and adult health: An empirical test of a Bourdieu-based model. Health Place. 2007;13:639–655. doi: 10.1016/j.healthplace.2006.09.001. [DOI] [PubMed] [Google Scholar]
- 24.Laumann EO, Galakiewicz J, Marsden PV. Community structure as interorganizational linkages. Annu Rev Sociol. 1978;4:455–484. [Google Scholar]
- 25.Emerson R. Power-dependence relatoins. Am Sociol Rev. 1962;27:31–41. [Google Scholar]
- 26.Astley WG, Sachdeva PS. Structural sources of interorganizational power: A theoretical synthesis. Acad Manage Rev. 1984;9:104–113. [Google Scholar]
- 27.Burt R. Power in a social topology. Soc Sci Res. 1977;6:1–83. [Google Scholar]
- 28.Hoffman AN, Stearns TM, Shrader CB. Structure, context, and centrality in interorganizational networks. J Bus Res. 1990;20:333–347. [Google Scholar]
- 29.Dickson-Gomez J, Corbett AM, Bodnar G, Rodriguez K, Guevara CE. Resouces and obstacles to developing and implementing a structural intervention to prevent HIV in San Salvador, El Savador. Soc Sci Med. 2010;70:351–359. doi: 10.1016/j.socscimed.2009.10.029. [DOI] [PMC free article] [PubMed] [Google Scholar]
- 30.ESRI. ArcGIS Desktop: Release 10. Redlands, CA: Environmental Systems Research Institute; 2011. [Google Scholar]
- 31.AIDSVu. Emory University, Rollins School of Public Health; Atlanta, GA: 2014. [Google Scholar]
- 32.Csardi G, Nepusz T. The igraph software package for complex network research. InterJournal, Complex Systems 1695. 2006 [Google Scholar]
- 33.Freeman LC. Centrality in social networks: Conceptual clarification. Soc Networks. 1979;24(4):385–394. [Google Scholar]
- 34.UCINET 6 for Windows. Software for Social Network Analysis [computer program]. Version 6. Harvard; Analytic Technologies; 2002. [Google Scholar]
- 35.Costenbader E, Valente TW. The stability of centrality measures when networks are sampled. Soc Networks. 2003;25:283–307. [Google Scholar]
- 36.Baddeley A, Rubak E, Turner R. Spatial point patterns: methodology and applications with R. CRC Press; 2015. [Google Scholar]
- 37.Baddeley A, Turner R, Rubak E. Package ‘spatstat’ Version 1.40-0. Spatial point pattern analysis, model-fitting, simulation, tests. 2014 [Google Scholar]