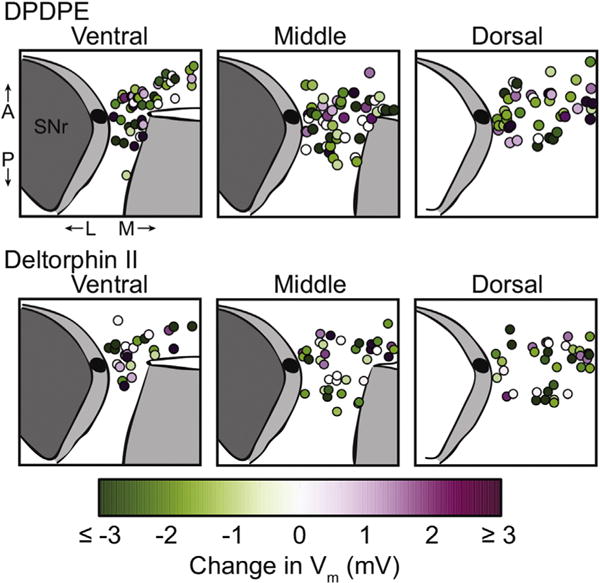
Fig. 6. Different DPDPE and deltorphin II responses were distributed throughout the VTA.

Recordings were made in horizontal midbrain slices and distributed throughout the VTA. Changes from baseline membrane potential are color coded in quiescent neurons here. There is no observed relationship between DOR response and recording location. (For interpretation of the references to colour in this figure legend, the reader is referred to the web version of this article.)
