

Abstract
Increasing physical activity among children is a potentially important public health intervention. Quantifying the economic and health effects of the intervention would help decision makers understand its impact and priority. Using a computational simulation model that we developed to represent all US children ages 8–11 years, we estimated that maintaining the current physical activity levels (only 31.9 percent of children get twenty-five minutes of high-calorie-burning physical activity three times a week) would result each year in a net present value of $1.1 trillion in direct medical costs and $1.7 trillion in lost productivity over the course of their lifetimes. If 50 percent of children would exercise, the number of obese and overweight youth would decrease by 4.18 percent, averting $8.1 billion in direct medical costs and $13.8 billion in lost productivity. Increasing the proportion of children who exercised to 75 percent would avert $16.6 billion and $23.6 billion, respectively.
Rising rates of obesity among children have caught the attention of many health care providers and health officials, leading to an increased focus on children’s diet and physical activity. Only 31.9 percent of children are “active to a healthy level” as defined by the Sports and Fitness Industry Association (performing twenty-five minutes of high-calorie-burning physical activity three times a week).1 From a policy perspective, however, without knowing the current physical activity landscape in children and the potential impact of increasing the number of children who meet the guidelines, policy makers and funders might not know where a strategy to increase children’s physical activity should rank among many competing priorities. Quantifying the resulting economic and health benefit would help decision makers understand the impact and priority of such a strategy.2,3
Quantifying this impact can be challenging. Although physical activity has immediate benefits such as improved mood,4 much of the impact occurs in the future, throughout a person’s lifetime. The benefits include reducing the risk of obesity and associated chronic diseases, such as coronary heart disease, diabetes, and cancer.5 While helping manage weight is certainly not the only health benefit of physical activity, its potential to reduce obesity and overweight prevalence alone makes increasing physical activity a potentially important public health intervention. To capture all of these weight-related downstream effects, we developed a computational simulation model that represents the current population of US children and shows how changes in levels of physical activity could affect them throughout their lifetime, and the resulting economic impact.
Study Data And Methods
MODEL OVERVIEW
To quantify the economic and health impact of increasing physical activity, we developed a two-stage computational simulation model that represented the US population of children ages 8–11 years in 2016 (for a detailed explanation of creating a representative virtual population, see the online Appendix).6 The first stage represented each child’s remaining adolescent years, up to adulthood at age eighteen. The second stage represented the progression of each “agent” (explained below) from the start of adulthood through the rest of his or her lifetime.
FIRST STAGE: CHILDHOOD YEARS
For modeling childhood years, we used an agent-based model that represented each child by a computational “agent” with independent decision-making abilities. Similar to a real child, each agent had a set of sociodemographic and clinical characteristics. Each agent’s age, sex, ethnicity, height, lean tissue mass, and fat tissue mass matched those of representative children from the 2005 and 2013 National Health and Nutrition Examination Survey (NHANES).7,8 NHANES data helped us create the initial distributions of agent heights and weights. Each agent also had an embedded metabolic model specific to his or her sex, weight, and age, which converted daily caloric intake and expenditure into corresponding daily weight changes.9
The simulations proceeded in one-day time steps, with each agent growing in height based on age- and height-adjusted nationally representative growth charts from the National Center for Health Statistics.10 Since this study focused on the impact of physical activity, each agent consumed a daily amount of calories to maintain a constant body mass index (BMI) percentile if his or her level of physical activity was unchanged.
In each simulated day, each agent had probabilities of engaging in physical activity, which translated to caloric expenditures. Different experiments (described below) looked at both the current participation in physical activity and the impact of increasing participation.11 The simulation continued until each agent reached age eighteen (for a summary of the input parameters for both stages of the model, see the Appendix).6
SECOND STAGE: ADULT YEARS
At age eighteen, each agent moved to the adult portion of the model, a Markov model we developed using TreeAge Pro 2015. A Markov model is useful for predicting future states, and we used it to predict changes in the agents’ obesity status and obesity-associated health outcomes.
We defined fifteen health states that corresponded to well-established clinical staging systems for obesity.12,13 (Such staging systems take into account both anthropometric measures of obesity, such as BMI, and the presence and severity of risk factors associated with excess weight.) These states represent a range from healthy to obese and include the clinical risk factors and health outcomes most strongly linked to obesity (for a detailed description of the states, see the Appendix).6
The BMI of each agent at the end of the childhood stage determined the agent’s health state at the beginning of the adult stage, which proceeded in one-year time steps until the agent moved to the death state as a result of either disease- or age-related mortality. Throughout the adult stage, the agents transitioned between health states based on age-related changes in weight status, physical activity habits, and dietary habits, as reflected in the Coronary Artery Disease Risk Development in Young Adults (CARDIA)14 and Atherosclerosis Risk in Communities (ARIC) studies.15 These population studies tracked adults over more than twenty years and collected a wide range of data on health outcomes and risk factors, including BMI. Each agent’s age and health state was associated with a probability of having four obesity-associated health outcomes: stroke, cancer, coronary heart disease, and the complications of type 2 diabetes mellitus (Appendix 2 provides details about the possible health outcomes and their probabilities).6 At each yearly time step, the probabilities of moving between different health states and having various health outcomes were directly linked to changes in BMI status.
In each simulated year, each agent accrued state-, health-outcome-, and age-specific medical costs, lost productivity, and quality-adjusted life-years (QALYs)—a routinely used summary measure of health outcome—that were specifically due to the agent’s BMI status (for example, the additional diseases and different health outcomes that an overweight person would have, compared to those of someone of normal weight). Note that all of these began accruing at age eighteen (for a detailed description of the included direct and indirect costs, see the Appendix).6
We used a 3 percent discount rate to convert all past and future costs to 2016 US dollars.
SIMULATION EXPERIMENTS
In addition to modeling the current levels of physical activity in the United States, we tested various experimental scenarios that increased the proportion of the youth population meeting guidelines for healthy levels of physical activity. Specifically, our simulation experiments explored scenarios in which an increasing proportion (50–100 percent) of US youth participated in physical activity at one of two levels: “active to a healthy level” (twenty-five minutes of high-calorie-burning physical activity three times a week, for all Americans ages six years and older), as defined by the Sports and Fitness Industry Association;1 and the level recommended by the Centers for Disease Control and Prevention (CDC) (sixty minutes of moderate physical activity each day, for children ages 6–17 years).
We chose these two different levels of physical activity for several reasons. First, both are widely used by various stakeholders. Second, “active to a healthy level” is a sports-based level, focusing on children participating in sports and used by organizations such as the Physical Activity Council11 and the Aspen Institute’s Project Play that promote the participation of youth in sports.1 Third, many sports programs and guidelines support participating in physical activity three times a week.16–20 Therefore, the focus of this level is more on higher-intensity activities. By contrast, the CDC level emphasizes physical activities such as walking or casual biking that are more frequent and of longer duration and that do not necessarily have to be as intense as very active sports. Therefore, experiments with both guidelines can help demonstrate the impact of emphasizing different aspects of physical activity (for a further description of measures of physical activity intensity, see the Appendix).6
LIMITATIONS
Our study had several limitations. First, all models were simplifications of reality21,22 and could not include all possible factors that affect the impact of changing rates of participation in physical activity. For example, to be conservative, we did not incorporate possible further declines in levels of physical activity as adolescents got older.23,24 Instead, we determined the value of increasing versus maintaining current levels. Incorporating a decline with age would further boost the value of increasing physical activity.
Second, our study assumed that changing levels of physical activity, regardless of intensity, would not affect diet. While some studies have suggested that increasing physical activity can lead to short-term increases in consumption, other studies have suggested that doing so can actually promote healthier lifestyles in general.5,25,26 Future studies can explore the impact of physical activity on dietary behaviors.
Third, our study focused on a specific set of common physical health effects associated with BMI changes and did not include the full spectrum of possible health effects, such as slowing of age-related loss of muscle mass and bone density and improving mental health and mood.27 Fourth, our use of the 3 percent inflation rate may underestimate future medical costs, as medical inflation has typically outpaced that in the Consumer Price Index.
Finally, the goal of our study was to quantify the impact of increasing physical activity in general, not to evaluate policies and interventions related to physical activity. Future studies evaluating physical activity policies and interventions need to further incorporate the costs of implementation and associated efficacies.
Study Results
CURRENT PHYSICAL ACTIVITY LEVELS
In our model, maintaining the current levels of physical activity—that is, 31.9 percent of children meeting the standard of “active to a healthy level”— resulted in 8,142,383 (95% range of variation from all scenario runs: 7,805,954, 8,478,811) youths being overweight or obese in America in 2020, which would result in a net present value of $1.1 (95% range: 0.95, 1.2) trillion in direct medical costs and $1.7 (95% range: 1.4, 1.9) trillion in lost productivity each year. Sixty-three percent of youths would eventually develop at least one major obesity-attributable disease (coronary heart disease, type 2 diabetes, stroke, or cancer) in their lifetime, and 18 percent would have at least two. There would eventually be 7,627,538 (95% range: 7,361,679, 7,893,397) cases of coronary heart disease, 10,233,534 (95% range: 9,942,707, 10,524,362) cases of type 2 diabetes, 3,120,212 (95% range: 2,934,961, 3,305,463) strokes, and 14,432,965 (95% range: 14,137,113, 14,728,817) cases of cancer attributable to being overweight or obese.
An overweight person’s average lifetime medical costs and lost productivity are $62,331 and $93,075, respectively (Exhibit 1). For an obese person, the average amounts are even greater.
EXHIBIT 1. Average lifetime costs averted by reaching “active to a healthy level” per person, by body mass index (BMI) status.
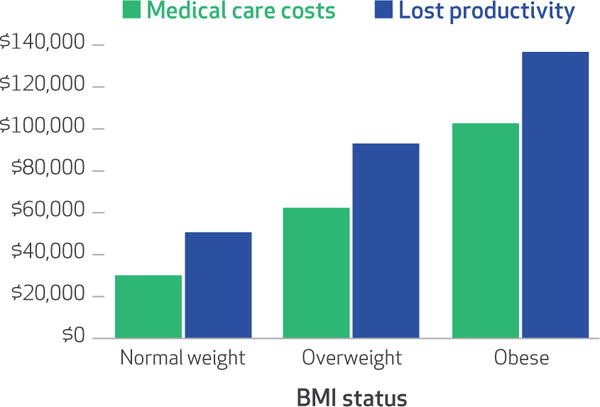
SOURCE Authors’ analysis. NOTES For people ages six and above, being physically active to a healthy level, as defined by the Sports and Fitness Industry Association, is twenty-five minutes of high-calorie-burning physical activity three times a week. Normal weight is having a BMI of 18.0–24.9 kg/m2. Overweight is having a BMI of 25.0–29.9 kg/m2. Obese is having a BMI of 30 kg/m2 or more.
INCREASING THE PROPORTION OF ACTIVE YOUTHS TO 50 PERCENT
Increasing the proportion of youths meeting the CDC’s physical activity guidelines to 50 percent for the remainder of their childhood would avert net present values of $11.4 billion (95% range: 10.5, 12.9) in direct medical costs and $25.1 billion (95% range: 22.3, 27.7) in lost productivity (Exhibit 2), as well as 5.9 million (95% range: 4.6, 7.1) QALYs (data not shown) annually.
EXHIBIT 2. US costs averted annually by increasing levels of children’s participation in physical activity.
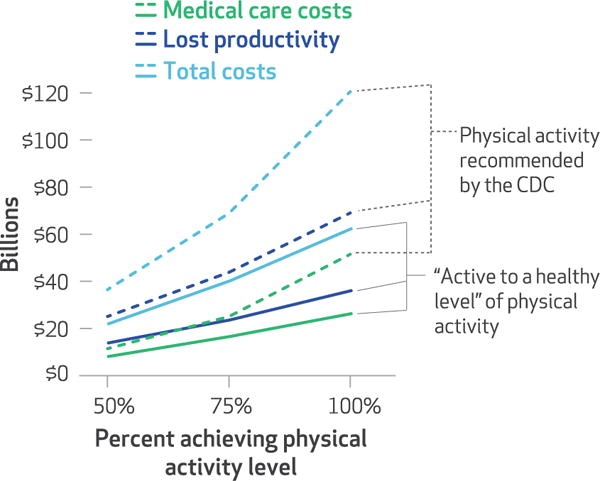
SOURCE Authors’ analysis. NOTES For people ages 6 years and above, being physically active to a healthy level, as defined by the Sports and Fitness Industry Association, is twenty-five minutes of high-calorie-burning physical activity three times a week. For children ages 6–17 years, the Centers for Disease Control and Prevention recommends at least sixty minutes of moderate physical activity each day.
Increasing to 50 percent the proportion of youths who are “active to a healthy level” would decrease the number of obese or overweight youths by 4.18 percent (95% range: 3.78 percent, 4.55 percent) or 340,443 (95% range: 294,688, 386,198) (data not shown). Compared to current levels of physical activity, this would avert net present values of $8.1 billion (95% range: 5.0, 11.2) in direct medical costs and $13.8 billion (95% range: 12.9, 14.7) in lost productivity (Exhibit 2). The resulting decrease in obesity-attributable diseases would be 338,751 (95% range: 332,650, 346,623) fewer strokes (a 10.86 percent reduction), 154,887 (95% range: 141,749, 179,839) fewer cases of coronary heart disease (a 2.03 percent reduction), 36,112 (95% range: 27,495, 46,416) fewer cases of type 2 diabetes (a 0.35 percent reduction), and 31,791 (95% range: 31,541, 31,941) fewer cases of cancer (a 0.22 percent reduction) (data not shown). This in turn would save a total of 5,102,056 (95% range: 3,743,069, 7,104,980) QALYs.
INCREASING THE PROPORTION OF ACTIVE YOUTHS TO 75 PERCENT
Increasing the share of youths meeting the CDC’s physical activity guidelines to 75 percent for the remainder of their childhood would avert net present values of $25.0 billion (95% range: 23.8, 28.4) in direct medical costs and $43.8 billion (95% range: 42.9, 45.7) in lost productivity (Exhibit 2), as well as 23.4 million (95% range: 21.6, 25.3) QALYs (data not shown) annually.
Similarly, increasing the percentage of youths who are “active to a healthy level” to 75 percent (an increase of 43.1 percentage points) would decrease the number of obese or overweight youths by 803,785 (95% range: 690,505, 917,065) or by 9.87 percent (95% range: 8.85, 10.82). This corresponds to net present values of a $16.6 billion (95% range: 15.5, 17.6) decrease in direct medical costs and $23.6 billion (95% range: 18.0, 29.2) in lost productivity. Compared to current levels of physical activity, there would be 376,480 (95% range: 266,244, 474,939) fewer strokes (a 12.07 percent reduction), 272,384 (95% range: 206,624, 309,220) fewer cases of coronary heart disease (a 3.57 percent reduction), 190,400 (95% range: 170,349, 248,103) fewer cases of type 2 diabetes (a 1.86 percent reduction), and 291,897 (95% range: 250,466, 368,524) fewer cases of cancer (a 2.02 percent reduction) (Exhibit 2), saving a total of 18,913,447 (95% range: 16,820,868, 21,149,043) QALYs (data not shown).
INCREASING THE PROPORTION OF ACTIVE YOUTHS TO 100 PERCENT
Compared to current levels of physical activity, having all youths meet the CDC’s physical activity guidelines for the remainder of their childhood would reduce the number of overweight and obese youths by 4,113,570 (95% range: 3,999,751, 4,227,390) or by 50.52 percent (95% range: 49.86, 51.24) and would save $51.5 billion (95% range: 47.5, 54.7) in direct medical costs, $69.0 billion (95% range: 67.8, 71.1) in lost productivity (Exhibit 2), and 37.5 million (95% range: 35.1, 39.8) QALYs (data not shown) each year. The result would be 696,577 (95% range: 686,626, 702,592) fewer strokes (a 22.32 percent reduction), 799,892 (95% range: 750,567, 854,154) fewer cases of coronary heart disease (an 10.49 percent reduction), 647,531 (95% range: 617,439, 690,207) fewer cases of type 2 diabetes (a 6.33 percent reduction), and 771,324 (95% range: 584,336, 877,410) fewer cases of cancer (a 5.34 percent reduction).
Having all youths be “active to a healthy level” would result in 1,212,556 (95% range: 1,014,980, 1,394,962) or 14.89 percent (95% range: 13.00, 16.45) fewer obese or overweight youths. This would save $26.3 billion (95% range: 22.7, 29.8) in direct medical costs, $36.0 billion (95% range: 34.1, 37.9) in lost productivity (Exhibit 2), and 29.0 (95% range: 26.0, 31.3) million QALYs (data not shown). This would also result in 535,872 (95% range: 434,801, 573,853) fewer strokes (a 17.17 percent reduction), 472,952 (95% range: 330,514, 523,365) fewer cases of coronary heart disease (a 6.20 percent reduction), 445,178 (95% range: 364,101, 643,430) fewer cases of type 2 diabetes (a 4.35 percent reduction), and 450,732 (95% range: 423,803, 476,310) fewer cases of cancer (a 3.12 percent reduction).
INCREASING THE INTENSITY OF PHYSICAL ACTIVITY FOR YOUTHS
In addition to testing the effect of varying the rate of youth participation in physical activity, we also varied the intensity of physical activity. Increasing that intensity produced significant changes in both direct costs and lost productivity (Exhibit 3). For example, increasing the intensity of physical activity from “active to a healthy level” to bicycling would avert $9.9 billion in direct medical costs and $24.7 billion in lost productivity. Replacing “active to a healthy level” with running at 10 miles per hour would averted by $17.4 billion in direct medical costs and $49.5 billion in lost productivity.
EXHIBIT 3. Changes in US costs averted annually among adults by varying the intensity of physical activity.
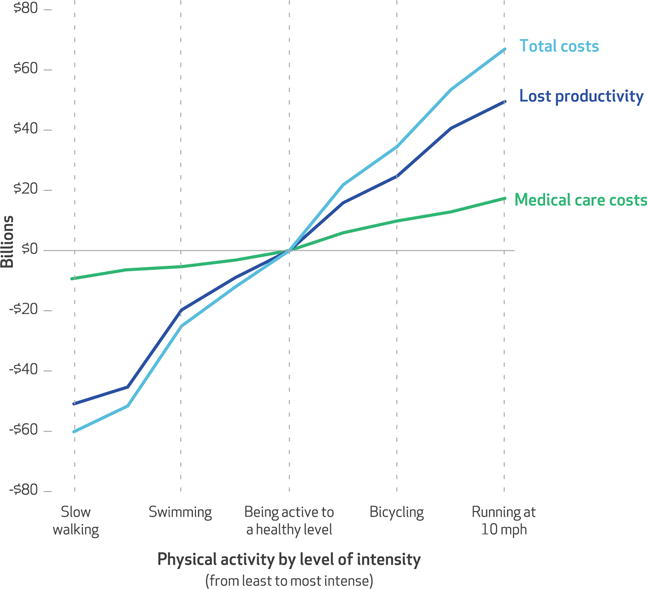
SOURCE Authors’ analysis of data from the following sources: Physical Activity Council. 2016 participation report (see Note 11 in text); and Aspen Institute. State of play 2016 (see Note 1 in text). NOTE For people ages 6 years and above, being physically active to a healthy level, as defined by the Sports and Fitness Industry Association, is twenty-five minutes of high-calorie-burning physical activity three times a week.
Discussion
Our study offers policy makers numbers to use in comparing the benefits of increasing physical activity and those of other competing priorities. Even modest increases in physical activity could yield billions of dollars in savings. Having all of the US youth population meet the CDC’s guidelines for physical activity would result in direct medical cost savings comparable to approximately 1.6 percent of total national health care spending in 2015 and 26.5 percent of all annual health-related work losses.28,29 Despite the potential cost savings, the United States is not making the same level of centralized concerted efforts (such as creating a well-resourced national commission) to increase physical activity as it is making to address other issues of similar economic magnitude (for example, cancer). It is also important to remember that physical activity influences health through other mechanisms besides the effect on weight status. For example, physical activity can improve bone density, strengthen muscles, and enhance mood and self-esteem.30
Moreover, our results showed cost savings that were substantially higher than reported costs for interventions to increase physical activity, which can help support the implementation of various policies and interventions related to physical activity. For example, the per person potential cost savings are over 100 times the published per person costs of physical activity interventions, which can range from $0.0025 (for simple signs that prompt people to use the stairs instead of an elevator or escalator) to $153 (for individually tailored behavior change programs).2 Even if the efficacies of a physical activity intervention were relatively low, increasing the physical activity of some youth could yield returns that outweigh the intervention’s cost.
Our results may underestimate the impact of increasing physical activity among children, since many of our assumptions were conservative. For example, our model specifically looked at the physical activity intervention of improving weight status and metabolic profiles and did not include all possible obesity-related health benefits (for example, those related to arthritis, sleep apnea, and depression).30,31 Nor did we model other potential benefits—including social, behavioral, emotional, and professional benefits— from physical activity.30,32,33
Additionally, our results show how increasing levels of physical activity intensity can provide additional significant cost savings and therefore serve as a guide for determining what specific types of activities to recommend (for example, more vigorous biking or running versus walking).
Another key finding is that just focusing on the short-term impact of increasing physical activity will overlook the majority of the value of physical activity initiatives. Many previous studies that quantified certain effects of physical activity2,3 have focused more on immediate benefits. Decision makers may want to view and evaluate physical activity interventions as they do longer-term investment projects such as major infrastructure changes (for example, investments in highways or transportation), economic stimulus efforts, or defense. Additionally, our finding of the considerable reduction in lost productivity associated with increasing physical activity highlights the need for decision makers not to overlook either the impact of physical activity on future productivity or ways to measure this impact (such as by tracking absenteeism and presenteeism).
Finally, our study identified key drivers of the potential cost savings. For example, as the prevalence of childhood obesity increases, so will the value of increasing physical activity.34,35 Therefore, unless the obesity epidemic is reversed, the value of increasing physical activity will continue to grow. Moreover, decision makers may want to first target areas and populations that have particularly high obesity rates.
Conclusion
Our study quantified the potential weight-related costs and health effects that might be averted by increasing the percentage of youth who meet different recommended levels of physical activity, demonstrated that the possible savings substantially outweigh published costs of physical activity interventions, and identified the key drivers of these savings. These numbers underestimate the impact of increasing physical activity, as physical activity also influences health through important mechanisms that are independent of the effect of physical activity on weight status. Current efforts to increase physical activity may not match the magnitude of the possible savings, which suggests that increasing physical activity should be a higher national priority.
Supplementary Material
Acknowledgments
This work was supported by the Office of Behavioral and Social Sciences Research of the Eunice Kennedy Shriver National Institute of Child Health and Human Development (NICHD) (Grant Nos. U01 HD086861 and R01 HD08601301), the Global Obesity Prevention Center at the Johns Hopkins Bloomberg School of Public Health (Grant No. U54HD070725), and the Agency for Healthcare Research and Quality (Grant No. R01HS023317). The funders had no role in the design and conduct of the study; collection, management, analysis, and interpretation of the data; and preparation, review, or approval of the manuscript.
Contributor Information
Bruce Y. Lee, Global Obesity Prevention Center and an associate professor in the Department of International Health at the Johns Hopkins Bloomberg School of Public Health, in Baltimore, Maryland.
Atif Adam, Global Obesity Prevention Center.
Eli Zenkov, Global Obesity Prevention Center and a public health applications developer at the Pittsburgh Supercomputing Center at Carnegie Mellon University, in Pittsburgh, Pennsylvania.
Daniel Hertenstein, Global Obesity Prevention Center.
Marie C. Ferguson, Global Obesity Prevention Center and a research associate in the Department of International Health, Johns Hopkins Bloomberg School of Public Health.
Peggy I. Wang, Global Obesity Prevention Center.
Michelle S. Wong, Global Obesity Prevention Center.
Patrick Wedlock, Global Obesity Prevention Center.
Sindiso Nyathi, Global Obesity Prevention Center.
Joel Gittelsohn, Global Obesity Prevention Center and a professor in the Department of International Health, Johns Hopkins Bloomberg School of Public Health.
Saeideh Falah-Fini, Department of Industrial and Manufacturing Engineering at the California State Polytechnic University, in Pomona, and a collaborator at the Global Obesity Prevention Center.
Sarah M. Bartsch, Global Obesity Prevention Center and a research associate in the Department of International Health, Johns Hopkins Bloomberg School of Public Health.
Lawrence J. Cheskin, Global Obesity Prevention Center and associate professor in the Department of Health, Behavior, and Society, Johns Hopkins Bloomberg School of Public Health.
Shawn T. Brown, Global Obesity Prevention Center and director of public health applications at the Pittsburgh Supercomputing Center at Carnegie Mellon.
NOTES
- 1.Authors’ calculations based on data from Aspen Institute. The state of play 2016: trends and developments [Internet] Washington (DC): Aspen Institute; 2016. [cited 2017 Apr 4]. Available from: http://www.aspenprojectplay.org/sites/default/files/StateofPlay_2016_FINAL.pdf. [Google Scholar]
- 2.Wu S, Cohen D, Shi Y, Pearson M, Sturm R. Economic analysis of physical activity interventions. Am J Prev Med. 2011;40(2):149–58. doi: 10.1016/j.amepre.2010.10.029. [DOI] [PMC free article] [PubMed] [Google Scholar]
- 3.Carlson SA, Fulton JE, Pratt M, Yang Z, Adams EK. Inadequate physical activity and health care expenditures in the United States. Prog Cardiovasc Dis. 2015;57(4):315–23. doi: 10.1016/j.pcad.2014.08.002. [DOI] [PMC free article] [PubMed] [Google Scholar]
- 4.Dunn AL, Trivedi MH, O’Neal HA. Physical activity dose-response effects on outcomes of depression and anxiety. Med Sci Sports Exerc. 2001;33(6 Suppl):S587–97. doi: 10.1097/00005768-200106001-00027. [DOI] [PubMed] [Google Scholar]
- 5.Haskell WL, Lee I-M, Pate RR, Powell KE, Blair SN, Franklin BA, et al. Physical activity and public health: updated recommendation for adults from the American College of Sports Medicine and the American Heart Association. Circulation. 2007;116(9):1081–93. doi: 10.1161/CIRCULATIONAHA.107.185649. [DOI] [PubMed] [Google Scholar]
- 6.To access the Appendix, click on the Appendix link in the box to the right of the article online.
- 7.National Center for Health Statistics. National Health and Nutrition Examination Survey [Internet] Hyattsville (MD): NCHS; [last updated 2017 Jan 25; cited 2017 Mar 17]. Available from: http://www.cdc.gov/nchs/nhanes. [Google Scholar]
- 8.Kelly TL, Wilson KE, Heymsfield SB. Dual energy x-ray absorptiometry body composition reference values from NHANES. PLoS One. 2009;4(9):e7038. doi: 10.1371/journal.pone.0007038. [DOI] [PMC free article] [PubMed] [Google Scholar]
- 9.Hall KD, Butte NF, Swinburn BA, Chow CC. Dynamics of childhood growth and obesity: development and validation of a quantitative mathematical model. Lancet Diabetes Endocrinol. 2013;1(2):97–105. doi: 10.1016/s2213-8587(13)70051-2. [DOI] [PMC free article] [PubMed] [Google Scholar]
- 10.National Center for Health Statistics. Clinical growth charts [Internet] Hyattsville (MD): NCHS; [last updated 2009 Aug 4; cited 2017 Mar 17]. Available from: https://www.cdc.gov/growthcharts/clinical_charts.htm. [Google Scholar]
- 11.Physical Activity Council. 2016 Participation report: the Physical Activity Council’s annual study tracking sports, fitness, and recreation participation in the US [Internet] The Council; 2016. Place unknown. [cited 2017 Mar 17]. Available from: http://www.physicalactivitycouncil.com/pdfs/current.pdf. [Google Scholar]
- 12.Sharma AM, Kushner RF. A proposed clinical staging system for obesity. Int J Obes (Lond) 2009;33(3):289–95. doi: 10.1038/ijo.2009.2. [DOI] [PubMed] [Google Scholar]
- 13.Guo F, Moellering DR, Garvey WT. The progression of cardiometabolic disease: validation of a new cardio-metabolic disease staging system applicable to obesity. Obesity (Silver Spring) 2014;22(1):110–8. doi: 10.1002/oby.20585. [DOI] [PMC free article] [PubMed] [Google Scholar]
- 14.Friedman GD, Cutter GR, Donahue RP, Hughes GH, Hulley SB, Jacobs DR, Jr, et al. CARDIA: study design, recruitment, and some characteristics of the examined subjects. J Clin Epidemiol. 1988;41(11):1105–16. doi: 10.1016/0895-4356(88)90080-7. [DOI] [PubMed] [Google Scholar]
- 15.The Atherosclerosis Risk in Communities (ARIC) study: design and objectives. The ARIC investigators. Am J Epidemiol. 1989;129(4):687–702. [PubMed] [Google Scholar]
- 16.Savage MP, Petratis MM, Thomson WH, Berg K, Smith JL, Sady SP. Exercise training effects on serum lipids of prepubescent boys and adult men. Med Sci Sports Exerc. 1986;18(2):197–204. [PubMed] [Google Scholar]
- 17.McManus AM, Armstrong N, Williams CA. Effect of training on the aerobic power and anaerobic performance of prepubertal girls. Acta Paediatr. 1997;86(5):456–9. doi: 10.1111/j.1651-2227.1997.tb08912.x. [DOI] [PubMed] [Google Scholar]
- 18.Williams CA, Armstrong N, Powell J. Aerobic responses of prepubertal boys to two modes of training. Br J Sports Med. 2000;34(3):168–73. doi: 10.1136/bjsm.34.3.168. [DOI] [PMC free article] [PubMed] [Google Scholar]
- 19.Welsman JR, Armstrong N, Withers S. Responses of young girls to two modes of aerobic training. Br J Sports Med. 1997;31(2):139–42. doi: 10.1136/bjsm.31.2.139. [DOI] [PMC free article] [PubMed] [Google Scholar]
- 20.Obert P, Mandigouts S, Nottin S, Vinet A, N’Guyen LD, Lecoq AM. Cardiovascular responses to endurance training in children: effect of gender. Eur J Clin Invest. 2003;33(3):199–208. doi: 10.1046/j.1365-2362.2003.01118.x. [DOI] [PubMed] [Google Scholar]
- 21.Gittelsohn J, Mui Y, Adam A, Lin S, Kharmats A, Igusa T, et al. Incorporating systems science principles into the development of obesity prevention interventions: principles, benefits, and challenges. Curr Obes Rep. 2015;4(2):174–81. doi: 10.1007/s13679-015-0147-x. [DOI] [PMC free article] [PubMed] [Google Scholar]
- 22.Lee BY. Digital decision making: computer models and antibiotic prescribing in the twenty-first century. Clin Infect Dis. 2008;46(8):1139–41. doi: 10.1086/529441. [DOI] [PubMed] [Google Scholar]
- 23.Nader PR, Bradley RH, Houts RM, McRitchie SL, O’Brien M. Moderate-to-vigorous physical activity from ages 9 to 15 years. JAMA. 2008;300(3):295–305. doi: 10.1001/jama.300.3.295. [DOI] [PubMed] [Google Scholar]
- 24.Craggs C, Corder K, van Sluijs EM, Griffin SJ. Determinants of change in physical activity in children and adolescents: a systematic review. Am J Prev Med. 2011;40(6):645–58. doi: 10.1016/j.amepre.2011.02.025. [DOI] [PMC free article] [PubMed] [Google Scholar]
- 25.Dailey MJ, Tamashiro KL, Terrillion CE, Moran TH. Nutrient specific feeding and endocrine effects of jejunal infusions. Obesity (Silver Spring) 2010;18(5):904–10. doi: 10.1038/oby.2010.14. [DOI] [PubMed] [Google Scholar]
- 26.Hansen KC, Zhang Z, Gomez T, Adams AK, Schoeller DA. Exercise increases the proportion of fat utilization during short-term consumption of a high-fat diet. Am J Clin Nutr. 2007;85(1):109–16. doi: 10.1093/ajcn/85.1.109. [DOI] [PubMed] [Google Scholar]
- 27.Nelson ME, Rejeski WJ, Blair SN, Duncan PW, Judge JO, King AC, et al. Physical activity and public health in older adults: recommendation from the American College of Sports Medicine and the American Heart Association. Circulation. 2007;116(9):1094–105. doi: 10.1161/CIRCULATIONAHA.107.185650. [DOI] [PubMed] [Google Scholar]
- 28.Davis K, Collins SR, Doty MM, Ho A, Holmgren A. Health and productivity among U.S. workers. Issue Brief (Commonw Fund) 2005;856(856):1–10. [PubMed] [Google Scholar]
- 29.Mattke S, Balakrishnan A, Bergamo G, Newberry SJ. A review of methods to measure health-related productivity loss. Am J Manag Care. 2007;13(4):211–7. [PubMed] [Google Scholar]
- 30.Penedo FJ, Dahn JR. Exercise and well-being: a review of mental and physical health benefits associated with physical activity. Curr Opin Psychiatry. 2005;18(2):189–93. doi: 10.1097/00001504-200503000-00013. [DOI] [PubMed] [Google Scholar]
- 31.Bouchard C, Blair SN, Haskell WL, editors. Physical activity and health. 2nd. Champaign (IL): Human Kinetics; 2012. [Google Scholar]
- 32.Fox KR. The influence of physical activity on mental well-being. Public Health Nutr. 1999;2(3A, 3a):411–8. doi: 10.1017/s1368980099000567. [DOI] [PubMed] [Google Scholar]
- 33.Pedersen MT, Blangsted AK, Andersen LL, Jørgensen MB, Hansen EA, Sjøgaard G. The effect of worksite physical activity intervention on physical capacity, health, and productivity: a 1-year randomized controlled trial. J Occup Environ Med. 2009;51(7):759–70. doi: 10.1097/JOM.0b013e3181a8663a. [DOI] [PubMed] [Google Scholar]
- 34.Duke JC, Mann N, Davis KC, MacMonegle A, Allen J, Porter L. The impact of a state-sponsored mass media campaign on use of telephone quitline and web-based cessation services. Prev Chronic Dis. 2014;11:E225. doi: 10.5888/pcd11.140354. [DOI] [PMC free article] [PubMed] [Google Scholar]
- 35.Dietz WH. Health consequences of obesity in youth: childhood predictors of adult disease. Pediatrics. 1998;101(3 Pt 2, Suppl 2):518–25. [PubMed] [Google Scholar]
Associated Data
This section collects any data citations, data availability statements, or supplementary materials included in this article.