Abstract
Genomic analysis of tumours has led to the identification of hundreds of cancer genes on the basis of the presence of mutations in protein-coding regions. By contrast, much less is known about cancer-causing mutations in non-coding regions. Here we perform deep sequencing in 360 primary breast cancers and develop computational methods to identify significantly mutated promoters. Clear signals are found in the promoters of three genes. FOXA1, a known driver of hormone-receptor positive breast cancer, harbours a mutational hotspot in its promoter leading to overexpression through increased E2F binding. RMRP and NEAT1, two non-coding RNA genes, carry mutations that affect protein binding to their promoters and alter expression levels. Our study shows that promoter regions harbour recurrent mutations in cancer with functional consequences and that the mutations occur at similar frequencies as in coding regions. Power analyses indicate that more such regions remain to be discovered through deep sequencing of adequately sized cohorts of patients.
Genomic studies of protein-coding regions in tumours—including large-scale projects, such as The Cancer Genome Atlas (TCGA) and the International Cancer Genome Consortium (ICGC)—have identified hundreds of potential cancer drivers on the basis of an excess of somatic mutations. By contrast, initial whole-genome sequencing efforts have yielded few examples of genes with oncogenic point mutations in non-coding regions1–5. However, these studies have focused on cohorts with relatively few tumours of any given type and may have lacked adequate power and analytical methodologies to robustly detect a mutational excess beyond that expected by chance6–8. To efficiently study mutations both in coding and in nearby regulatory elements, we designed an assay to capture exons, promoter elements, and additional regulatory regions. We applied it to 360 primary breast tumours and patient-matched normal samples, achieving a median sequencing depth of 80-fold in the targeted regions (Supplementary Table 1). Consistent with previous results, overall somatic mutation rates varied among patients from 0.05 to 16.1 mutations per megabase (median 1.24)8. Coding mutations, copy number alterations, and mutational signatures have been extensively studied in breast cancer5,6,9–14. We performed similar comprehensive analyses of driver genes on our cohort (Extended Data Fig. 1). Here we focus on non-coding mutations in promoter regions, defined as 400 base pairs (bp) upstream to 250 bp downstream of the annotated transcription start sites (TSS).
Discovery of recurrently mutated promoters
Discovery of regions with an excess of mutations requires careful estimation of background (or passenger) mutation frequencies, which can be influenced by multiple genomic factors6 (Methods). For coding regions, our established analytical methods take into account (1) patient-specific coverage information, (2) patient-specific overall mutation rate, (3) genomic covariates of mutation rates, and (4) clustering of mutations8,15. For promoter regions, we used a similar strategy: whereas patient-specific background mutation rates in coding regions are estimated on the basis of silent coding and nearby non-coding mutations, for non-coding regions we use all mutations, because it is unclear which are non-functional. This conservative approach overestimates the background rate. We searched for promoters with either (1) an overall excess of mutations above expectation or (2) unusual clustering of mutations. The latter may detect events in specific transcription factor binding sites, whose signal may otherwise be diluted in the larger promoter region.
Our analysis also accounted for the fact that some breast tumours have particularly high activity of a mutagenic process mediated by apolipoprotein B messenger RNA-editing enzyme catalytic (APOBEC) cytidine deaminases9,16,17. These mutations share a characteristic sequence context (TCW, where W is A/T) and often occur in dense clusters in the genome (kataegis)9,13,16. Because it is not possible to model this background mutational process perfectly, we took a conservative approach by using our SignatureAnalyzer tool18 to (1) identify patients whose overall mutation spectrum suggested high APOBEC activity, and (2) assign to each mutation a probability of having arisen from the APOBEC process, on the basis of the overall APOBEC activity in the patient. We removed mutations with APOBEC probability >80% from our initial analysis.
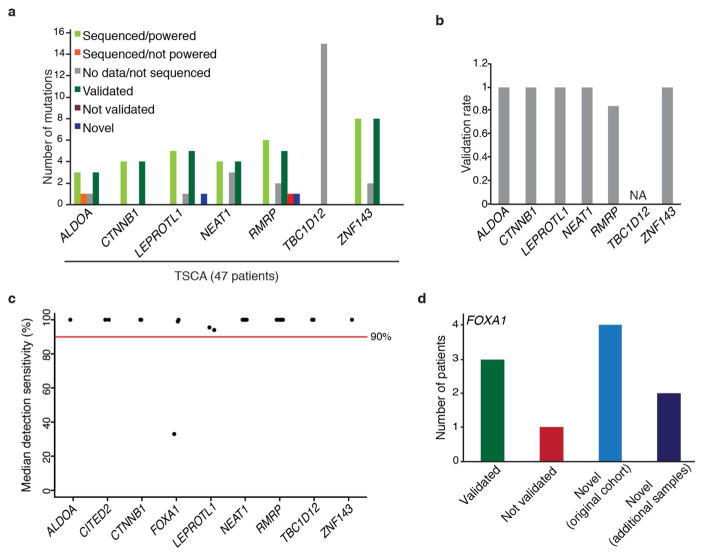
Our analysis yielded nine promoter elements with significant burden or clustering of mutations. These were associated with FOXA1 (an established breast cancer oncogene), TBC1D12, RMRP/CCDC107 (bidirectional promoter), NEAT1, LEPROTL1, ALDOA, ZNF143, CITED2, and CTNNB1 (false discovery rate (FDR) <0.1; Fig. 1a, Supplementary Table 2 and Methods). Because promoter elements often contain GC-rich sequences that can be subject to lower sequence coverage and higher misalignment rates, we carefully considered the specificity and sensitivity of mutation-calling results for these significant genes. We confirmed 97% of the mutations in these promoters by deeply re-sequencing their regions in 47 of the 360 tumours (Extended Data Fig. 2a, b). Considering the depth of coverage at each mutated base and accounting for the typical allele fraction of clonal mutations (0.15 in this study)7,19, we found that the expected detection sensitivity for point mutations was close to 100% for mutated sites within the significant promoters, except for a recurrent single-base hotspot (chromosome 14: 38064406) in the FOXA1 promoter, which had very low coverage and expected detection sensitivity of only 33% (Fig. 1b and Extended Data Fig. 2c). By re-sequencing this FOXA1 region at greater depth in 256 patients from the original cohort, we identified four additional patients with the FOXA1 hotspot mutation (Extended Data Fig. 2d and Methods). Because FOXA1 is an important oncogene in breast cancer, we performed targeted sequencing of the hotspot mutation in 64 additional patients, revealing two additional events. Finally, we noticed that several of the mutations in the significant promoters were located at sites with the classic APOBEC motif. We thus examined whether events at these exact sites had been excluded from our initial analysis in tumours with high APOBEC activity. We found six such mutations in ZNF143, four in TBC1D12, two in ALDOA and LEPROTL1, and one each in FOXA1, RMRP, and CTNNB1.
Figure 1. Identification of significantly mutated promoters.
a, Quantile–quantile plot for gene promoter P values. Red dots indicate significantly mutated promoters (Benjamini–Hochberg FDR q <0.1). b, Detailed view of analysed gene loci for significantly mutated promoters including stacked lollipops representing mutations from this study (red), 98 TCGA whole-genome sequencing (WGS) (green), and 560 breast cancer genomes from BRCA560 (ref. 5, purple). Base changes at mutation sites are indicated above mutation count. Grey profiles indicate read coverage from a representative patient. Blue lines depict mutation detection sensitivity at base-level resolution in each promoter region.
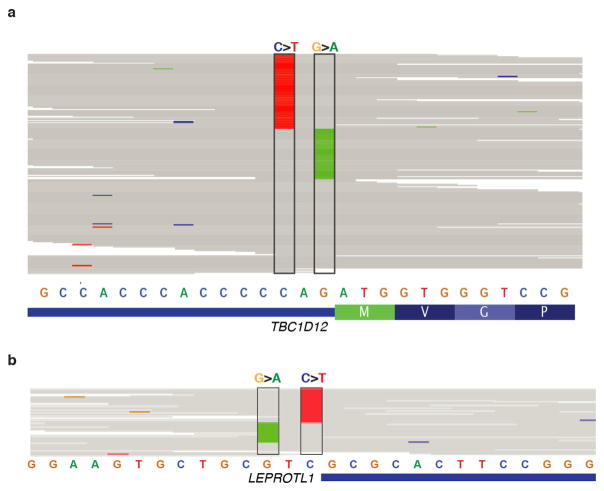
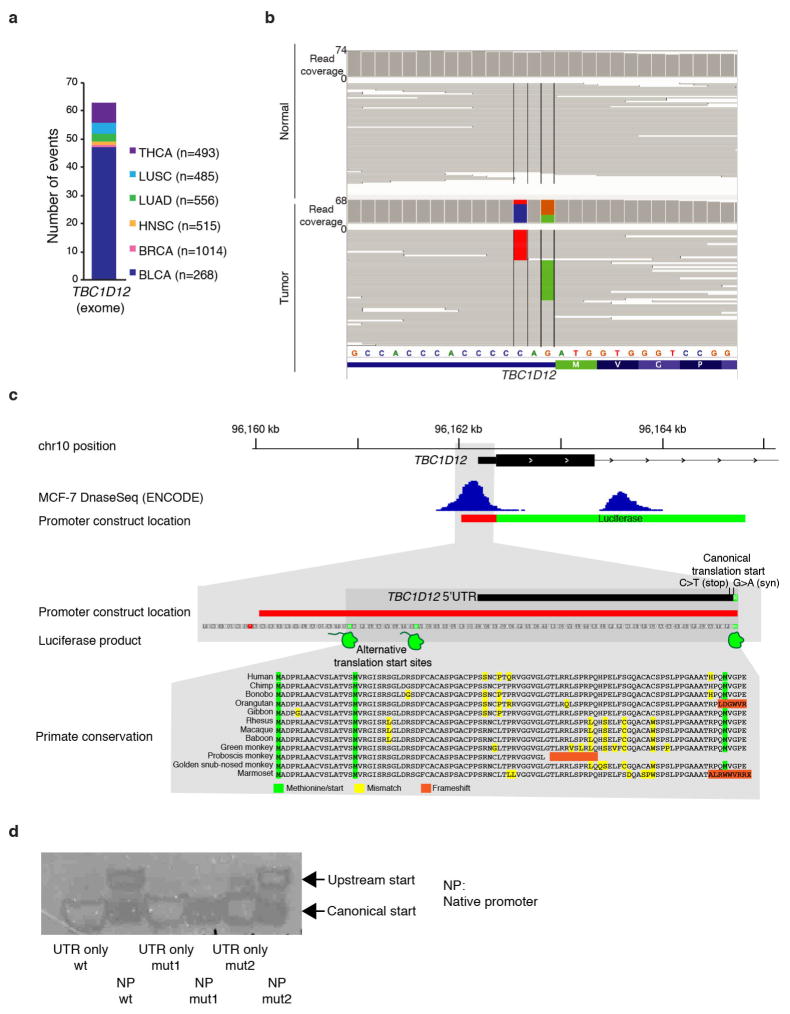
Including all the mutations above, TBC1D12 was altered in 3.9% of patients, ZNF143 in 3.6%, FOXA1 in 2.9%, RMRP/CCDC107 in 2.5%, ALDOA and LEPROTL1 in 1.7% each, NEAT1 and CTNNB1 in 1.4% each, and CITED2 in 0.8% (Fig. 1b). Notably, six of these promoters (TBC1D12, LEPROTL1, ZNF143, RMRP, ALDOA, and FOXA1) contained single-site mutational hotspots (at least three mutations at a single site). Nine of the 11 promoter mutations in FOXA1 were concentrated at a hotspot at position −81 relative to the annotated TSS and in all cases created a G>A transition. The hotspots in ZNF143, ALDOA, LEPROTL1, and TBC1D12 were located in or adjacent to the 5′ untranslated region (UTR). In the last two cases, hotspots occurred in clustered pairs separated by a single nucleotide: at positions −1 and −3 relative to the TSS of LEPROTL1 and at positions −1 and −3 relative to the translation start of TBC1D12 (Fig. 1b). For both genes, some patients had mutations at both positions, one on each of the two homologous chromosomes, consistent with a two-hit model characteristic of a tumour suppressor (Extended Data Fig. 3a, b). Identical hotspot patterns and co-occurrence of both mutations was also seen in TBC1D12 in breast and bladder cancers from TCGA (discussed in a Supplementary Note and Extended Data Fig. 4). Single-site hotspots were not seen in the promoters of NEAT1, CITED2, and CTNNB1, but their mutations were tightly clustered upstream of the TSS, including at directly adjacent bases (Fig. 1b). In addition, the TERT promoter was mutated in three patients at the two well-described hotspot positions20,21, although this observation was not significant (q = 0.32; Supplementary Table 2).
We next sought to validate our findings by examining mutation calls from previously published breast cancer whole genomes (98 patients from TCGA and 560 from ref. 5, referred to as BRCA560) and targeted sequencing of 46 breast cancer cells lines. In total, in the validation cohorts, we found 9 promoter mutations in TCGA and 35 mutations in BRCA560, of which 17 (TCGA: 4; BRCA560: 13) occurred in the exact hotspots identified in our analysis (Fig. 1b). At the ALDOA, CTNNB1, ZNF143 and NEAT1 promoters, a total of seven mutations were discovered in breast cancer cell lines (Supplementary Table 3). At the FOXA1 promoter, we detected hotspot mutations in seven patients from BRCA560 and one sample from TCGA. Similar to our discovery cohort, this region had low coverage in whole genomes with correspondingly low detection sensitivity, suggesting that the actual number of FOXA1 promoter mutations in the validation cohorts may be higher than observed.
Breast cancers are often partitioned into subtypes on the basis of receptor and gene expression profiles. To assess whether promoter mutations were linked to these subtypes, we combined our discovery and validation cohorts owing to the relatively small number of promoter mutations. FOXA1 (odds ratio 5.06; q <0.25) and ZNF143 (odds ratio 7.4; q < 0.25) mutations occurred predominantly in oestrogen receptor (ER)-positive breast cancers, and ZNF143 (odds ratio 15.4; q < 0.15), ALDOA (odds ratio 15.4; q < 0.15), LEPROTL1 (all mutations occurred in the associated subtype; q < 0.15) and TBC1D12 (odds ratio 4.9; q < 0.25) were associated with the Luminal B expression subtype.
Mutations affect expression and affinity
To test whether mutations in the significant promoters have functional consequences, we performed two types of experiment: (1) luciferase reporter assays in HEK293T cells to assess their effect on gene expression; and (2) electrophoretic mobility shift assays (EMSAs) to analyse changes in protein binding between the WT and mutant promoters.
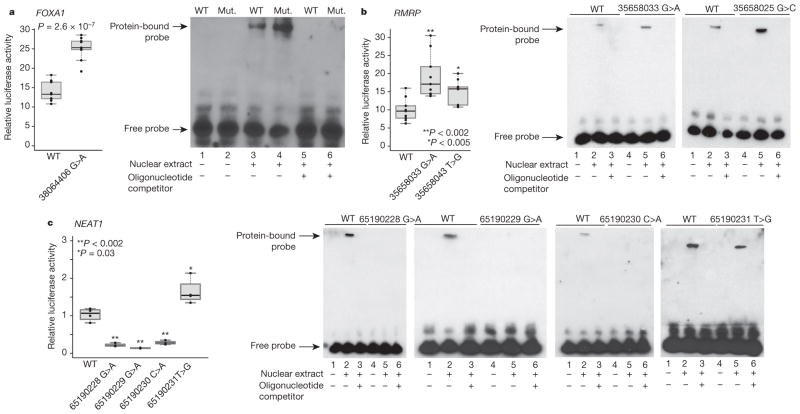
For FOXA1 and RMRP, the mutant probes caused increased expression in the reporter assays and increased protein binding in EMSAs, relative to the WT sequences (Fig. 2a, b and Extended Data Fig. 5a), suggesting enhanced recruitment of transcriptional activators. This gain-of-function pattern is consistent with prior knowledge about these genes: FOXA1 is a known breast cancer oncogene that is recurrently focally amplified and RMRP is significantly amplified in epithelial tumours (Supplementary Table 4). RMRP is a non-coding RNA involved in ribosomal RNA processing and has recently been reported to have a role in transcriptional regulation22, although its function in breast cancer is unclear.
Figure 2. Functional characterization of promoter mutations.
Luciferase reporter assays show functional impact of mutations on gene expression. Individual data points (black) overlap summary statistic boxplots (grey) with the median indicated by black horizontal bar. P values calculated with two-sided Student’s t-test. EMSA with WT and mutant (Mut.) promoter oligonucleotides. Reporter assay and EMSA for FOXA1 (a) and RMRP (b) promoter mutations show increase in reporter expression and increased protein binding in mutant versus WT sequences. c, Reporter assay and EMSA for NEAT1 promoter mutations depict decrease in expression and loss of protein binding for three (of four) mutations.
Conversely, three of the four mutations in the NEAT1 promoter reproducibly decreased luciferase activity compared with WT sequence and caused complete loss of binding in EMSA, one slightly increased activity (Fig. 2c). Consistent with this loss-of-function phenotype, NEAT1 is focally deleted in ~8% of breast cancers (Supplementary Table 4) and its exonic region is recurrently mutated5. This non-coding RNA is critical for mammary development23, but little is known about its function in breast tumorigenesis.
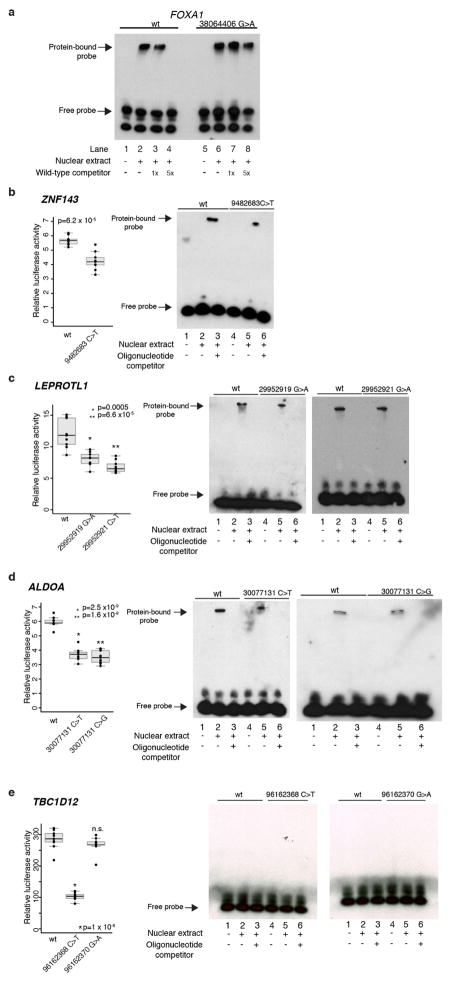
The mutant sequences for TBC1D12, ZNF143, ALDOA and LEPROTL1 also significantly and reproducibly decreased luciferase activity in the reporter assay, but showed less pronounced results in EMSA (Extended Data Fig. 5b–e). Possible roles of the statistically highly significant TBC1D12 hotspot mutations are discussed in a Supplementary Note.
FOXA1 promoter mutations act through E2F
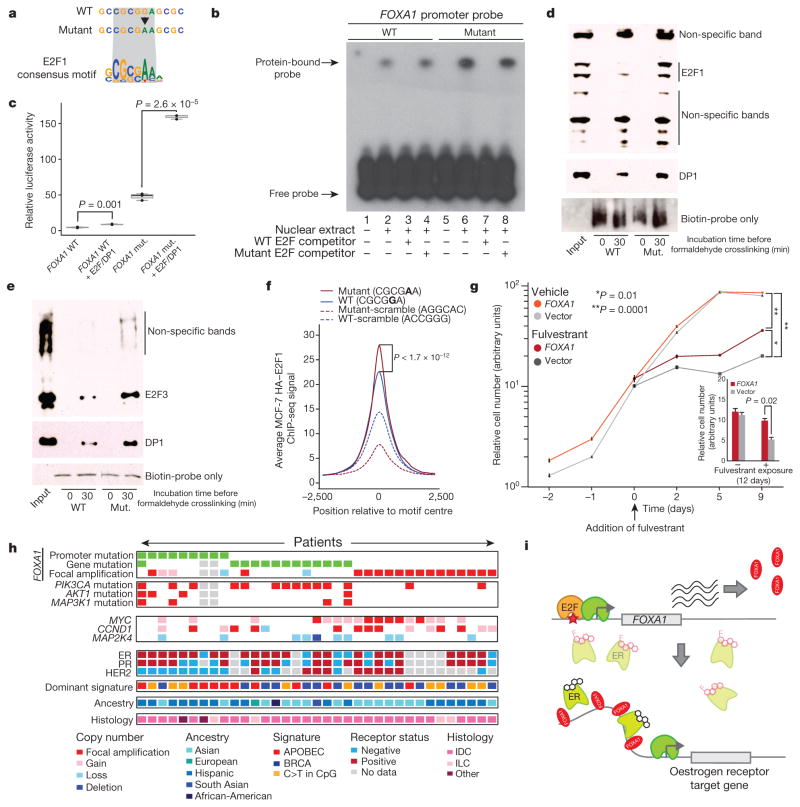
Given the established role of FOXA1 in breast cancer, we sought to investigate the precise function of its promoter mutations. Motif analysis suggested that the mutation may create a stronger binding site for E2F family transcription factors (Fig. 3a and Supplementary Table 6). To test whether the hotspot mutation indeed enhances E2F binding, we performed four experiments. First, we repeated the EMSA in the presence of a competing DNA fragment with strong affinity for E2F and a control non-binding probe. The E2F-binding probe, but not the control, effectively abolished protein binding to both the normal and mutant probes, suggesting that binding to the FOXA1 promoter sequence involves E2F proteins (Fig. 3b). Second, we repeated the FOXA1 reporter assay with ectopic co-expression of E2F3 and its co-factor DP1. Co-expression of E2F3/DP1 increased reporter activity for both WT and mutant FOXA1 promoter sequences, with significantly stronger change in the mutant (Fig. 3c and Extended Data Fig. 6a, b). Third, in a pull-down experiment, the mutated FOXA1 probe showed increased E2F1 (Fig. 3d) or E2F3 (Fig. 3e) and DP1 protein binding compared with WT. Fourth, using E2F1 chromatin immunoprecipitation followed by sequencing (ChIP-seq) data from MCF-7 breast cancer cells, we show higher affinity for genomic regions that include a 6 bp motif containing the hotspot mutant compared with the WT promoter motif (Student’s t-test, P < 1.7×10⁻¹²; Fig. 3f and Extended Data Fig. 7). Taken together, these results provide strong evidence that the expression changes caused by the FOXA1 promoter mutation are mediated, at least partly, by E2F binding.
Figure 3. FOXA1 mutations act through E2F and increase tolerance to anti-oestrogen receptor treatment.
a, FOXA1 promoter around the hotspot mutation matches consensus motif for E2F1. b, Excess unlabelled E2F-binding, but not non-binding, oligonucleotides abolish the gel shift observed with both WT and mutant FOXA1 probes. c, Reporter assay for FOXA1 WT and mutant (mut.) promoter constructs in HEK293T cells co-transfected with E2F3/DP1. Individual data points (black) overlap boxplots (grey) with the median indicated by black horizontal bar. P value calculated with one-sided Student’s t-test. d, e, Pull-down of nuclear protein extract with biotin-labelled FOXA1 WT and mutant (Mut.) promoter probes followed by immunoblot with E2F1 (d) or E2F3 (e) and DP1 antibody. Input lane contains nuclear protein extract without addition of promoter probes. f, IGR analysis for 6-bp sequences from the FOXA1 promoter and controls. g, MCF-7 breast cancer cells transfected with either empty vector or FOXA1-expression construct were exposed to vehicle or fulvestrant starting on the third day of cell culture (defined as treatment day 0). Inset shows significant difference in cell number after 12 days of exposure compared with control. Error bars, s.e.m. h, Summary of FOXA1 promoter mutations, copy number gains, and coding mutations observed in our patient cohort, and status of different genomic and patient characteristics (only FOXA1-altered cases are shown). Grey cells, missing data. i, Proposed model for mechanism of action of the FOXA1 hotspot promoter mutation. Black molecular structure, oestrogen; pink molecular structure, fulvestrant. Pale oestrogen receptor complexes represent fulvestrant-mediated oestrogen receptor degradation.
FOXA1 is a transcriptional pioneer factor that opens chromatin allowing ER access to its genomic targets24–26. High FOXA1 levels have been observed in poor-outcome tumours and breast cancer metastases, where it reprograms the ER binding landscape26. We hypothesized that increased abundance of FOXA1 protein increases ER activity. To test this, we generated MCF-7 cells stably overexpressing FOXA1 and treated them with the ER-antagonist fulvestrant, a compound used to treat hormone-receptor positive breast cancer (Fig. 3g and Extended Data Fig. 8). Indeed, FOXA1-overexpressing cells grew at a significantly faster rate under fulvestrant treatment compared with controls, suggesting that increased FOXA1 levels promote cellular tolerance to anti-ER treatment in breast cancer.
Finally, we investigated the context in which various types of FOXA1 mutation occurred. Overall, 35 (9.7%) of the patients in our study carried FOXA1 somatic events—including 9 with promoter hotspot mutations, 13 with gene (coding, 5′ UTR and 3′ UTR) mutations and 14 with amplifications (Fig. 3h). These frequencies of mutations and focal amplifications are consistent with previous studies10,11. Promoter mutations were negatively associated with the BRCA-related mutational signature16 (Fisher’s exact test, P = 0.05) and positively associated with HER2-negative tumours (P =0.002), AKT1 mutations (P = 0.04), and enriched among patients of Hispanic ancestry (P = 0.06). By contrast, focal amplifications were negatively associated with the APOBEC signature (P = 0.05), with a trend towards HER2-positivity (P = 0.07) and occurred in tumours without PIK3CA mutations (P =0.04). FOXA1 coding mutations were associated with the presence of PIK3CA missense mutations (P = 0.001), an association that was not seen for either promoter mutations or focal amplifications. These associations suggest that different types of FOXA1 alteration are not completely equivalent and require further investigation.
In summary, our results point towards a model where increased expression of FOXA1 (for example, through promoter mutation) promotes accessibility of ER binding sites, allowing cancer cells to grow under lower oestrogen conditions (Fig. 3i).
Power to discover promoter mutations
Finding candidate driver elements requires both sufficiently deep sequencing coverage to reliably detect mutations and sufficiently large cohorts to achieve statistical significance. The high GC-content of many promoters, which often results in low sequencing coverage, poses a special challenge for studies of these regions. Whereas the detection sensitivity for our significant promoters was high (except for FOXA1), for the median promoter, it was only 44% overall (owing to both target design and coverage); we have thus probably detected only about half of all mutations in promoter regions.
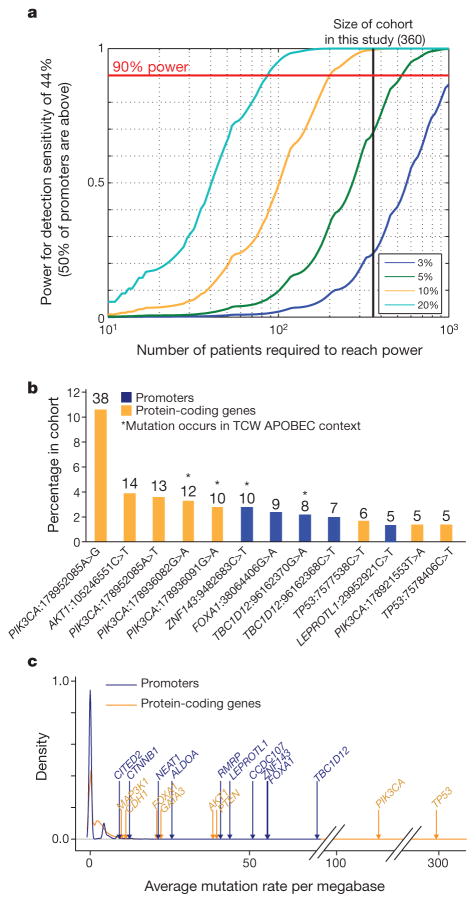
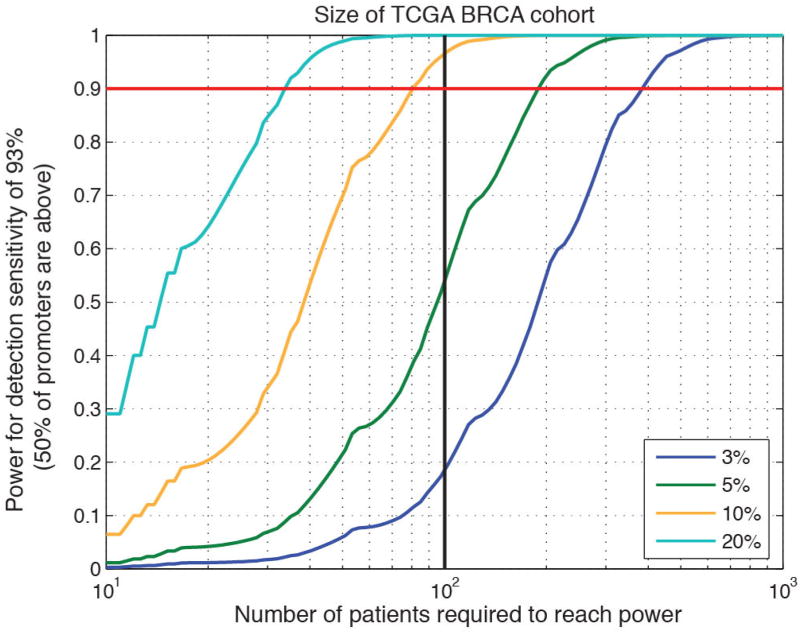
Notably, previous studies of cancer whole genomes from multiple cancer types, including breast cancer1–5, did not find strong evidence for many of the significant promoters reported here and, in particular, for FOXA1. This is probably for two reasons: low sensitivity in GC-rich promoter regions and small cohort sizes. The problem is illustrated by the TCGA breast cancer cohort that includes ~100 patients sequenced at 50× standard tumour coverage. This data set had high overall median detection sensitivity across promoters (93%), but only 1% sensitivity at the FOXA1 hotspot mutation site owing to nearly complete lack of coverage. In addition, the relatively small sample size provided limited power (54%) to detect promoters mutated in 5% of samples, compared with this study (69%) (Fig. 4a and Extended Data Fig. 9).
Figure 4. Power analysis of ExomePlus patient cohort.
a, Discovery power in promoter regions. This study is well-powered (>90%) to discover promoters mutated in 10% and 20% but not 5% of patients. b, Percentage of mutational hotspots in coding genes and promoters in our cohort. The total number of hotspot mutations is indicated above the bars (only sites with at least five mutations are shown). c, Distribution of patient-average functional mutation rates for coding genes and promoters.
Interestingly, although the proportion of patients carrying mutations in the significant promoters was lower than for coding genes, the mutation frequencies were similar when correcting for target size. For example, the most significant promoter in our data, TBC1D12, was mutated in ~4% of patients, which was considerably lower than the most frequently altered coding genes (TP53 in 33% and PIK3CA in 27%). Nevertheless, the promoter hotspots were among the most frequent single-site recurrent events across all sequenced territory, including both coding and non-coding (Fig. 4b). In principle, lower frequency may reflect a smaller target size, weaker selective advantage, or both. To assess the effect of target size, we compared the mutation rate of events that could potentially lead to functional alterations, μf, in the coding regions of known cancer drivers and our significant promoters. Aside from the expected outliers TP53 and PIK3CA, values of μf for the promoters were similar to or exceeded those of several well-known coding drivers (Fig. 4c), supporting the view that the low observed frequency of promoter mutations may be due, at least in part, to their smaller functional genomic footprint.
Discussion
We performed a comprehensive analysis of promoters in a large cohort of 360 patients with primary breast cancer and discovered significantly mutated promoters for nine genes. Like TERT, all nine genes show recurrent mutations at a specific base or at nearby bases—suggesting that they target-specific elements within the promoter (for example, transcription factor binding sites). In three cases (FOXA1, RMRP, and NEAT1), we also found compelling experimental evidence that the promoter-proximal mutations lead to significant consequences for transcription.
Using several functional experiments, we demonstrate that the FOXA1 promoter mutation has a substantial effect on gene expression. Through its role as a pioneer factor for oestrogen receptor, higher levels of FOXA1 protein may increase cellular sensitivity to oestrogen. While FOXA1 expression has been linked with positive clinical outcome27–29, high levels of FOXA1 have recently been associated with poor outcome, metastasis, decreased response to fulvestrant, and endocrine resistance26,30,31. Identification of FOXA1 alterations in patients undergoing hormone therapy may thus be important for recognizing mechanisms for resistance to therapy and tumour progression.
Appropriate clinical treatment will ultimately depend on the ability to recognize all functionally important mutations in each patient— including in regulatory elements, such as promoters. Identifying the targets of regulatory events will require systematic analysis of large cohorts of patients across cancer types, followed by experimental validation. Promoter mutations may help explain activation or inactivation of known cancer genes in patients lacking coding mutations and may lead to discovery of new cancer genes. Completing our understanding of all alterations—coding and non-coding—in cancer genes will be an important foundation for cancer precision medicine.
METHODS
No statistical methods were used to predetermine sample size. The experiments were not randomized. The investigators were not blinded to allocation during experiments and outcome assessment.
Patient collections
Mexican samples were collected at the Instituto de Enfermedades de la Mama, FUCAM A.C., Mexico City, after informed consent. The fresh frozen tumours were collected during tumour resection surgery. After macroscopic evaluation by a pathologist, tumour tissues were sectioned in half. One half was fixed using buffered formalin and embedded in paraffin (FFPE). The other half was frozen in liquid nitrogen. The paraffin-embedded sections were analysed by two independent pathologists and regions with tumour cells were punched using a 2 mm-gauge needle to obtain cores of the FFPE tissue blocks with a tissue microarrayer. Frozen tissues were stored at −80 °C until further processing. Additional FFPE tumours were collected at the Anatomic Pathology Department of the Instituto de Enfermedades de la Mama. All samples were collected before treatment. Oestrogen and progesterone receptors, as well as HER2 protein expression, were evaluated by immunohistochemistry using the oestrogen receptor/progesterone receptor pharmDx and HercepTest, respectively (Dako, Denmark). DNA extraction was performed using an All Prep Qiagen kit following the manufacturer’s protocol. DNA was quantified by spectrophotometry (nanodrop system) and the integrity of the DNA was evaluated in 2% agarose gels. All procedures and protocols were reviewed and approved by the Research and Ethics Committees of the Instituto Nacional de Medicina Genómica and the Instituto de Enfermedades de la Mama, FUCAM, A.C.
Spanish samples were collected at the Vall d’Hebron University Hospital (Barcelona) after informed consent. After macroscopic evaluation by a pathologist, tumour tissues were sectioned in half. One half was FFPE and submitted for routine histopathological evaluation. The other half was frozen in liquid nitrogen and stored at −80 °C until further processing. Oestrogen and progesterone receptors, as well as HER2 protein expression, were evaluated by immunohistochemistry in the diagnostic FFPE sample using pharmDx (Dako, Denmark) and the anti-c-erbB-2 clone CB11 (Novocastra, UK), respectively.
Additional samples were acquired from commercial tumour banks ISLBio and Bioserve. This study was approved by the Broad Institute Institutional Review Board. Characteristics of patients are listed in Supplementary Table 1.
ExomePlus library construction and sequencing
Whole-exome capture was performed using Agilent SureSelect ExomePlus bait. This expanded human content was manufactured by Agilent (Agilent Technologies, USA), with ~155Mb baited target and the Broad Institute in-solution hybrid selection process32,33. ExomePlus includes the standard exome targets with the following additions: intronic and promoter sequences for known cancer genes, significant targets identified in cancer genome-wide association studies, TCGA, and the Cancer Cell Line Encyclopedia. Also included are novel exons identified in the 29 mammals comparative study, regulatory motifs from Ensembl, as well as lincRNA sequence and additional sequence in known areas of copy number alterations34: UTRs (130,452 targets/37 Mbp), SNP array probe sites (99,877 targets/0.1 Mbp), Ensembl regulatory regions (74,943/48 Mbp), lincRNAs (22,720/8.7 Mbp), regulatory motifs (21,513/0.33 Mbp), other (82,937/61 Mbp).
In summary, genomic DNA was sheared, end repaired, ligated with barcoded Illumina sequencing adapters, amplified, size selected, and subjected to in-solution hybrid capture using the ExomePlus bait set32,33. Resulting Illumina sequencing libraries were then qPCR quantified, pooled, and sequenced with 76 base-paired-end reads using Illumina GAII or HiSeq 2000 sequencers (Illumina, USA). Alignment was performed with the Burrows–Wheeler Alignment tool35 to the human genome hg19/GRCh37 assembly. Of the targeted 155 Mb on the array, a median of 139 Mb (range 126–147 Mb) of sequence were covered at sufficient depth for mutation calling in the 360 patients. Mean target coverage across all tumour samples was 80.8-fold (range 48–164), across all normal samples 81.5-fold (range 46–165). Mean target coverage exceeded 80% of the targeted territory for most coding and non-coding categories, with the exception of promoters, which are typically underrepresented in PCR-based next-generation sequencing libraries (37%) owing to their high GC-content. Distribution of mutations with respect to array design, coverage, and fraction of variant alleles were as expected, suggesting that mutation calling and filtering steps did not introduce biases in non-coding regions.
Quality control and mutation calling
Sequencing data were processed using the standard Broad pipeline. Cross-contamination of sequencing data with DNA from a different individual was evaluated with ContEst36, and only samples with contamination less than or equal to 4% were kept for analysis. Somatic mutations were identified between tumour-normal pairs with MuTect as previously described7, with a standard panel of normal samples extended with information from the ExomePlus cohort. Local realignment, an oxidation artefact filter37, FFPE artefact filter (C.S. et al., manuscript in preparation), and a panel of normal samples filter were applied to the variant set to remove alignment and technical artefacts and germline contamination. Short insertions and deletions (indels) for coding regions were identified with Indelocator. Genomic annotation for coding and non-coding regions was performed with Oncotator38. In total, nearly 100,000 annotated single-nucleotide substitutions (median 175 per patient; range 7–2,335) were included in the analysis. Mutations in TCGA whole-genome sequencing were called with MuTect and filtered with oxidation and panel of normal samples filters to remove artefacts.
Copy number estimation
Copy number estimates from ExomePlus sequencing data were generated using the GATK CNV pipeline (https://github.com/broadinstitute/gatk-protected/blob/1.0.0.0-alpha1.2.2/docs/CNVs/CNV-methods.pdf). Copy number estimates were taken from GISTIC2 thresholded output39.
Recovery of mutations lost to tumour-in-normal contamination
We observed contamination with copy number events and somatic variants in many of the normal adjacent tissue controls in the data set. This contamination with tumour DNA in the matched normal tissue led to an underestimation of somatic variants as they were observed in the control. We used our novel deTiN pipeline to score tumour-in-normal (TiN) contamination for each patient (Supplementary Table 1) on the basis of copy number variations and mutation calls40. For samples with <30% TiN, this pipeline recovered a combined total of ~1,000 mutations. Samples with ≥ 30% TiN estimate were removed from the analysis set. After ContEst and TiN filtering, 360 patients remained for analysis in our cohort.
Ancestry inference
Sample ancestries were inferred on the basis of principal component analysis of the normal (germline) samples using a subset of 5,824 common variants chosen to be autosomal, polymorphic across multiple ancestry populations, present in the targeted coding regions of most exome capture platforms, in approximate linkage equilibrium, and in Hardy–Weinberg equilibrium41. Using EIGENSTRAT42, we calculated six principal component vectors for the 360 study samples and a set of 1,489 training samples from the 1000 Genomes Project (http://www.1000genomes.org/data) and Exome Sequencing Project (http://evs.gs.washington.edu/EVS/) with known (self-reported) ancestry annotations. Given the principal component coefficients of the training samples with known ancestry, we calculated the coordinates of the centres of each ancestral group cluster in principal component coefficient space. Then each sample with unknown ancestry was assigned an ancestry on the basis of the shortest Euclidean distance to one of the ancestral centres. We inferred the ancestry of study samples on the basis of the first three principal components, which we found to be the minimal set of components that demarcated ancestral group boundaries in the 1000 Genomes and Exome Sequencing Project training set.
Description of non-coding significance analysis
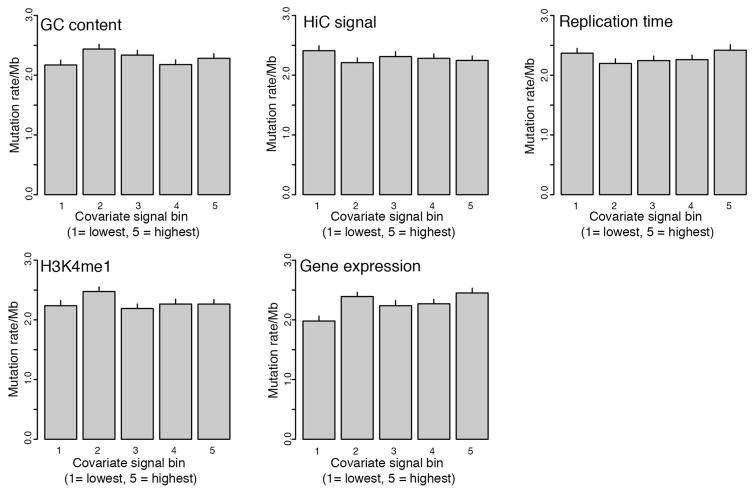
Non-coding significance analysis (MutSigNC) is based on the concepts implemented in our MutSig suite of tools for coding genes6,8,15, and takes into account patient-specific mutation rates, patient-specific sequencing coverage, as well as information about regional mutation clustering. Several algorithms for cancer driver gene detection based on these factors have been published1–6,43–46. Explicit covariate integration was not performed since we failed to observe strong correlations between mutation rate in promoters and replication time, gene expression and GC-content (Extended Data Fig. 10). Instead, we calculated the background mutation rate only from promoter regions (rather than all mutations in a given patient). Focusing only on the promoter regions takes into account potential factors that may affect promoter regions (for example, chromatin state, GC-content, etc.). We used patient- and region-specific coverage information to account for variable coverage in GC-rich regions. To account for the effect of APOBEC mutations, we excluded mutations with ≥0.8 probability of originating from any of the APOBEC mutation signatures.
For each genomic element (for example, promoter), MutSigNC calculates the probability that the region will be mutated in at least k patients by chance (on the basis of our null background model). For each patient p, the total mutation count across all analysed elements, np, and total bases sufficiently covered for mutation calling7 across these elements, Np, are used to estimate the patient-specific back-ground mutation rate.
MutSigNC then calculates the probability of seeing at least one mutation in patient p in the genomic element r using
where H is the cumulative beta-binomial probability8. We use convolution of these patient-specific distributions to calculate the distribution of observing exactly x patients with at least one mutation in element r, Pr (n = x). Finally, the P value is calculated as
For displaying the quantile–quantile (Q–Q) plot, we used a mid-p approach to handle the discrete nature of the P values47,48.
A search for clustered mutations was performed similar to the CLUMPS algorithm for three-dimensional clustering of protein-coding mutations49. For each genomic element, we evaluated whether mutations occurring in it were clustered together more than expected by chance. Here we tested for significant clustering only genomic elements with at least three mutations.
We made several modifications to the weighted average proximity (WAP) score initially described in CLUMPS: (1) the difference between genomic coordinates of two mutations was used as the distance metric d; and (2) all mutations at hotspot sites were weighted equally in the score calculation. We chose t = 6 since it reflected the typical size of the core of transcription factor binding motifs. Each genomic element was assigned a WAP score on the basis of the mutations in it according to
We evaluated statistical significance of an element’s WAP score with a permutation-based approach using a multinomial distribution of the normalized base-wise coverage in the tested element to accommodate uneven coverage in promoter regions. An average coverage profile across all patients was generated for this purpose from base-wise coverage output by MuTect7. In addition (and in contrast to CLUMPS), in each iteration, we placed mutations independently according to the multinomial distribution. Significance was then calculated as the number of WAP scores obtained through permutations greater than or equal to the observed score. We stopped the permutations as soon as the uncertainty of the P value estimate dropped below a predefined threshold or we reached 106 permutations50.
To evaluate the robustness of our results, we repeated the analysis with t =4 and t =8. Only CTNNB1 and CITED2 did not reach significance with t =4, suggesting that these genes are not robust to such parameter changes. We thus focused on the robust genes for experimental follow-up and further analysis.
MutSigNC evaluates significance through combining the burden and clustering P values. For regions with at least three mutations, we combined these independent P values with Fisher’s method. For regions with fewer than three mutations, only the burden test P value was used. Regions with fewer than ten bases sufficiently covered were removed from the analysis. We corrected for multiple-hypothesis testing by using the Benjamini–Hochberg FDR procedure51 and identified significantly mutated elements as those with q <0.1.
Promoters were defined as regions extending 400 bp upstream to 250 bp downstream from an annotated TSS from the RefGene database downloaded on 10 June 2013. Downstream sequence was included because mutations near the TSSs may have impacted gene expression through creation or disruption of recognition motifs for transcriptional regulators, even if they were located downstream of the TSS. We chose the interval size such that at least 80% of the average DNase hypersensitivity signal from normal mammary epithelial cells52 around TSS was contained in the region. Coding sequence within this region, and microRNA and snoRNA entries, were removed from the tested genomic elements.
Consequences of promoter mutation on transcription factor binding were evaluated through query of multiple PWM data sets53–58. Significant matches were determined with the TFM-pvalue program59 at a significance threshold α = 1 × 10⁻⁴. Disrupted/created motifs were inferred on the basis of the score difference between the WT and mutant sequence match score.
We note that the previously described recurrent mutation in the PLEKHS1 promoter1,2 was absent from our analysis since it was not part of our target design and hence was not covered for mutation discovery. Similarly, a small region upstream of WDR74 was targeted on the ExomePlus assay, and this region—owing to its location >400 bp upstream of the annotated WDR74 promoter—was not included in the promoter search list. Manual inspection of the previously published location of WDR74 promoter mutations, however, revealed only two patients with mutations located in this region.
Mutation validation and de novo detection of promoter mutations
We designed a targeted amplicon assay (Illumina TruSeq Custom Amplicon) to validate several recurrently mutated promoter mutations in 47 patients from our initial cohort and 46 additional breast cancer cell lines (median coverage across samples and genes was approximately 3,900×).
Samples were plated at 25 μl with a total concentration target of 15–20 ng μl−1. The samples were hybridized with their custom oligonucleotide pool and then run through a series of steps consisting of washing, extension and ligation of the bound oligos, and PCR amplification, where Illumina custom i5 and i7 sequencing primers were added to the final product. After this amplification step, the product was cleaned with solid-phase reversible immobilization (SPRI) beads and quantified using PicoGreen. The product was normalized and pooled using the Hamilton Starlet robot and sequenced on a HiSeq 2500.
Validation of mutations in tumours with previously called mutations was performed using MutationValidator60. Additional mutations were detected using MuTect without a matched normal sample.
Targeted sequencing of FOXA1 promoter mutation
A 240 bp region of FOXA1 (chromosome 14: 38,064,261–38,064,500; hg19) was amplified and sequenced in 623 tumour or normal samples and 47 breast cancer cell lines. These PCRs were performed in two reactions. Round-1 PCR primers contained target-specific sequences and Illumina adaptor sequences, producing a product of 308 bp. Round-2 PCR was a ‘tailing’ PCR in that PCR2 primers contained overlap of the Illumina adaptor sequence, as well as the flow cell attachment sequence, and an 8 bp index on the reverse primer between the adaptor sequence and flow cell attachment sequence. This tailing PCR produced sequence-ready constructs (364 bp) that did not require further library construction. First-round PCR was performed using a Platinum Pfx DNA polymerase kit (Life Technologies,). PCR1 reactions consisted of 50 μl: 2 μl DNA (at ~25 ng μl−1), 3 μl mixed F/R tailed target-specific primer (at 20 μM mixed), 5 μl 10× Pfx amplification buffer, 1.5 μl dNTPs (at 10 mM each (Agilent Technologies)), 0.8 μl Pfx Platinum DNA polymerase, 1μl MgSO4 (at 50 mM), 5 μl 10× Pfx Enhancer Solution, and 31.7 μl nuclease-free water. The polymerase (0.4 μl polymerase+1.6μl water) was added to reactions after 1 min at 95 °C. Thermal cycling consisted of 95 °C for 5 min (paused at 1 min to add polymerase) and 33 cycles of (95 °C 30 s, 55 °C 30 s, 68 °C 1 min). A sample of PCR1 products (and negative control) was visually inspected on a Laboratory Chip GX II Caliper Instrument (Perkin Elmer). Next, second-round index-tailing PCRs were again performed with a Platinum Pfx DNA polymerase kit (Life Technologies,). PCR2 reactions consisted of 50 μl: 3.9μl PCR1 product, 2.4 μl mixed F/R indexing primer (at 25 μM mixed), 5 μl 10× Pfx amplification buffer, 1.5 μl dNTPs (at 10 mM each (Agilent Technologies)), 0.4 μl Pfx Platinum DNA polymerase, 1 μl MgSO4 (at 50 mM), 5 μl 10× Pfx Enhancer Solution, and 30.8 μl nuclease-free water. The polymerase (0.4 μl polymerase+1.6μl water) was added to reactions after 1 min at 95 °C. Thermal cycling consisted of 95 °C for 5 min and eight cycles of (95 °C 30 s, 55 °C 30 s, 68 °C 1 min). Indexed amplicons were pooled in equal volumes (96 reactions per pool), and purified using 1.5× SPRI cleanup with Agencourt Ampure XP beads (Beckman Coulter). Final amplicon library pools were visually inspected and quantified on a BioAnalyzer (Agilent Technologies). The library was re-quantified by SYBR green qPCR before denaturing and cluster generation. A PhiX library, derived from the well-characterized and small PhiX genome, was spiked in at 92% to add diversity to high-GC single-amplicon clusters for improved cluster imaging. One MiSeq run (2 × 150 bp paired end with standard sequencing primers) was performed for each pool of indexed amplicons, using standard sequencing protocols (Illumina).
Primer sequences (5′–3′)
Target-specific primer sequences: forward, CTGAGCAGCTGCAGTCACC; reverse, CTCTCAAGCGACGTAAGATCCA. PCR1 primers (target-specific primers with ‘tails’): forward, ACACTCTTTCCCTACACGACGCTCTTCCGATCTCTGAGCAGCTGCAGTCACC; reverse, GTGACTGGAGTTCAGACGTGTGCTCTTCCGATCTCTCAAGCGACGTAAGATCCA. PCR2 primers (tailing/indexing PCR): forward, AATGATACGGCGACCACCGAGATCTACACTCTTTCCCTACACGACGCTCTTCCGATCT; reverse, CAAGCAGAAGACGGCATACGAGATNNNNNNNNGTGACTGGAGTTCAGACGTGTGCTCTTCCGATCT.
Mutation calling from ultra-deep sequencing data
Targeted sequencing data for the FOXA1 locus was analysed for 330 tumours with at least 100× coverage (median approximately 69,000×) over the mutation site. Of these, 64 were not part of the initial ExomePlus cohort, and 140 tumours had ExomePlus array data but were not covered at the FOXA1 hotspot mutation site. For 14 patients, targeted sequencing data from fresh frozen as well as FFPE tumours were generated.
Four FOXA1 mutations called by MuTect from ExomePlus data were subjected to Mutation Validator with FOXA1 targeted sequencing. The three G>A mutations could be validated; a G>C mutation failed to validate and was discarded from further analysis.
Allele counts were generated for each sample using Samtools mpileup61. Base calls with quality scores less than 25 were removed from the analysis. We used a binomial model to call mutations at the FOXA1 hotspot position (chromosome 14: 38064406; hg19) in each sample, assuming a 5% noise level. For each sample and variant base at this position, we calculated the probability of observing at least nalt bases by chance, given the total coverage ntotal observed at this site and the noise level p:
where F(nalt; ntotal, p) is the cumulative binomial distribution function:
This method called mutations in targeted sequencing that were identified by MuTect in ExomePlus data and validated above, and detected mutations in six additional patients. For three of the nine total patients with a FOXA1 hotspot mutation (validated above and detected by the ultra-deep sequencing), both FFPE and fresh frozen data were available. In all cases, the mutation was seen both in fresh frozen and in FFPE data.
No FOXA1 hotspot mutations were detected in the tested breast cancer cell lines (AU565, BT-20, BT-474, BT-483, BT-549, CAL-120, CAL-51, CAL-85-1, CAMA-1, DU4475, EFM-19, EFM-192A, HCC1143, HCC1187, HCC1395, HCC1428, HCC1500, HCC1569, HCC1599, HCC1806, HCC1937, HCC1954, HCC202, HCC2157, HCC2218, HCC38, HCC70, HDQ-P1, HMC-1-8, Hs343T, Hs578T, JIMT-1, MCF-7, MDA-MC-134-VI, MDA-MB-157, MDA-MB-175-VII, MDA-MB-231, MDA-MB-361, MDA-MB-415, MDA-MB-436, MDA-MB-453, MDA-MB-468, T-47D, UACC-812, ZR-75-1, ZR-75-30, UACC-893).
TCGA copy number data
GISTIC significant copy number events were obtained from the Broad Institute’s copy number portal (http://www.broadinstitute.org/tcga/gistic/browseGisticByGene), run 2015-06-01 stddata__04_02_2015 regular peel-off.
Intragenomic replicates analysis
Comparison of binding affinity of 6-bp WT and mutant E2F-like recognition sequences (Fig. 3f and Extended Data Fig. 7a) in the FOXA1 promoter was performed according to ref. 62. Motif instances for WT and mutant sequences as well as a scrambled control for each were identified in the genome and subset to instances overlapping open chromatin regions in MCF-7 breast cancer cells52 (Extended Data Fig. 7b). E2F1 ChIP-seq signal for MCF-7 cells52 was collated around each of the motif instances, and averages for WT and mutant motifs were compared using a two-sided Student’s t-test. Motif and ChIP-seq data analyses were performed using the HOMER package (version 4.1)63 and custom R code.
Power analyses
Power analyses were performed as previously described6. For this study, we first determined a median mutant allele fraction of 0.15 across all 360 patients and then calculated the average mutation detection sensitivity across all bases in each promoter for this mutant allele fraction in 26 patients of the data set (representing the 10 most and least covered samples and 6 with matched TCGA whole-genome sequencing data from a previous study)14. The median detection sensitivity was 44%, corresponding to a median ‘missed’ mutation rate m of 1 −0.44= 0.56. Detection sensitivity of TCGA breast cancer whole genomes was performed on 100 tumour alignments, yielding a median detection sensitivity of 93% across all promoter regions.
We used a binomial model to calculate the power to discover recurrent events at different population frequencies as a function of patient cohort size and a fixed detection sensitivity of d =0.44=(1−m), where m is the mis-detection rate, as described in ref. 6. We assume a gene length L = 650 (the targeted promoter size), a fixed mutation rate μ of 2.96 mutations per megabase (the average mutation rate), and an fg value of 1. We then calculated the probability of seeing at least one mutation by chance in each patient as p0 =1−(1−μfg)L and the signal for each mutation population frequency r as p1 =1−(1−p0) × (1−r × d). When either the background mutation rate μ or mutation frequency r is high, this guarantees p1 ≤ 1; otherwise the equation reduces to p1 ≈ p0 + r × d (ref. 6).
To determine power, we first calculated the minimal number n{min} of patients that would reach genome-wide significance: that is, P < 0.1/25,000, assuming 25,000 promoters and p = p0. The power is then the probability of observing at least n{min} patients with a mutation under the alternative model (that is, a binomial model with p = p1). Smoothed power calculations were performed for constant m and variable r (Fig. 4a and Extended Data Fig. 9).
Calculation of functional mutation rates (Fig. 4c) was performed assuming total territory for promoters and 75% of the coding gene length for coding genes.
Validation data and association tests
Mutation and clinical data were aggregated from the ExomePlus, TCGA BRCA10,11, and BRCA560 (ref. 5) cohorts. For TCGA patients, promoter mutations were derived from whole-genome sequences and protein-coding mutations obtained for matching exome aliquots from http://firebrowse.org/?cohort=BRCA# because the deeper exome coverage provided higher power to discover mutations in coding regions. Coding driver mutation events for the data set from BRCA560 were obtained from Supplementary Table 14 in that reference. Non-coding mutations for FOXA1 were obtained from the authors. Only SNP/indel-derived events were included for consistency with the other cohorts of patients.
For promoter mutations with single-site hotspots (TBC1D12, ZNF143, ALDOA, FOXA1, LEPROTL1), only mutations at these positions were included in association tests. For genes with clustered (but not necessarily single-site) mutations, events from the TCGA and cohorts from BRCA560 were included if they were located within 5 bp of the cluster boundaries identified in the ExomePlus data. Associations of various FOXA1 alterations (Fig. 3h) were restricted to the ExomePlus patient cohort.
Association tests between promoter mutations and other patient-specific characteristics were performed using Fisher’s exact test.
Luciferase reporter assays
HEK293T cells were obtained from the American Type Culture Collection (ATCC) and tested negative for mycoplasma contamination. Reporter constructs were generated by cloning WT or mutant promoter sequences into the 7-TFP Wnt signalling reporter64, replacing the seven TCF binding-site-containing promoter upstream of the firefly luciferase reading frame. Briefly, DNA sequence blocks representing the various WT and mutant promoter sequences, starting with a unique PstI site, and including the 5′-most 174 bp of the luciferase open reading frame (ending in a unique BstB1 site) were obtained from GenScript and sub-cloned into the PstI- and BstBI-digested 7-TFP vector. After construct verification by DNA sequence analysis, 100 ng of these reporter constructs together with 100 ng of the Renilla luciferase expression vector pGL4.70[hRluc] (Promega) were co-transfected in triplicate into HEK293T cells using X-tremeGENE 9 DNA transfection reagent (Roche). Measurements of normalized luciferase activity were determined after 48 h by using the Dual-Luciferase Reporter Assay System (Promega) according to the manufacturer’s instructions. For the reporter assay evaluating the effect of E2F and DP1 on the FOXA1 promoter, E2F3 and DP1 expression vectors65 were transfected into HEK293T cells and nuclear extracts prepared 48 h after transfection. E2F3 was chosen for this experiment because it has been shown that E2F1 can induce apoptosis upon overexpression66,67. Construct details are listed in Supplementary Table 7. Reporter assays for TBC1D12, LEPROTL1, ZNF143, ALDOA, RMRP, and FOXA1 promoters were performed as three biological replicates with three technical replicates each. Four biological replicates were performed for NEAT1 promoter mutations, with the exception of mutation 2 (two replicates). Data points for FOXA1 E2F/DP1 reporter assays were derived from three biological replicates.
To justify use of the Student’s t-test for reporter assay comparison where the number of individual observations was small, we tested whether luciferase/Renilla ratios from the FOXA1 experiment (as representative example) were indeed t-distributed. First, t-scores were calculated for all values as
where m is the sample mean, s the sample standard deviation, and n the number of observations. We then evaluated the distribution of t-scores against a t-distribution with one degree of freedom using the two-sided Kolmogorov–Smirnov test. With P values of 0.28 (WT observations) and 0.21 (mutant observations), the t-distribution and observed distributions did not differ significantly from each other, and thus Student’s t-test was an appropriate test for comparing reporter assay results.
EMSAs
EMSAs were performed using a ThermoFisher Scientific LightShift Chemiluminescent EMSA kit following the manufacturer’s instructions. Briefly, HEK293T cell nuclear extracts were prepared using NE-PER Nuclear and Cytoplasmic Extraction Reagents (ThermoFisher Scientific) according to the manufacturer’s protocol. EMSA reactions included 1× binding buffer, 50 ng poly(dI-dC), 2.5% glycerol, 0.06% Nonidet P-40, 5 mM MgCl2, 19 μg BSA, 2 μl nuclear extract, and 20 fM biotin-labelled probes. Specificity of mobility shifts was analysed by including increasing amounts of unlabelled WT or mutant FOXA1 competitor oligonucleotides, or WT or mutant E2F binding primers68. Competitor probes were added at concentrations of 4 pM and 8 pM. Reactions were incubated for 20 min at room temperature, size-separated on a 6% DNA retardation gel (ThermoFisher Scientific), and transferred to a Biodyne B Nylon membrane (ThermoFisher Scientific). Free or protein-bound biotin-labelled probes were detected using streptavidin–horseradish peroxidase conjugates and chemiluminescent substrate according to the manufacturer’s protocol. Probe sequences for promoter regions are listed in Supplementary Table 8 and for E2F were taken from ref. 68.
E2F/DP1 biotin pull-down assay
Magnetic streptavidin Dynabeads M-280 (Invitrogen) were blocked in 5% non-fat milk in PBS for 30 min and subsequently washed with binding buffer (20 mM Tris/HCl, pH 7.5, 0.5 M NaCl, 1 mM EDTA) using a magnetic separator. WT and mutant 3′-biotinylated double-stranded DNA oligonucleotides were generated by denaturing equal amounts of complementary oligonucleotides for 5 min at 90 °C, followed by overnight cooling to room temperature. Oligonucleotides were coupled to beads by incubating them for 30 min in binding buffer with constant shaking. The DNA-coupled beads were washed two times with wash buffer (25 mM HEPES, pH 7.9, 100 mM KCl, 12 mM MgCl2, 1 mM EDTA, 5% glycerol, and 2 mM dithiothreitol) and beads (500 fmol DNA per reaction) were incubated with 200 μg 293T nuclear extract in 50μl 50 mM HEPES/KOH, pH 7.8, 50 mM KCl, 10 mM MgCl2, 0.5 mM EDTA, 1.5 mM dithiothreitol, 2.5% glycerol buffer. Reactions were incubated at 30 °C for the indicated times before cross-linking for an additional 10 min with 0.5% formaldehyde (final concentration; time zero equates to cross-linking immediately after extract addition). Beads were washed twice with 50 μl wash buffer, resus-pended in 20 μl SDS sample buffer, and cross links were reversed by heating for 2 h at 65 °C. Finally, proteins were separated on a 10% SDS polyacrylamide gel followed by transfer to polyvinylidene difluoride (PVDF) membrane and immunoblot analysis with the indicated E2F or DP1 antibodies.
Fulvestrant sensitivity assay
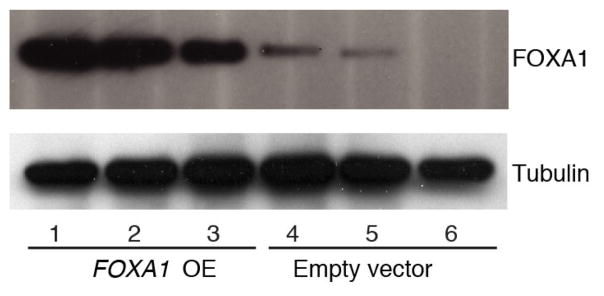
The fulvestrant-sensitive, single-colony-derived MCF-7 subline U2 was described previously69. MCF-7/U2 cells were transfected with a FOXA1 expression plasmid (open reading frame ccsbBroad304_06385) or a control vector (pLX_TRC304) provided by the Genetic Perturbation Platform of the Broad Institute using the Neon electroporation system (ThermoFisher Scientific). Colonies of stable transfectants were isolated after 2 weeks of blasticidin selection and FOXA1 protein expression was evaluated by western blotting (anti-FOXA1 antibody ab170933, Abcam, Cambridge, Massachusetts, USA; Extended Data Fig. 8). Three independent FOXA1-overexpressing clones and three mock-transfected clones were subjected to cell growth and fulvestrant sensitivity assays as previously described69 using a CyQUANT NF kit (ThermoFisher). Measurements for each clone were performed in triplicate. Statistical significance was examined using a two-tailed Student’s t-test.
Data availability
Sequencing data for 360 breast cancers have been deposited in dbGAP (https://www.ncbi.nlm.nih.gov/gap) under accession number phs001250. v1.p1. All other data are available from the corresponding author upon reasonable request.
Extended Data
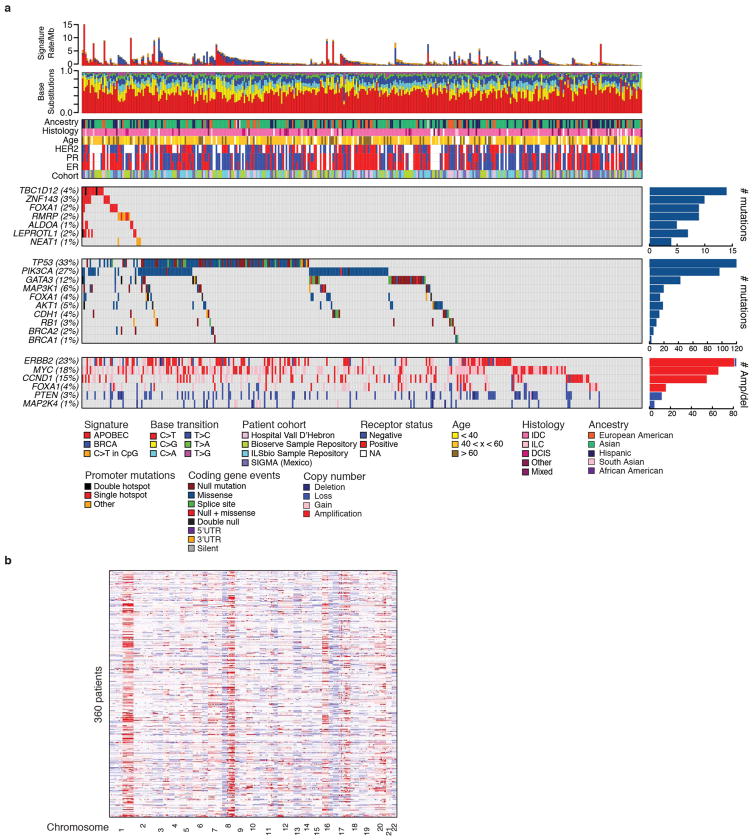
Extended Data Figure 1. Patient cohort characteristics.
a, Comprehensive overview of coding and non-coding mutations in 360 breast cancer samples assayed on the ExomePlus platform. Samples are ordered on the basis of the promoter mutation events, then by known breast cancer coding drivers. b, Copy number profiles for 360 breast cancers.
Extended Data Figure 2. Targeted validation of promoter mutations.
a, Targeted sequencing validation of selected promoter mutations in 47 patients from the ExomePlus cohort with Illumina TruSeq Custom Amplicon panel (TSCA)-targeted sequencing technology. b, Validation rate of promoter mutations calculated as validated mutations over all sequenced and powered mutations. c, Median detection sensitivity at mutated sites for significantly mutated promoters. Each point indicates a single mutated position. d, PCR-MiSeq for the FOXA1 promoter locus for 126 patients with sufficient coverage for mutation calling from the original ExomePlus cohort. Three out of four mutations validated in experiment (green and red bars). PCR-MiSeq for 140 patients included but not covered in original ExomePlus experiment and 64 additional tumours yielded three novel mutations in each set (light and dark blue bars). No germline mutations at this site were detected in normal samples.
Extended Data Figure 3. Bi-allelic hits for TBC1D12 and LEPROTL1 promoter mutations.
a, Sequencing read alignment for tumour BDD-162 shows location of TBC1D12 hotspot mutations on mutually exclusive alleles. b, Location of hotspot mutations near the LEPROTL1 transcription start on mutually exclusive sequencing reads in patient BDD-MEX-BR-116. Reference bases are indicated in grey, mismatched bases in their respective colours (A, green; C, blue; G, orange; T, red). Hotspot mutation sites are outlined with black boxes. Images generated with the Integrative Genomics Viewer70.
Extended Data Figure 4. Characterization of TBC1D12 mutations.
a, TBC1D12 hotspot mutations are present in patients from TCGA (exome sequencing; numbers in parentheses indicate total number of patients). b, Exome hybrid capture alignment confirms mutual exclusivity of TBC1D12 mutations in a patient with bladder cancer (TCGA-C4-ACF1). Image generated with the Integrative Genomics Viewer70. c, TBC1D12 genomic locus (hg19) depicting location of promoter region and overlap with MCF-7 breast cancer cell line DNase signal. Red bar indicates native promoter region and TBC1D12 5′ UTR included in the promoter mutation reporter assay construct. Zoomed-in region shows two upstream putative alternative translation start sites (methionine, highlighted in green) potentially giving rise to larger luciferase protein products. Multiple sequence alignment of amino-acid sequence in primates illustrates evolutionary conservation of upstream translation start sites and downstream protein sequence in most species. Image generated with the Integrative Genomics Viewer70. d, Western blot of luciferase expressed from TBC1D12 and control reporter assay construct. Note that luciferase expressed from TBC1D12 construct is approximately 80 kDa larger than the control.
Extended Data Figure 5. Luciferase reporter assay and EMSA for additional promoter mutations.
a, EMSA shows gel shift for FOXA1 WT (lanes 1 and 2) and mutant (lanes 5 and 6) probes when incubated with HEK293T nuclear cell extract. WT FOXA1 competitor competes off protein from WT probes in a concentration-dependent manner (1 and 5 molar excess), but fails to do so for the mutant FOXA1 probe. Luciferase reporter assay and EMSA for WT and mutated probes in ZNF143 (b), LEPROTL1 (c), ALDOA (d), and TBC1D12 (e) show significantly decreased expression activity and a trend for loss of binding in promoter mutants (except for TBC1D12, where there is no binding). Individual data points in reporter assays (black) overlap summary statistic boxplots (grey) with median indicated by black horizontal line. P values calculated with two-sided Student’s t-test. Lanes 1 and 4 in each EMSA show biotinylated probes only. Lanes 2 and 5 show that addition of HEK293T nuclear extract induces a mobility shift of the biotinylated WT and mutant probes, indicating protein binding to the probe. Gel shift is prevented by the addition of excess matched unlabelled probes (lanes 3 and 6). No binding occurs for either WT or mutant probes in the TBC1D12 promoter (e), suggesting that these mutations do not affect transcriptional regulation from DNA.
Extended Data Figure 6. Increased binding of E2F/DP1 to the mutant FOXA1 promoter.
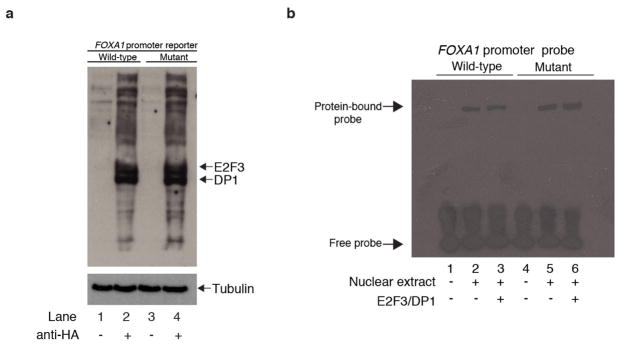
a, Immunoblot for haemagglutinin (HA)-tagged E2F3 and DP1 shows binding of both proteins in HEK293T cells transfected with either WT or mutant FOXA1 promoter luciferase construct. Immunoblot against tubulin serves as loading control. b, EMSA for HEK239T cells transfected with E2F3/DP1 expression constructs. EMSA was then performed for FOXA1 WT (lanes 1–3) and mutant (lanes 4–6) promoter probes. Ectopic expression of E2F3/DP1 increases nuclear protein binding signal to the mutant promoter compared with WT (compare lane 6 with lane 3), suggesting that increase in binding observed in mutant over WT is at least in part because of increased recruitment of the E2F/DP1 complex.
Extended Data Figure 7. IGR analysis.
a, Motif instances overlapping open chromatin in MCF-7 cells were considered for analysis (example of FOXA1 is shown). b, E2F1 average ChIP-seq signal from MCF-7 cells at WT, mutant, and control scramble motif locations measured in a 400 bp region surrounding motifs. Grey lines, 95% confidence interval.
Extended Data Figure 8. Stable overexpression of FOXA1 in MCF-7 cells.
MCF-7 cells stably transfected with FOXA1 show strong FOXA1 overexpression compared with MCF-7 cells transfected with empty vector.
Extended Data Figure 9. Discovery power in TCGA data set.
Discovery power of TCGA breast cancer whole genomes (100 patients) with median detection sensitivity of 93%. Black vertical line indicates power values for 100 patients. Horizontal red line demarcates 90% power.
Extended Data Figure 10. Lack of association between promoter mutation rate in ExomePlus cohort and covariates shown to correlate with mutation rate in coding genes.
Each bin represents a covariate quintile, and mutation rates are aggregates over all promoters in each bin. Error bars, s.d. of 1,000 bootstrap simulations. H3K4me1 signal from ENCODE breast luminal epithelial cells.
Supplementary Material
Acknowledgments
We thank the patients who contributed samples to this study. This study was a collaboration of the Broad Institute in Cambridge, Massachusetts, USA, and the National Institute of Genomic Medicine (INMEGEN) in Mexico City, Mexico. The work was conducted as part of the Slim Initiative in Genomic Medicine for the Americas (SIGMA), a project funded by the Carlos Slim Foundation in Mexico. We are grateful to S. Romero-Cordoba, R. Rebollar, and L. Alfaro-Ruiz for sample collection and processing. We thank the Broad Institute Genomics Platform and Target Accelerator for assistance; N. Dyson for assistance with E2F experiments; A. Kamburov and D. Rosebrock for computational help; M. Snyder, J. Reuter, and C. Cenik for discussion on TBC1D12; and S. Nik-Zainal for data access guidance. E.R., M.R., A.T.W., C.S., M.C., and J.S.B. were partly funded by SIGMA. J.M.E. was supported by the Fannie and John Hertz Foundation. P.P. and A.B were partly funded by the Massachusetts General Hospital startup funds of G.G. G.G. was partly funded by the Paul C. Zamecnick, MD, Chair in Oncology at Massachusetts General Hospital.
Footnotes
Author Contributions G.G., M.M., T.R.G., and E.S.L. conceived and designed the study. A.H.-M., S.R.-C., J.B., and L.W.E. contributed patient samples. E.R. and G.G. designed analysis and developed methods. E.R., J.K., G.T., A.T.-W., and P.S. performed data analysis. P.P., J.G., J.M.E., T.S., Z.Z., J.L., and E.R. performed experiments. M.S.L., J.H., M.R., T.J.P., Y.E.M., and C.S. contributed data and analysis tools. M.L.C., S.S., C.C., and A.T. provided project management. G.G., S.B.G., J.S.B., M.M., A.J.I., A.B., T.R.G., and E.S.L. provided project leadership. E.R., E.S.L., and G.G. wrote the manuscript.
The authors declare competing financial interests: details are available in the online version of the paper.
Readers are welcome to comment on the online version of the paper.
Supplementary Information is available in the online version of the paper.
Online Content Methods, along with any additional Extended Data display items and Source Data, are available in the online version of the paper; references unique to these sections appear only in the online paper.
References
- 1.Fredriksson NJ, Ny L, Nilsson JA, Larsson E. Systematic analysis of noncoding somatic mutations and gene expression alterations across 14 tumor types. Nat Genet. 2014;46:1258–1263. doi: 10.1038/ng.3141. [DOI] [PubMed] [Google Scholar]
- 2.Weinhold N, Jacobsen A, Schultz N, Sander C, Lee W. Genome-wide analysis of noncoding regulatory mutations in cancer. Nat Genet. 2014;46:1160–1165. doi: 10.1038/ng.3101. [DOI] [PMC free article] [PubMed] [Google Scholar]
- 3.Araya CL, et al. Identification of significantly mutated regions across cancer types highlights a rich landscape of functional molecular alterations. Nat Genet. 2016;48:117–125. doi: 10.1038/ng.3471. [DOI] [PMC free article] [PubMed] [Google Scholar]
- 4.Melton C, Reuter JA, Spacek DV, Snyder M. Recurrent somatic mutations in regulatory regions of human cancer genomes. Nat Genet. 2015;47:710–716. doi: 10.1038/ng.3332. [DOI] [PMC free article] [PubMed] [Google Scholar]
- 5.Nik-Zainal S, et al. Landscape of somatic mutations in 560 breast cancer whole-genome sequences. Nature. 2016;534:47–54. doi: 10.1038/nature17676. [DOI] [PMC free article] [PubMed] [Google Scholar]
- 6.Lawrence MS, et al. Discovery and saturation analysis of cancer genes across 21 tumour types. Nature. 2014;505:495–501. doi: 10.1038/nature12912. [DOI] [PMC free article] [PubMed] [Google Scholar]
- 7.Cibulskis K, et al. Sensitive detection of somatic point mutations in impure and heterogeneous cancer samples. Nat Biotechnol. 2013;31:213–219. doi: 10.1038/nbt.2514. [DOI] [PMC free article] [PubMed] [Google Scholar]
- 8.Lawrence MS, et al. Mutational heterogeneity in cancer and the search for new cancer-associated genes. Nature. 2013;499:214–218. doi: 10.1038/nature12213. [DOI] [PMC free article] [PubMed] [Google Scholar]
- 9.Nik-Zainal S, et al. Mutational processes molding the genomes of 21 breast cancers. Cell. 2012;149:979–993. doi: 10.1016/j.cell.2012.04.024. [DOI] [PMC free article] [PubMed] [Google Scholar]
- 10.Ciriello G, et al. Comprehensive molecular portraits of invasive lobular breast cancer. Cell. 2015;163:506–519. doi: 10.1016/j.cell.2015.09.033. [DOI] [PMC free article] [PubMed] [Google Scholar]
- 11.The Cancer Genome Atlas Network. Comprehensive molecular portraits of human breast tumours. Nature. 2012;490:61–70. doi: 10.1038/nature11412. [DOI] [PMC free article] [PubMed] [Google Scholar]
- 12.Ellis MJ, et al. Whole-genome analysis informs breast cancer response to aromatase inhibition. Nature. 2012;486:353–360. doi: 10.1038/nature11143. [DOI] [PMC free article] [PubMed] [Google Scholar]
- 13.Stephens PJ, et al. The landscape of cancer genes and mutational processes in breast cancer. Nature. 2012;486:400–404. doi: 10.1038/nature11017. [DOI] [PMC free article] [PubMed] [Google Scholar]
- 14.Banerji S, et al. Sequence analysis of mutations and translocations across breast cancer subtypes. Nature. 2012;486:405–409. doi: 10.1038/nature11154. [DOI] [PMC free article] [PubMed] [Google Scholar]
- 15.Getz G, et al. Comment on “The consensus coding sequences of human breast and colorectal cancers”. Science. 2007;317:1500. doi: 10.1126/science.1138764. [DOI] [PubMed] [Google Scholar]
- 16.Alexandrov LB, et al. Signatures of mutational processes in human cancer. Nature. 2013;500:415–421. doi: 10.1038/nature12477. [DOI] [PMC free article] [PubMed] [Google Scholar]
- 17.Roberts SA, et al. An APOBEC cytidine deaminase mutagenesis pattern is widespread in human cancers. Nat Genet. 2013;45:970–976. doi: 10.1038/ng.2702. [DOI] [PMC free article] [PubMed] [Google Scholar]
- 18.Kim J, et al. Somatic ERCC2 mutations are associated with a distinct genomic signature in urothelial tumors. Nat Genet. 2016;48:600–606. doi: 10.1038/ng.3557. [DOI] [PMC free article] [PubMed] [Google Scholar]
- 19.Carter SL, et al. Absolute quantification of somatic DNA alterations in human cancer. Nat Biotechnol. 2012;30:413–421. doi: 10.1038/nbt.2203. [DOI] [PMC free article] [PubMed] [Google Scholar]
- 20.Horn S, et al. TERT promoter mutations in familial and sporadic melanoma. Science. 2013;339:959–961. doi: 10.1126/science.1230062. [DOI] [PubMed] [Google Scholar]
- 21.Huang FW, et al. Highly recurrent TERT promoter mutations in human melanoma. Science. 2013;339:957–959. doi: 10.1126/science.1229259. [DOI] [PMC free article] [PubMed] [Google Scholar]
- 22.Huang W, et al. DDX5 and its associated lncRNA Rmrp modulate TH17 cell effector functions. Nature. 2015;528:517–522. doi: 10.1038/nature16193. [DOI] [PMC free article] [PubMed] [Google Scholar] [Retracted]
- 23.Standaert L, et al. The long noncoding RNA Neat1 is required for mammary gland development and lactation. RNA. 2014;20:1844–1849. doi: 10.1261/rna.047332.114. [DOI] [PMC free article] [PubMed] [Google Scholar]
- 24.Carroll JS, et al. Chromosome-wide mapping of estrogen receptor binding reveals long-range regulation requiring the Forkhead protein FoxA1. Cell. 2005;122:33–43. doi: 10.1016/j.cell.2005.05.008. [DOI] [PubMed] [Google Scholar]
- 25.Hurtado A, Holmes KA, Ross-Innes CS, Schmidt D, Carroll JS. FOXA1 is a key determinant of estrogen receptor function and endocrine response. Nat Genet. 2011;43:27–33. doi: 10.1038/ng.730. [DOI] [PMC free article] [PubMed] [Google Scholar]
- 26.Ross-Innes CS, et al. Differential oestrogen receptor binding is associated with clinical outcome in breast cancer. Nature. 2012;481:389–393. doi: 10.1038/nature10730. [DOI] [PMC free article] [PubMed] [Google Scholar]
- 27.Badve S, et al. FOXA1 expression in breast cancer–correlation with luminal subtype A and survival. Clin Cancer Res. 2007;13:4415–4421. doi: 10.1158/1078-0432.CCR-07-0122. [DOI] [PubMed] [Google Scholar]
- 28.Thorat MA, et al. Forkhead box A1 expression in breast cancer is associated with luminal subtype and good prognosis. J Clin Pathol. 2008;61:327–332. doi: 10.1136/jcp.2007.052431. [DOI] [PubMed] [Google Scholar]
- 29.Mehta RJ, et al. FOXA1 is an independent prognostic marker for ER-positive breast cancer. Breast Cancer Res Treat. 2012;131:881–890. doi: 10.1007/s10549-011-1482-6. [DOI] [PubMed] [Google Scholar]
- 30.Fu X, et al. FOXA1 overexpression mediates endocrine resistance by altering the ER transcriptome and IL-8 expression in ER-positive breast cancer. Proc Natl Acad Sci USA. 2016;113:E6600–E6609. doi: 10.1073/pnas.1612835113. [DOI] [PMC free article] [PubMed] [Google Scholar]
- 31.Jeselsohn R, et al. TransCONFIRM: identification of a genetic signature of response to fulvestrant in advanced hormone receptor-positive breast cancer. Clin Cancer Res. 2016;22:5755. doi: 10.1158/1078-0432.CCR-16-0148. [DOI] [PMC free article] [PubMed] [Google Scholar]
- 32.Fisher S, et al. A scalable, fully automated process for construction of sequence-ready human exome targeted capture libraries. Genome Biol. 2011;12:R1. doi: 10.1186/gb-2011-12-1-r1. [DOI] [PMC free article] [PubMed] [Google Scholar]
- 33.Gnirke A, et al. Solution hybrid selection with ultra-long oligonucleotides for massively parallel targeted sequencing. Nat Biotechnol. 2009;27:182–189. doi: 10.1038/nbt.1523. [DOI] [PMC free article] [PubMed] [Google Scholar]
- 34.Pugh TJ, Banerji S, Meyerson M. Pugh et al. reply. Nature. 2015;520:E12–E14. doi: 10.1038/nature14266. [DOI] [PubMed] [Google Scholar]
- 35.Li H, Durbin R. Fast and accurate short read alignment with Burrows–Wheeler transform. Bioinformatics. 2009;25:1754–1760. doi: 10.1093/bioinformatics/btp324. [DOI] [PMC free article] [PubMed] [Google Scholar]
- 36.Cibulskis K, et al. ContEst: estimating cross-contamination of human samples in next-generation sequencing data. Bioinformatics. 2011;27:2601–2602. doi: 10.1093/bioinformatics/btr446. [DOI] [PMC free article] [PubMed] [Google Scholar]
- 37.Costello M, et al. Discovery and characterization of artifactual mutations in deep coverage targeted capture sequencing data due to oxidative DNA damage during sample preparation. Nucleic Acids Res. 2013;41:e67. doi: 10.1093/nar/gks1443. [DOI] [PMC free article] [PubMed] [Google Scholar]
- 38.Ramos AH, et al. Oncotator: cancer variant annotation tool. Hum Mutat. 2015;36:E2423–E2429. doi: 10.1002/humu.22771. [DOI] [PMC free article] [PubMed] [Google Scholar]
- 39.Mermel CH, et al. GISTIC2.0 facilitates sensitive and confident localization of the targets of focal somatic copy-number alteration in human cancers. Genome Biol. 2011;12:R41. doi: 10.1186/gb-2011-12-4-r41. [DOI] [PMC free article] [PubMed] [Google Scholar]
- 40.Landau DA, et al. Mutations driving CLL and their evolution in progression and relapse. Nature. 2015;526:525–530. doi: 10.1038/nature15395. [DOI] [PMC free article] [PubMed] [Google Scholar]
- 41.Purcell SM, et al. A polygenic burden of rare disruptive mutations in schizophrenia. Nature. 2014;506:185–190. doi: 10.1038/nature12975. [DOI] [PMC free article] [PubMed] [Google Scholar]
- 42.Price AL, et al. Principal components analysis corrects for stratification in genome-wide association studies. Nat Genet. 2006;38:904–909. doi: 10.1038/ng1847. [DOI] [PubMed] [Google Scholar]
- 43.Gonzalez-Perez A, Lopez-Bigas N. Functional impact bias reveals cancer drivers. Nucleic Acids Res. 2012;40:e169. doi: 10.1093/nar/gks743. [DOI] [PMC free article] [PubMed] [Google Scholar]
- 44.Lochovsky L, Zhang J, Fu Y, Khurana E, Gerstein M. LARVA: an integrative framework for large-scale analysis of recurrent variants in noncoding annotations. Nucleic Acids Res. 2015;43:8123–8134. doi: 10.1093/nar/gkv803. [DOI] [PMC free article] [PubMed] [Google Scholar]
- 45.Martincorena I, et al. Tumor evolution. High burden and pervasive positive selection of somatic mutations in normal human skin. Science. 2015;348:880–886. doi: 10.1126/science.aaa6806. [DOI] [PMC free article] [PubMed] [Google Scholar]
- 46.Dees ND, et al. MuSiC: identifying mutational significance in cancer genomes. Genome Res. 2012;22:1589–1598. doi: 10.1101/gr.134635.111. [DOI] [PMC free article] [PubMed] [Google Scholar]
- 47.Geyer CJ, Meeden GD. Fuzzy and randomized confidence intervals and P values. Stat Sci. 2005;20:358–366. [Google Scholar]
- 48.Routledge R. Practicing safe statistics with the mid-p. Can J Stat. 1994;22:103–110. [Google Scholar]
- 49.Kamburov A, et al. Comprehensive assessment of cancer missense mutation clustering in protein structures. Proc Natl Acad Sci USA. 2015;112:E5486–E5495. doi: 10.1073/pnas.1516373112. [DOI] [PMC free article] [PubMed] [Google Scholar]
- 50.Getz G, Gould J, Monti S. Boosting permutation tests for marker selection. Broad Institute publications; 2006. http://www.broadinstitute.org/mpr/publications/projects/Computational_Biology/GetzGouldMonti.pdf. [Google Scholar]
- 51.Benjamini Y, Hochberg Y. Controlling the false discovery rate: a practical and powerful approach to multiple testing. J Roy Stat Soc B. 1995;57:289–300. [Google Scholar]
- 52.The ENCODE Project Consortium. An integrated encyclopedia of DNA elements in the human genome. Nature. 2012;489:57–74. doi: 10.1038/nature11247. [DOI] [PMC free article] [PubMed] [Google Scholar]
- 53.Matys V, et al. TRANSFAC: transcriptional regulation, from patterns to profiles. Nucleic Acids Res. 2003;31:374–378. doi: 10.1093/nar/gkg108. [DOI] [PMC free article] [PubMed] [Google Scholar]
- 54.Sandelin A, Alkema W, Engström P, Wasserman WW, Lenhard B. JASPAR: an open-access database for eukaryotic transcription factor binding profiles. Nucleic Acids Res. 2004;32:D91–D94. doi: 10.1093/nar/gkh012. [DOI] [PMC free article] [PubMed] [Google Scholar]
- 55.Hallikas O, et al. Genome-wide prediction of mammalian enhancers based on analysis of transcription-factor binding affinity. Cell. 2006;124:47–59. doi: 10.1016/j.cell.2005.10.042. [DOI] [PubMed] [Google Scholar]
- 56.Jolma A, et al. Multiplexed massively parallel SELEX for characterization of human transcription factor binding specificities. Genome Res. 2010;20:861–873. doi: 10.1101/gr.100552.109. [DOI] [PMC free article] [PubMed] [Google Scholar]
- 57.Jolma A, et al. DNA-binding specificities of human transcription factors. Cell. 2013;152:327–339. doi: 10.1016/j.cell.2012.12.009. [DOI] [PubMed] [Google Scholar]
- 58.Wei GH, et al. Genome-wide analysis of ETS-family DNA-binding in vitro and in vivo. EMBO J. 2010;29:2147–2160. doi: 10.1038/emboj.2010.106. [DOI] [PMC free article] [PubMed] [Google Scholar]
- 59.Touzet H, Varré JS. Efficient and accurate P value computation for position weight matrices. Algorithms Mol Biol. 2007;2:15. doi: 10.1186/1748-7188-2-15. [DOI] [PMC free article] [PubMed] [Google Scholar]
- 60.The Cancer Genome Atlas Research. Comprehensive integrative genomic analysis of diffuse lower-grade gliomas. N Engl J Med. 2015;372:2481–2498. doi: 10.1056/NEJMoa1402121. [DOI] [PMC free article] [PubMed] [Google Scholar]
- 61.Li H, et al. The Sequence Alignment/Map format and SAMtools. Bioinformatics. 2009;25:2078–2079. doi: 10.1093/bioinformatics/btp352. [DOI] [PMC free article] [PubMed] [Google Scholar]
- 62.Cowper-Sal lari R, et al. Breast cancer risk–associated SNPs modulate the affinity of chromatin for FOXA1 and alter gene expression. Nat Genet. 2012;44:1191–1198. doi: 10.1038/ng.2416. [DOI] [PMC free article] [PubMed] [Google Scholar]
- 63.Heinz S, et al. Simple combinations of lineage-determining transcription factors prime cis-regulatory elements required for macrophage and B cell identities. Mol Cell. 2010;38:576–589. doi: 10.1016/j.molcel.2010.05.004. [DOI] [PMC free article] [PubMed] [Google Scholar]
- 64.Fuerer C, Nusse R. Lentiviral vectors to probe and manipulate the Wnt signaling pathway. PLoS ONE. 2010;5:e9370. doi: 10.1371/journal.pone.0009370. [DOI] [PMC free article] [PubMed] [Google Scholar]
- 65.Cao L, et al. Independent binding of the retinoblastoma protein and p107 to the transcription factor E2F. Nature. 1992;355:176–179. doi: 10.1038/355176a0. [DOI] [PubMed] [Google Scholar]
- 66.Hallstrom TC, Nevins JR. Specificity in the activation and control of transcription factor E2F-dependent apoptosis. Proc Natl Acad Sci USA. 2003;100:10848–10853. doi: 10.1073/pnas.1831408100. [DOI] [PMC free article] [PubMed] [Google Scholar]
- 67.Lazzerini Denchi E, Helin K. E2F1 is crucial for E2F-dependent apoptosis. EMBO Rep. 2005;6:661–668. doi: 10.1038/sj.embor.7400452. [DOI] [PMC free article] [PubMed] [Google Scholar]
- 68.Dick FA, Dyson N. pRB contains an E2F1-specific binding domain that allows E2F1-induced apoptosis to be regulated separately from other E2F activities. Mol Cell. 2003;12:639–649. doi: 10.1016/s1097-2765(03)00344-7. [DOI] [PubMed] [Google Scholar]
- 69.Coser KR, et al. Antiestrogen-resistant subclones of MCF-7 human breast cancer cells are derived from a common monoclonal drug-resistant progenitor. Proc Natl Acad Sci USA. 2009;106:14536–14541. doi: 10.1073/pnas.0907560106. [DOI] [PMC free article] [PubMed] [Google Scholar]
- 70.Robinson JT, et al. Integrative genomics viewer. Nat Biotechnol. 2011;29:24–26. doi: 10.1038/nbt.1754. [DOI] [PMC free article] [PubMed] [Google Scholar]
Associated Data
This section collects any data citations, data availability statements, or supplementary materials included in this article.
Supplementary Materials
Data Availability Statement
Sequencing data for 360 breast cancers have been deposited in dbGAP (https://www.ncbi.nlm.nih.gov/gap) under accession number phs001250. v1.p1. All other data are available from the corresponding author upon reasonable request.


