Abstract
The N-Myc oncoprotein induces neuroblastoma by regulating gene transcription and consequently causing cell proliferation. Paradoxically, N-Myc is well known to induce apoptosis by upregulating pro-apoptosis genes, and it is not clear how N-Myc overexpressing neuroblastoma cells escape N-Myc-mediated apoptosis. The nuclear zinc finger protein LYAR has recently been shown to modulate gene expression by forming a protein complex with the protein arginine methyltransferase PRMT5. Here we showed that N-Myc upregulated LYAR gene expression by binding to its gene promoter. Genome-wide differential gene expression studies revealed that knocking down LYAR considerably upregulated the expression of oxidative stress genes including CHAC1, which depletes intracellular glutathione and induces oxidative stress. Although knocking down LYAR expression with siRNAs induced oxidative stress, neuroblastoma cell growth inhibition and apoptosis, co-treatment with the glutathione supplement N-acetyl-l-cysteine or co-transfection with CHAC1 siRNAs blocked the effect of LYAR siRNAs. Importantly, high levels of LYAR gene expression in human neuroblastoma tissues predicted poor event-free and overall survival in neuroblastoma patients, independent of the best current markers for poor prognosis. Taken together, our data suggest that LYAR induces proliferation and promotes survival of neuroblastoma cells by repressing the expression of oxidative stress genes such as CHAC1 and suppressing oxidative stress, and identify LYAR as a novel co-factor in N-Myc oncogenesis.
Neuroblastoma is the most prevalent solid tumour in early childhood, and accounts for approximately 15% of all childhood cancer death.1 Amplification of the MYCN oncogene and consequent N-Myc oncoprotein overexpression occur in approximately a quarter of human neuroblastoma tissues, and correlate with poor event-free and overall survival rates in patients.2, 3, 4
Like its counterpart c-Myc, N-Myc oncoprotein induces tumour initiation and promotes tumour progression by regulating gene transcription,5, 6, 7, 8 resulting in incessant cell proliferation. Paradoxically, Myc overexpression can induce apoptosis by upregulating the expression of pro-apoptosis genes such as p53.9, 10 It is not clear how N-Myc overexpressing neuroblastoma cells escape N-Myc-mediated apoptosis.
N-Myc oncoprotein is methylated and stabilized by the protein arginine methyltransferase PRMT5.11 Although PRMT5 promotes MYCN gene-amplified neuroblastoma cell survival,11 the mechanism of action is not clear. The transcription factor LYAR has recently been found to regulate target gene transcription by forming a protein complex with PRMT5,12 and is essential for the survival of embryonic stem cells.13
Here, we investigated the role of LYAR in MYCN overexpressing neuroblastoma cells. We demonstrated that LYAR mRNA and protein expression was increased by N-Myc and that suppression of LYAR induced neuroblastoma cell growth inhibition and apoptosis. Affymetrix microarray experiments were performed to identify LYAR target genes, and the prognostic value of LYAR gene expression in human neuroblastoma tissues was also evaluated.
Results
N-Myc upregulates LYAR gene expression in neuroblastoma cells
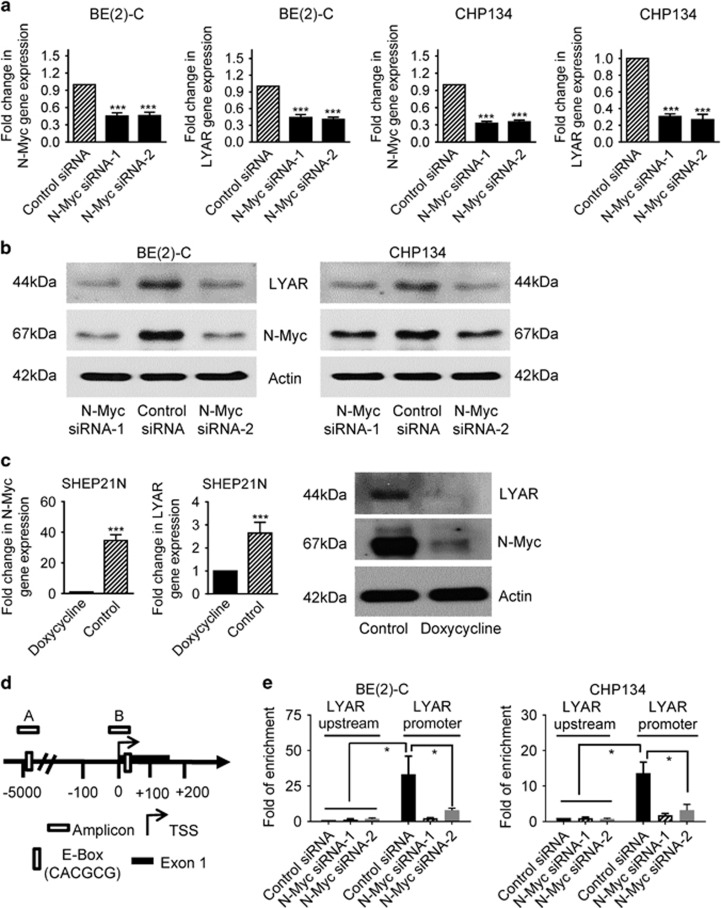
Myc oncoproteins exert oncogenic effects by binding to Myc responsive element E-Boxes at target gene promoters and upregulating target gene transcription.6 As our bioinformatics analysis revealed a Myc responsive element E-Box at the LYAR gene promoter, we examined whether N-Myc regulated LYAR gene expression. As shown in Figure 1, transfection of human MYCN gene-amplified BE(2)-C and CHP134 neuroblastoma cells with two independent N-Myc siRNAs (N-Myc siRNA-1 and N-Myc siRNA-2) significantly reduced N-Myc mRNA and protein expression. RT-PCR and immunoblot analyses confirmed that knocking down N-Myc expression reduced both LYAR mRNA (Figure 1a) and protein (Figure 1b) expression in BE(2)-C and CHP134 cells. We also examined a reciprocal system of SHEP21N cells, which is stably transfected with a doxycycline-repressible N-Myc expression construct. Consistent with the siRNA data, withdrawal of doxycycline from cell culture medium of SHEP21N cells led to LYAR mRNA and protein upregulation, concomitant with N-Myc mRNA and protein overexpression (Figure 1c).
Figure 1.
N-Myc upregulates LYAR expression in neuroblastoma cells by binding to the LYAR gene promoter. (a and b) BE(2)-C and CHP134 cells were transfected with control siRNA, N-Myc siRNA-1 or N-Myc siRNA-2. Seventy-two hours later, RNA and protein were extracted from the cells for RT-PCR (a) and immunoblot (b) analyses of N-Myc and LYAR expression. (c) SHEP21N cells were treated with doxycycline (2 μg/ml) or vehicle control for 72 h. RT-PCR and immunoblot analyses were conducted on N-Myc and LYAR mRNA and protein expression. (d) Schematic representation of the LYAR gene promoter. TSS represented transcription start site. (e) ChIP assays were performed with a control or anti-N-Myc antibody, followed by PCR with primers targeting the negative control region (Amplicon A) or the LYAR gene core promoter containing the Myc responsive element E-Box (Amplicons B) in BE(2)-C and CHP134 cells 24 h after transfection with control siRNA, N-Myc siRNA-1 or N-Myc siRNA-2. Fold enrichment of the LYAR gene promoter was calculated as the difference in PCR cycle thresholds obtained with the anti-N-Myc antibody and with the control antibody. Error bars represented standard errors (S.E.). *P<0.05 and ***P<0.001
We next performed chromatin immunoprecipitation (ChIP) assays to define N-Myc protein binding at the LYAR gene promoter in BE(2)-C and CHP134 cells after transfection with control siRNA, N-Myc siRNA-1 or N-Myc siRNA-2, using an anti-N-Myc antibody or control IgG and PCR with primers targeting the LYAR gene core promoter or a remote negative control region (Figure 1d). The ChIP assays showed that the N-Myc antibody efficiently immunoprecipitated the LYAR gene promoter region, but not the negative control region, in cells transfected with control siRNA, and that transfection with N-Myc siRNA-1 or N-Myc siRNA-2 considerably reduced the amount of LYAR gene promoter region immunoprecipitated by the N-Myc antibody (Figure 1e). Taken together, these data indicate that N-Myc upregulates LYAR gene expression by binding to the LYAR gene promoter.
LYAR is required for neuroblastoma cell proliferation and survival
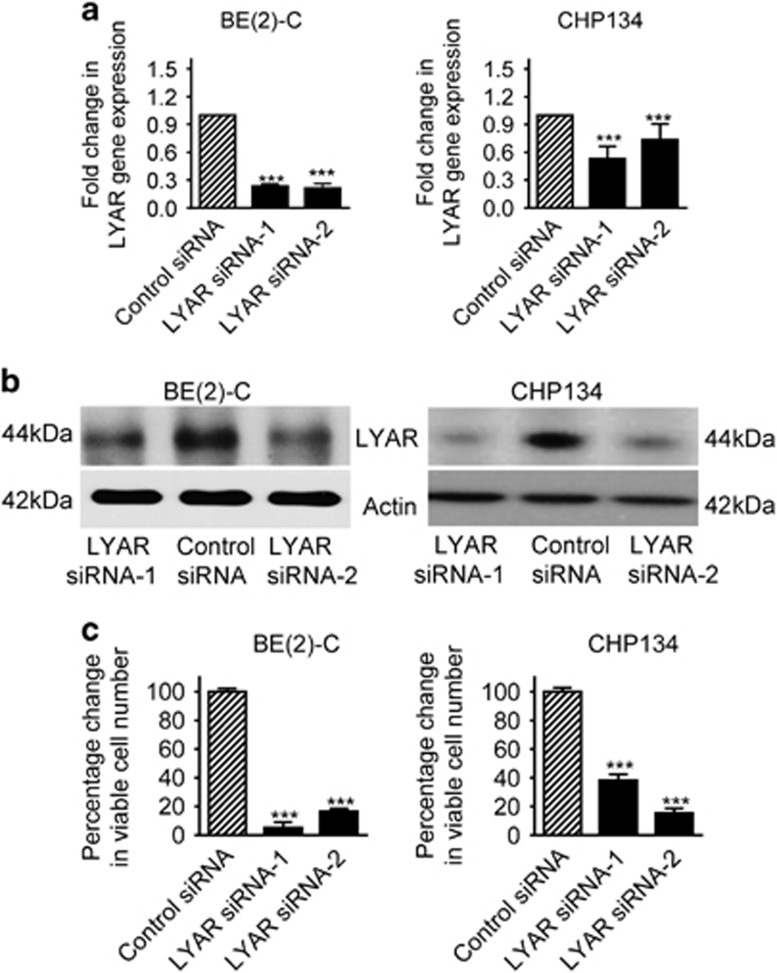
We next examined whether upregulation of LYAR induces neuroblastoma cell proliferation and survival. BE(2)-C and CHP134 MYCN gene-amplified cells were transfected with control siRNA or two independent LYAR siRNAs (LYAR siRNA-1 and LYAR siRNA-2) targeting different regions of LYAR mRNA. RT-PCR and immunoblot analyses showed that transfection with the LYAR siRNAs knocked down LYAR mRNA (Figure 2a) and protein (Figure 2b) expression. Alamar blue assays showed that knocking down LYAR expression with siRNAs considerably decreased the number of viable neuroblastoma cells (Figure 2c). The data suggest that LYAR is required for neuroblastoma cell proliferation and survival.
Figure 2.
LYAR is required for neuroblastoma cell proliferation and survival. (a and b) BE(2)-C and CHP134 cells were transfected with control siRNA, LYAR siRNA-1 or LYAR siRNA-2 for 48 h, followed by RT-PCR and immunoblot analyses of LYAR mRNA (a) and protein (b) expression. (c) BE(2)-C and CHP134 cells were transfected with control siRNA, LYAR siRNA-1 or LYAR siRNA-2 for 96 h, followed by Alamar blue assays. The numbers of viable cells were expressed as percentage changes. Error bars represented S.E. ***P<0.001
LYAR regulates oxidative stress gene expression
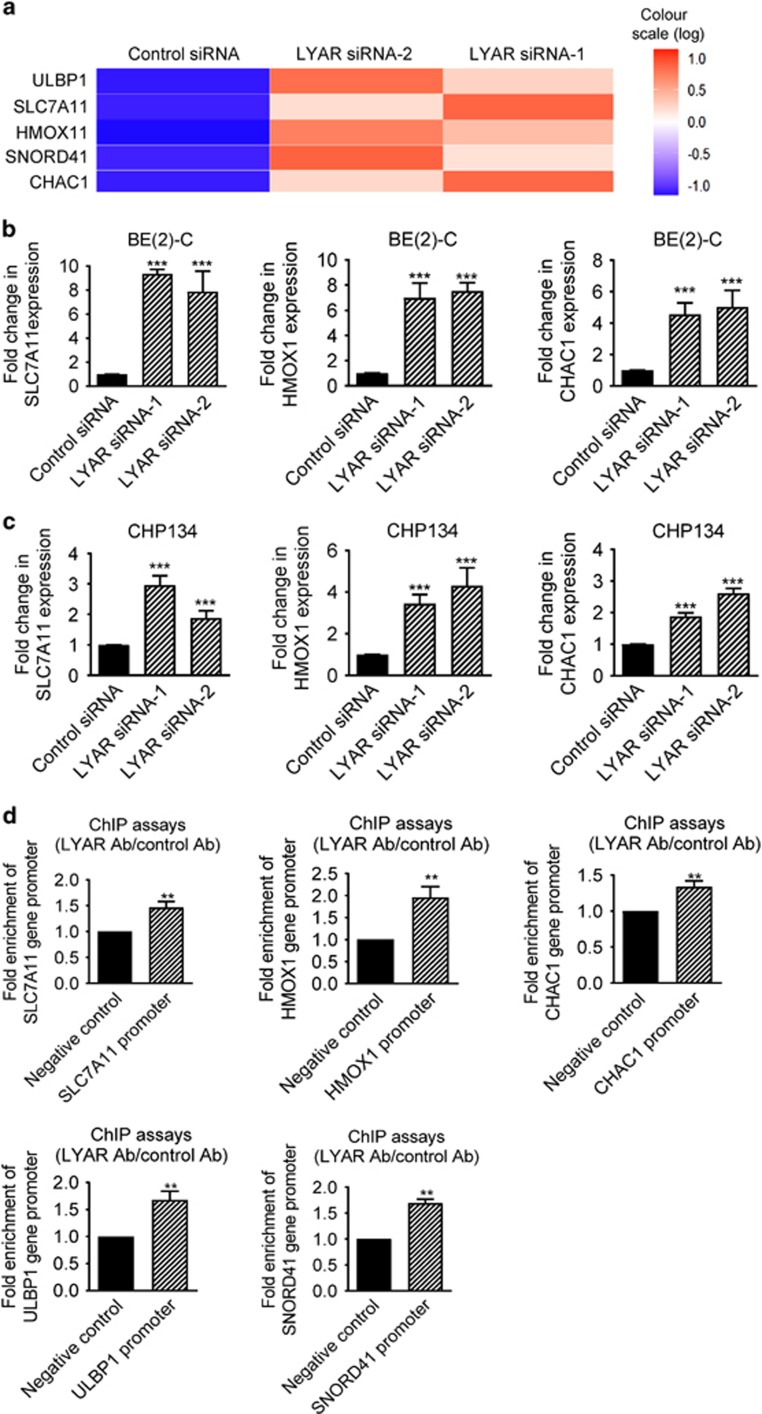
As a transcription factor, LYAR has been shown to repress target gene transcription by forming a protein complex with the protein arginine methyltransferase PRMT5.12 We performed Affymetrix microarray experiments in BE(2)-C cells after transfection with control siRNA, LYAR siRNA-1 or LYAR siRNA-2 for 32 h. Differential gene expression analysis, excluding long noncoding RNAs and pseudogenes with no known functions, uncovered that the most robust gene targets of LYAR knockdown were upregulation of oxidative stress pathway genes: SLC7A11, HMOX1, ULBP1 and CHAC1 (Figure 3a). All genes up- or downregulated by LYAR siRNAs by >1.5-fold, including SNORD41 which was upregulated by >2-fold, were listed in Supplementary Table S1.
Figure 3.
LYAR regulates oxidative stress gene expression. (a) Genome-wide differential gene expression studies were performed with Affymetrix microarray in BE(2)-C cells 32 h after transfection with control siRNA, LYAR siRNA-1 or LYAR siRNA-2. Heatmap showing the genes up- or downregulated by both LYAR siRNA-1 and LYAR siRNA-2 by more than twofold. Noncoding RNAs and pseudogenes that had never been studied were excluded in the heatmap. (b and c) BE(2)-C (b) and CHP134 (c) cells were transfected with control siRNA, LYAR siRNA-1 or LYAR siRNA-2 for 48 h, followed by RNA extraction. RT-PCR analysis of SLC7A11, HMOX1 and CHAC1 was performed. (d) ChIP assays were performed with a control or anti-LYAR antibody (Ab), followed by PCR with primers targeting a negative control region or the SLC7A11, HMOX1, CHAC1, ULBP1 and SNORD41 gene promoter regions in BE(2)-C cells. Fold enrichment of the LYAR target gene promoters was calculated as the difference in cycle thresholds obtained with the anti-LYAR Ab and with the control Ab. Error bars represented S.E. **P<0.01 and ***P<0.001
To validate the microarray data and to examine whether the effect was applicable to other neuroblastoma cell lines, we performed RT-PCR analysis of SLC7A11, HMOX1, ULBP1, SNORD41 and CHAC1 gene expression in BE(2)-C and CHP134 cells after transfection with control siRNA, LYAR siRNA-1 or LYAR siRNA-2. The RT-PCR data showed upregulation of SLC7A11, HMOX1, ULBP1, SNORD41 and CHAC1, after knocking down LYAR in both BE(2)-C and CHP134 cells (Figures 3b, c and Supplementary Figure S1).
As LYAR is known to repress gene transcription by binding to target gene promoters, we next performed ChIP assays in BE(2)-C cells, using an anti-LYAR antibody or control IgG, and PCR with primers targeting a negative control region or the proximal promoter regions of the LYAR target genes SLC7A11, CHAC1, ULBP1, SNORD41 (Supplementary Figure S2) and HMOX1 (as described in ref. 14). The ChIP assays showed that the LYAR antibody efficiently immunoprecipitated the SLC7A11, CHAC1, ULBP1, SNORD41 and HMOX1 gene promoters (Figure 3d). Taken together, these data indicate that LYAR represses the expression of the oxidative stress genes by binding to their gene promoters in human neuroblastoma cells.
Knocking down LYAR reduces neuroblastoma cell proliferation and viability through upregulating CHAC1 expression and inducing oxidative stress
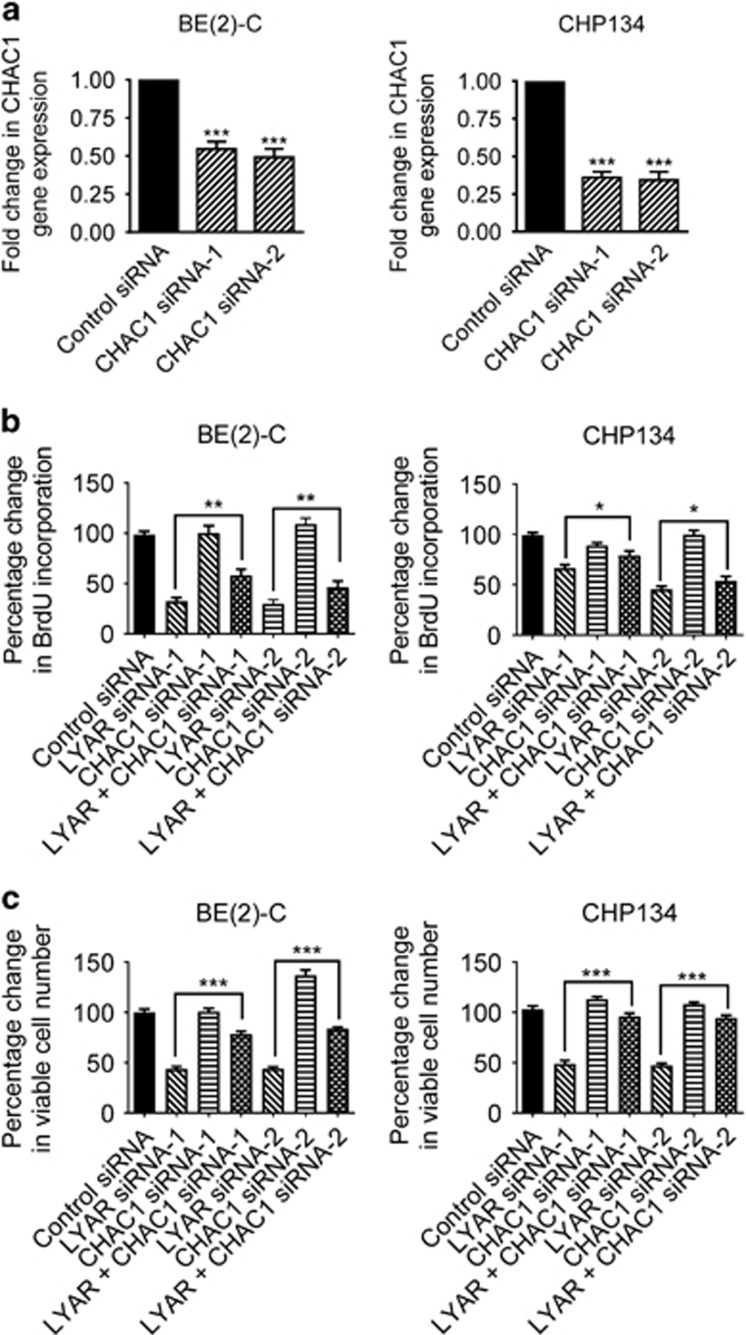
Although SLC7A11 and HMOX1 are well known to be upregulated in response to oxidative stress and to protect cells against apoptosis,15, 16, 17 CHAC1 induces robust depletion of intracellular glutathione and has an important role in oxidative stress-induced apoptosis.18, 19 We therefore examined whether upregulation of CHAC1 is responsible for LYAR siRNA-induced reduction in neuroblastoma cell proliferation and viability. As shown in Figure 4a, transfection with two independent CHAC1 siRNAs, targeting different regions of the mRNA, resulted in CHAC1 gene knockdown. BrdU incorporation assays showed that knocking down LYAR alone, but not CHAC1 alone, considerably reduced BrdU incorporation into BE(2)-C and CHP134 cells. Importantly, co-transfection with CHAC1 siRNA largely blocked LYAR siRNA-mediated reduction in neuroblastoma cell proliferation (Figure 4b). Alamar blue assays showed that knocking down LYAR alone, but not CHAC1 alone, considerably reduced the number of viable neuroblastoma cells. Importantly, co-transfection with CHAC1 siRNA largely blocked LYAR siRNA-mediated reduction in the number of viable BE(2)-C and CHP134 cells (Figure 4c).
Figure 4.
Knocking down LYAR reduces neuroblastoma cell proliferation and viability through upregulating CHAC1 expression. (a) BE(2)-C and CHP134 cells were transfected with control siRNA, CHAC1 siRNA-1 or CHAC1 siRNA-2 for 48 h, followed by RT-PCR analysis of CHAC1 gene expression. (b) BE(2)-C and CHP134 cells were transfected with control siRNA, LYAR siRNA-1, CHAC1 siRNA-1, LYAR siRNA-2, CHAC1 siRNA-2, LYAR siRNA-1 plus CHAC1 siRNA-1, or LYAR siRNA-2 plus CHAC1 siRNA-2 for 72 h, followed by incubation with BrdU for 6 h. BrdU incorporation was measured as optical density units of absorbance, and expressed as percentage changes relative to control siRNA-transfected samples. (c) BE(2)-C and CHP134 cells were transfected with control siRNA, LYAR siRNA-1, CHAC1 siRNA-1, LYAR siRNA-2, CHAC1 siRNA-2, LYAR siRNA-1 plus CHAC1 siRNA-1, or LYAR siRNA-2 plus CHAC1 siRNA-2. Seventy-two hours later, the cells were subjected to Alamar blue assays. The numbers of viable cells were expressed as percentage changes. Error bars represented S.E. *P<0.05, **P<0.01 and ***P<0.001
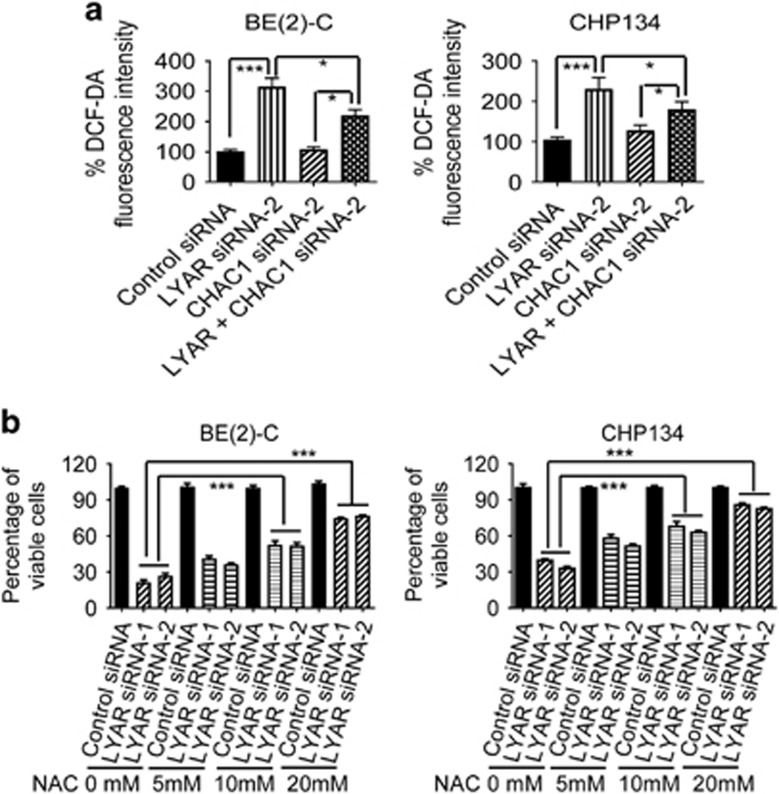
CHAC1 is well-known to exert biological effects through depleting glutathione and therefore inducing oxidative stress.18, 19 We examined whether knocking down LYAR induced oxidative stress, and whether co-suppression of CHAC1 blocked the effect. BE(2)-C cells were transfected with control siRNA, LYAR siRNA-1, CHAC1 siRNA-1 or combination of LYAR siRNA-1 and CHAC1 siRNA-1, and CHP134 cells were transfected with control siRNA, LYAR siRNA-2, CHAC1 siRNA-2 or combination of LYAR siRNA-2 and CHAC1 siRNA-2. Dichlorodihydrofluorescin diacetate (DCFH-DA) assays showed that knocking down LYAR alone, but not CHAC1 alone, considerably induced oxidative stress in BE(2)-C and CHP134 cells. Importantly, co-transfection with CHAC1 siRNA largely blocked LYAR siRNA-mediated oxidative stress in neuroblastoma cells (Figure 5a). Next, BE(2)-C and CHP134 cells were transfected with control siRNA, LYAR siRNA-1 or LYAR siRNA-2, followed by treatment with N-acetyl-l-cysteine (NAC), a cysteine analogue and glutathione supplement.20 Alamar blue assays showed that transfection with LYAR siRNAs considerably reduced the number of viable neuroblastoma cells, that treatment with NAC alone did not have an effect, and that treatment with NAC dose-dependently blocked the effect of LYAR siRNAs in both BE(2)-C and CHP134 cells (Figure 5b). Together, these data indicate that LYAR increases the number of viable neuroblastoma cells through reducing CHAC1 expression and consequently blocking CHAC1-mediated oxidative stress.
Figure 5.
Knocking down LYAR induces oxidative stress through activating CHAC1 expression in neuroblastoma cells. (a) BE(2)-C cells were transfected with control siRNA, LYAR siRNA-1, CHAC1 siRNA-1, or LYAR siRNA-1 plus CHAC1 siRNA-1, and CHP134 cells were transfected with control siRNA, LYAR siRNA-2, CHAC1 siRNA-2, or LYAR siRNA-2 plus CHAC1 siRNA-2. Seventy-two hours later, the cells were incubated with DCFH-DA for oxidative stress assays. Results were calculated according to fluorescence intensity and expressed as percentage changes, adjusted according to the number of cells and relative to control siRNA-transfected cells. (b) BE(2)-C and CHP134 cells were transfected with control siRNA, LYAR siRNA-1 or LYAR siRNA-2, followed by treatment with NAC at 0, 5, 10 or 20 nM. Seventy-two hours later, the cells were subjected to Alamar blue assays. The numbers of viable cells were expressed as percentage changes. Error bars represented S.E. *P<0.05 and ***P<0.001
LYAR induces neuroblastoma cell survival by reducing CHAC1 gene expression
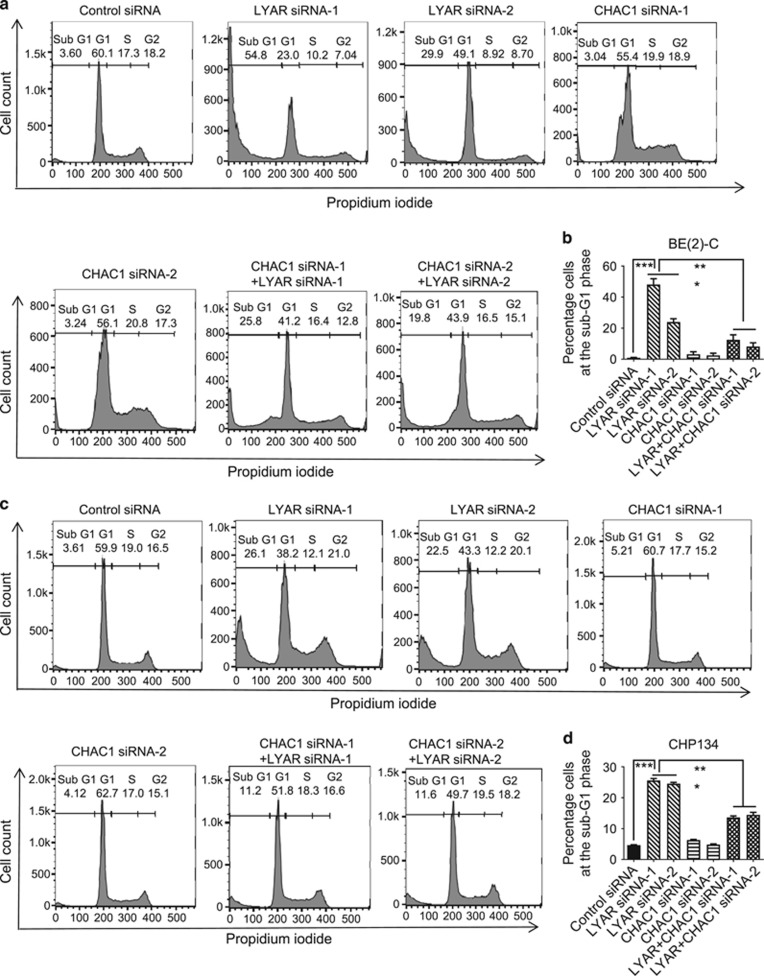
We next used flow cytometry to examine whether LYAR suppresses apoptosis through reducing CHAC1 gene expression. MYCN gene-amplified BE(2)-C and CHP134 cells were transfected with control siRNA, LYAR siRNA-1, LYAR siRNA-2, CHAC1 siRNA-1, CHAC1 siRNA-2, LYAR siRNA-1 plus CHAC1 siRNA-1, or LYAR siRNA-2 plus CHAC1 siRNA-2 for 72 h, followed by staining with propidium iodide (PI). Cell cycle analysis showed that transfection with LYAR siRNAs reduced the percentage of cells at the S phase and increased the percentage of cells at the sub-G1 phase, whereas transfection with CHAC1 siRNAs alone showed no effect. Importantly, co-transfection with CHAC1 siRNAs blocked the effect of LYAR siRNAs in both BE(2)-C and CHP134 cells (Figures 6a–d and Supplementary Figure S3). The data support a mechanism whereby LYAR induces neuroblastoma cell resistance to apoptosis by inhibiting CHAC1 gene expression.
Figure 6.
LYAR induces neuroblastoma cell survival by reducing CHAC1 gene expression. BE(2)-C and CHP134 cells were transfected with control siRNA, LYAR siRNA-1, CHAC1 siRNA-1, LYAR siRNA-2, CHAC1 siRNA-2, LYAR siRNA-1 plus CHAC1 siRNA-1, or LYAR siRNA-2 plus CHAC1 siRNA-2 for 72 h. The cells were then stained with propidium iodide and subjected to flow cytometry analyses of the cell cycle (a–d). The percentage of cells at each phase of the cell cycle was calculated and the percentage of cells at the sub-G1 phase was shown in b for BE(2)-C cells and d for CHP134 cells. Error bars represented standard error. ***P<0.001
High levels of LYAR gene expression in human neuroblastoma tissues independently predict poor event-free and overall survival in patients
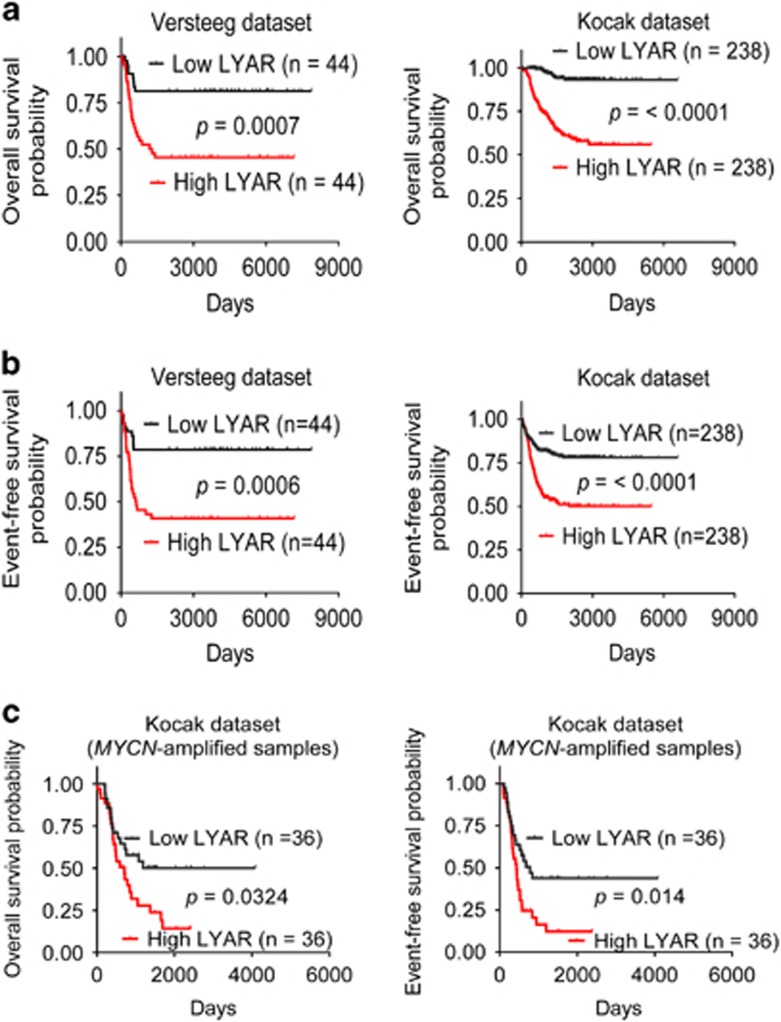
To assess the clinical relevance of LYAR expression in neuroblastoma, we extracted LYAR gene expression and patient prognosis data from the publically available (http://r2.amc.nl) Versteeg21 and Kocak22, 23 microarray gene expression-patient prognosis data sets. Using the median of LYAR gene expression as a cut-off point, Kaplan–Meier analysis showed an association between high levels of LYAR gene expression in neuroblastoma tissues and reduced overall survival (Figure 7a) or event-free survival (Figure 7b), in the Versteeg and Kocak cohorts of 88 patients and 476 patients. In addition, high levels of LYAR gene expression in the 72 MYCN-amplified neuroblastoma tissues were positively associated with poor patient event-free and overall survival in the large Kocak data set (Figure 7c). Importantly, using the median and upper quartile of LYAR gene expression as cut-off points, multivariate Cox regression analysis showed that high levels of LYAR expression in neuroblastoma tissues strongly associated with reduced event-free and overall survival, independent of disease stage, age at the time of diagnosis and MYCN amplification status (Table 1), the current most important prognostic markers for neuroblastoma patients.2
Figure 7.
High levels of LYAR gene expression in neuroblastoma tissues correlate with poor patient prognosis. (a–b) Kaplan–Meier curves showed the probability of overall survival (a) and event-free survival (b) of patients according to the levels of LYAR mRNA expression in 88 and 476 human neuroblastoma samples in the publically available microarray gene expression Versteeg and Kocak data sets downloaded from R2 platform (http://r2.amc.nl). (c) Kaplan–Meier curves showed the probability of patient overall survival and event-free survival according to the levels of LYAR mRNA expression in the 72 MYCN-amplified and 404 MYCN–non-amplified neuroblastoma samples in the Kocak data set
Table 1. Multivariable Cox regression analysis of factors prognostic for outcome in 476 neuroblastoma patientsa.
| Factors |
Event-free survival |
Overall survival |
||
|---|---|---|---|---|
| HR (95% CI) | P-value | HR (95% CI) | P-value | |
| High LYAR expression (median level as the cut-off) | 1.47 (1.00–2.17) | <0.0001 | 3.22 (1.67–6.22) | 0.0005 |
| MYCN amplification | 1.80 (1.21–2.67) | 0.0035 | 2.68 (1.71–4.22) | <0.0001 |
| Age >18 months | 1.72 (1.18–2.52) | 0.0052 | 3.58 (1.98–6.48) | <0.0001 |
| Stages 3 and 4b | 2.50 (1.65–3.79) | <0.0001 | 2.99 (1.49–6.00) | 0.0021 |
| High LYAR expression (upper quartile as the cut-off) | 1.56 (1.03–2.35) | 0.0342 | 1.91 (1.13–3.22) | 0.0162 |
| MYCN amplification | 1.62 (1.05–2.49) | 0.0286 | 2.64 (1.59–4.37) | <0.0001 |
| Age >18 months | 1.67 (1.16–2.49) | 0.0064 | 3.73 (2.06–6.78) | <0.0001 |
| Stages 3 and 4b | 2.50 (1.65–3.78) | <0.0001 | 3.29 (1.64–6.60) | <0.0001 |
The level of LYAR expression was considered high or low in relation to the median or high quartile of expression in all tumours analysed. Hazard ratios were calculated as the antilogs of the regression coefficients in the proportional hazards regression. Multivariate Cox regression analysis was performed following the inclusion of the four above-listed factors into the Cox regression model, and P-value was obtained from two-sided log-rank test.
Tumour stage was categorized as favourable (International Neuroblastoma Staging System stages 1, 2 and 4S) or unfavorable (International Neuroblastoma Staging System stages 3 and 4)
.
Discussion
The N-Myc and c-Myc oncoproteins are well known to modulate gene transcription by direct binding to Myc responsive element E-Boxes at target gene promoters, leading to transcriptional activation.8, 24, 25 In this study, we have identified a canonical E-Box at the LYAR gene core promoter. ChIP assays showed that immunoprecipitation with an anti-N-Myc antibody efficiently immunoprecipitated the LYAR gene core promoter containing the E-Box, and that the enrichment of the LYAR gene core promoter by the anti-N-Myc antibody was blocked in the neuroblastoma cells after N-Myc gene knockdown. RT-PCR and immunoblot analyses showed LYAR upregulation following ectopic N-Myc overexpression and LYAR downregulation following N-Myc gene knockdown. Taken together, the data suggest that N-Myc induces LYAR gene expression by direct binding to its core promoter.
LYAR is a nucleolar and nuclear protein with zinc finger DNA-binding motifs.26 Recent studies have shown that LYAR suppresses gene expression by forming a protein complex with the protein arginine methyltransferase PRMT5.12 In this study, we have performed Affymetrix microarray differential gene expression and RT-PCR validation studies, and found that knocking down LYAR considerably upregulates the expression of genes involved in the oxidative stress pathway including SLC7A11, ULBP1, HMOX1 and CHAC1. As ChIP assays confirm that LYAR protein binds to the SLC7A11, ULBP1, HMOX1 and CHAC1 gene promoters, our data suggest that LYAR represses the oxidative stress gene transcription by binding to their gene promoters.
SLC7A11 gene expression is upregulated in response to oxidative stress, and upregulation of SLC7A11 in tumour cells suppresses oxidative stress and tumour cell death by increasing intracellular cysteine and accelerating the production of glutathione.15, 16 HMOX1 gene expression is also upregulated in response to oxidative stress, and upregulation of HMOX1 in tumour cells blocks oxidative stress-mediated apoptosis, induces tumour cell survival and tumourigenesis (reviewed in ref. 17). Similarly, ULBP1 gene expression is upregulated in tumour cells upon oxidative stress,27 and augments natural killer cell-mediated cytotoxicity of cancer cells.28 By contrast, CHAC1 functions as a γ-glutamyl cyclotransferase to specifically degrade glutathione, and CHAC1 overexpression results in glutathione depletion, oxidative stress and apoptosis.18, 19 In this study, we have found that knocking down LYAR gene expression upregulates SLC7A11, ULBP1, HMOX1 and CHAC1, induces oxidative stress and reduces neuroblastoma cell proliferation and survival, suggesting that LYAR exerts the biological effects mainly through upregulating CHAC1 expression.
Myc oncoproteins are among the most important oncogenes. However, Myc overexpression paradoxically induces apoptosis by promoting the transcription of pro-apoptosis genes such as p53,9, 10 and it is not clear how Myc overexpressing cells escape N-Myc-mediated apoptosis. In this study, we have demonstrated that knocking down CHAC1 gene expression blocks LYAR siRNA-induced oxidative stress, neuroblastoma cell growth inhibition and apoptosis. Consistent with this observation, treatment with the glutathione supplement NAC also blocks LYAR siRNA-induced cytotoxicity. As CHAC1 is well known to deplete cellular glutathione and induce oxidative stress,18, 19 our data suggest that upregulation of LYAR by N-Myc protects neuroblastoma cells against oxidative stress-mediated apoptosis through reducing CHAC1 gene expression. Importantly, we have confirmed that high levels of LYAR gene expression in human neuroblastoma tissues correlates with poor prognosis in two independent cohorts of neuroblastoma patients, independent of disease stage, age at the time of diagnosis and MYCN gene amplification status (Table 1), the current most potent prognostic markers for neuroblastoma patients.2 The human neuroblastoma tissue data further confirm the important role of LYAR in neuroblastoma.
In summary, this study demonstrates that N-Myc upregulates LYAR gene expression by binding to its gene promoter, and that LYAR reduces the expression of oxidative stress genes including SLC7A11, ULBP1, HMOX1 and CHAC1 by binding to their gene promoters. LYAR induces neuroblastoma cell proliferation and survival through suppressing CHAC1-mediated oxidative stress. Importantly, a high level of LYAR gene expression in human neuroblastoma tissues predicts poor event-free and overall survival in patients, independent of well-known markers for poor prognosis. Taken together, our data suggest that LYAR induces proliferation and promotes survival of neuroblastoma cells by reducing the expression of oxidative stress genes such as CHAC1 and reducing oxidative stress, and identify LYAR as a novel co-factor in N-Myc oncogenesis
Materials and methods
Cell culture
Human neuroblastoma BE(2)-C cells were cultured in Dulbecco’s modified Eagle’s medium supplemented with 10% fetal bovine serum. Human neuroblastoma CHP134 cells were cultured in RPMI 1640 medium supplemented with l-glutamine and 10% fetal bovine serum. BE(2)-C were obtained from American Type Culture Collection, and CHP134 cells from European Collection of Authenticated Cell Cultures. The identity of the cell lines was verified by small tandem repeat profiling conducted by at Garvan Institute or Cellbank Australia.
siRNA transfection
The cells were transfected with siRNAs from Qiagen (Qiagen, Hamburg, Germany) using Lipofectamine 2000 reagent (Invitrogen, Carlsbad, CA, USA) with the protocol we had well established.29, 30
Real-time RT-PCR
Gene expression in the neuroblastoma cells was examined by quantitative real-time PCR as we described previously with the expression of β-actin mRNA as loading control.31, 32
Immunoblot analysis
For protein expression analysis by immunoblot, the cells were lysed with RIPA buffer33 containing protease inhibitors and protein was extracted. After gel electrophoresis and western transfer, the membranes were probed with mouse anti-N-Myc (1:1000) and goat anti-LYAR (1:2000; both from Santa Cruz Biotech, CA, USA) antibodies. Protein bands were visualized with SuperSignal (Pierce, Rockford, IL, USA). The membranes were finally re-probed with an antibody against actin (1:10 000; Sigma, St. Louis, MO, USA) as loading control.
Alamar blue assays
Alamar blue assays were performed as we described previously.33 Briefly, the cells were transfected with various siRNAs and/or treated with various concentrations of NAC in 96-well plates. After 72 h, the cells were incubated with Alamar blue (Invitrogen) for 5 h, and the plates were then read on a microplate reader at 570/595 nm. The results were calculated according to the optical density absorbance units and expressed as percentage change in the number of viable cells.
BrdU incorporation assays
The BE(2)-C and CHP134 cells were transfected with control siRNA, LYAR siRNA-1, LYAR siRNA-2, CHAC1 siRNA-1, CHAC1 siRNA-2, LYAR siRNA-1+CHAC1 siRNA-1 or LYAR siRNA-2+CHAC1 siRNA-2 in 96-well plates for 72 h. The cells were then incubated with 5-bromo-2′-deoxyuridine (BrdU; Roche, Penzberg, Germany) for 2 h, fixed and incubated with peroxidase-conjugated anti-BrdU antibody. After washing, the peroxidase substrate containing tetramethyl-benzidine (TMB; Roche) was added and the plates were read on a microplate reader at 405 nm test wavelength and 415 nm reference wavelength. The results were calculated according to the optical density absorbance units and expressed as percentage changes in BrdU incorporation, proportional to the number of proliferating cells.
Cell cycle analysis
The neuroblastoma cells were transfected with different combinations of siRNAs. Seventy-two hours post transfection, the cells were collected and re-suspended at a concentration of 2 × 10⁶ cells/ml in solution containing 2 μg/ml RNase (Sigma) and 50 μg/ml propidium iodide (Sigma). Flow cytometric analysis of the cells was carried out using FACS Calibur machine and FACS Diva software (Becton Dickinson, Bedford, MA, USA). The percentage of cells at each phase of the cell cycle was analysed.
Oxidative stress assays
Dichlorodihydrofluorescin diacetate (DCFH-DA) oxidative stress assays were performed with the OxiSelect Intracellular ROS Assay Kit (Cell Biolabs, San Diego, CA, USA). The BE(2)-C cells were transfected with control siRNA, LYAR siRNA-1, CHAC1 siRNA-1, or LYAR siRNA-1 plus CHAC1 siRNA-1, and CHP134 cells were transfected with control siRNA, LYAR siRNA-2, CHAC1 siRNA-2, or LYAR siRNA-2 plus CHAC1 siRNA-2 in 96-well plates for 72 h. The cells were then incubated with DCFH-DA for 1 h. Fluorescence was measured at 480 nm (excitation) and 530 nm (emission) wavelengths on a microplate reader. The results were calculated according to fluorescence intensity and expressed as percentage changes, adjusted according to the number of cells and relative to control siRNA-transfected cells.
Affymetrix microarray study
The BE(2)-C neuroblastoma cells were transfected with scrambled control siRNA, LYAR siRNA-1 or LYAR siRNA-2 for 32 h. RNA was then extracted from the cells with RNeasy mini kit (Qiagen), and differential gene expression was examined with Affymetrix microarray (Santa Clara, CA, USA). The results from the microarray hybridization were loaded into the statistical software environment R and analysed with Bioconductor packages, as we described previously.34
ChIP assays
For analysing N-Myc protein binding to the LYAR gene promoter, ChIP assays were performed with an anti-N-Myc or control mouse antibody and real-time PCR with primers targeting a remote negative control region or the core promoter region of the LYAR gene with the protocol we have described.29 For analysing LYAR protein binding to its target gene promoters, ChIP assays were performed with an anti-LYAR or control antibody and real-time PCR with primers targeting the negative control region or the SLC7A11, HMOX1, ULBP1, SNORD41 and CHAC1 gene promoters. Fold enrichment of the target gene promoters was calculated as the difference in PCR cycle thresholds obtained with the anti-N-Myc or LYAR antibody and with the control antibody. The sequences of primers used were: 5′-TGAAGCAAGTCTCTAAGAACCCAA-3′ (forward) and 5′-TTCAAATCCTGCCTTTGGCAC-3′ (reverse) for the negative control region; 5′-CCGTTGGCGTCACTTCCAC-3′ (forward) and 5′-AGCTACCTGCCTCTCAGGCT-3′ (reverse) for the LYAR gene promoter; 5′-AGGCTTCTCATGTGGCTGAT-3′ (forward) and 5′-CAAACCAGCTCAGCTTCCTC-3′ (reverse) for the SLC7A11 gene promoter; 5′-GCCGCCACTGAGTATTCCTA-3′ (forward) and 5′-GTTCCTTCCGTTCCTTCCAT-3′ (reverse) for the ULBP1 gene promoter; 5′-CTACCTGCCTGAGCTGATCC-3′ (forward) and 5′-GTCATCAGGGGCTTGAGGT-3′ (reverse) for the SNORD41 gene promoter; 5′- CCCAGTTTCTCCATTTGCTC-3′ (forward) and 5′-CTCTGGGCGTCGTAAACTTC-3′ (reverse) for the CHAC1 gene promoter. The PCR primers for the HMOX gene promoter were from a published paper.14
Statistical analysis
All data for statistical analysis were calculated as mean±standard error. Differences were analysed for significance using ANOVA among groups or unpaired t-test for two groups. A probability value of 0.05 or less was considered significant.
LYAR gene expression in 88 and 476 human neuroblastoma tissues were extracted from the publically available microarray gene expression Versteeg data set and Kocak data set downloaded from the R2 platform (http://r2.amc.nl). Survival analyses were performed according to the method of Kaplan and Meier and two-sided log-rank tests.35 Multivariate survival analysis with Cox regression models were performed, following the inclusion of disease stage, age at the time of diagnosis and N-Myc gene amplification status, the current best known markers for neuroblastoma patient prognosis.4 Probabilities of survival and hazard ratios were provided with 95% confidence intervals.
Acknowledgments
This work was supported by National Health and Medical Research Council project grants (TL) and National Institutes of Health NIH-R00-HL094709 & GM106392 grants (INM). TL is a recipient of an Australian Research Council Future Fellowship and PYL is a recipient of a Cancer Institute New South Wales Early Career Fellowship. Children’s Cancer Institute Australia is affiliated with University of New South Wales and Sydney Children’s Hospital.
Footnotes
Supplementary Information accompanies this paper on Cell Death and Differentiation website (http://www.nature.com/cdd)
Edited by M Deshmukh
The authors declare no conflict of interest.
Supplementary Material
References
- Maris JM. Recent advances in neuroblastoma. N Engl J Med 2010; 362: 2202–2211. [DOI] [PMC free article] [PubMed] [Google Scholar]
- Brodeur GM. Neuroblastoma: biological insights into a clinical enigma. Nat Rev Cancer 2003; 3: 203–216. [DOI] [PubMed] [Google Scholar]
- Gustafson WC, Weiss WA. Myc proteins as therapeutic targets. Oncogene 2010; 29: 1249–1259. [DOI] [PMC free article] [PubMed] [Google Scholar]
- Maris JM, Hogarty MD, Bagatell R, Cohn SL. Neuroblastoma. Lancet 2007; 369: 2106–2120. [DOI] [PubMed] [Google Scholar]
- Fernandez PC, Frank SR, Wang L, Schroeder M, Liu S, Greene J et al. Genomic targets of the human c-Myc protein. Genes Dev 2003; 17: 1115–1129. [DOI] [PMC free article] [PubMed] [Google Scholar]
- Patel JH, Loboda AP, Showe MK, Showe LC, McMahon SB. Analysis of genomic targets reveals complex functions of MYC. Nat Rev Cancer 2004; 4: 562–568. [DOI] [PubMed] [Google Scholar]
- Pelengaris S, Khan M, Evan G. c-MYC: more than just a matter of life and death. Nat Rev Cancer 2002; 2: 764–776. [DOI] [PubMed] [Google Scholar]
- Eilers M, Eisenman RN. Myc’s broad reach. Genes Dev 2008; 22: 2755–2766. [DOI] [PMC free article] [PubMed] [Google Scholar]
- Hermeking H, Eick D. Mediation of c-Myc-induced apoptosis by p53. Science 1994; 265: 2091–2093. [DOI] [PubMed] [Google Scholar]
- Chen L, Iraci N, Gherardi S, Gamble LD, Wood KM, Perini G et al. p53 is a direct transcriptional target of MYCN in neuroblastoma. Cancer Res 2010; 70: 1377–1388. [DOI] [PMC free article] [PubMed] [Google Scholar]
- Park JH, Szemes M, Vieira GC, Melegh Z, Malik S, Heesom KJ et al. Protein arginine methyltransferase 5 is a key regulator of the MYCN oncoprotein in neuroblastoma cells. Mol Oncol 2015; 9: 617–627. [DOI] [PMC free article] [PubMed] [Google Scholar]
- Ju J, Wang Y, Liu R, Zhang Y, Xu Z, Wang Y et al. Human fetal globin gene expression is regulated by LYAR. Nucleic Acids Res 2014; 42: 9740–9752. [DOI] [PMC free article] [PubMed] [Google Scholar]
- Li H, Wang B, Yang A, Lu R, Wang W, Zhou Y et al. Ly-1 antibody reactive clone is an important nucleolar protein for control of self-renewal and differentiation in embryonic stem cells. Stem Cells 2009; 27: 1244–1254. [DOI] [PubMed] [Google Scholar]
- Zhang J, Ohta T, Maruyama A, Hosoya T, Nishikawa K, Maher JM et al. BRG1 interacts with Nrf2 to selectively mediate HO-1 induction in response to oxidative stress. Mol Cell Biol 2006; 26: 7942–7952. [DOI] [PMC free article] [PubMed] [Google Scholar]
- Martin L, Gardner LB. Stress-induced inhibition of nonsense-mediated RNA decay regulates intracellular cystine transport and intracellular glutathione through regulation of the cystine/glutamate exchanger SLC7A11. Oncogene 2015; 34: 4211–4218. [DOI] [PMC free article] [PubMed] [Google Scholar]
- Jiang L, Kon N, Li T, Wang SJ, Su T, Hibshoosh H et al. Ferroptosis as a p53-mediated activity during tumour suppression. Nature 2015; 520: 57–62. [DOI] [PMC free article] [PubMed] [Google Scholar]
- Chau LY. Heme oxygenase-1: emerging target of cancer therapy. J Biomed Sci 2015; 22: 22. [DOI] [PMC free article] [PubMed] [Google Scholar]
- Crawford RR, Prescott ET, Sylvester CF, Higdon AN, Shan J, Kilberg MS et al. Human CHAC1 protein degrades glutathione, and mRNA induction is regulated by the transcription factors ATF4 and ATF3 and a bipartite ATF/CRE regulatory element. J Biol Chem 2015; 290: 15878–15891. [DOI] [PMC free article] [PubMed] [Google Scholar]
- Kumar A, Tikoo S, Maity S, Sengupta S, Sengupta S, Kaur A et al. Mammalian proapoptotic factor ChaC1 and its homologues function as gamma-glutamyl cyclotransferases acting specifically on glutathione. EMBO Rep 2012; 13: 1095–1101. [DOI] [PMC free article] [PubMed] [Google Scholar]
- Franco R, Cidlowski JA. Apoptosis and glutathione: beyond an antioxidant. Cell Death Differ 2009; 16: 1303–1314. [DOI] [PubMed] [Google Scholar]
- Molenaar JJ, Koster J, Zwijnenburg DA, van Sluis P, Valentijn LJ, van der Ploeg I et al. Sequencing of neuroblastoma identifies chromothripsis and defects in neuritogenesis genes. Nature 2012; 483: 589–593. [DOI] [PubMed] [Google Scholar]
- Kocak H, Ackermann S, Hero B, Kahlert Y, Oberthuer A, Juraeva D et al. Hox-C9 activates the intrinsic pathway of apoptosis and is associated with spontaneous regression in neuroblastoma. Cell Death Dis 2013; 4: e586. [DOI] [PMC free article] [PubMed] [Google Scholar]
- Oberthuer A, Juraeva D, Li L, Kahlert Y, Westermann F, Eils R et al. Comparison of performance of one-color and two-color gene-expression analyses in predicting clinical endpoints of neuroblastoma patients. Pharmacogenomics J 2010; 10: 258–266. [DOI] [PMC free article] [PubMed] [Google Scholar]
- Farrell AS, Sears RC. MYC degradation. Cold Spring Harb Perspect Med 2014; 4: a014365. [DOI] [PMC free article] [PubMed] [Google Scholar]
- Luscher B, Vervoorts J. Regulation of gene transcription by the oncoprotein MYC. Gene 2012; 494: 145–160. [DOI] [PubMed] [Google Scholar]
- Su L, Hershberger RJ, Weissman IL. LYAR, a novel nucleolar protein with zinc finger DNA-binding motifs, is involved in cell growth regulation. Genes Dev 1993; 7: 735–748. [DOI] [PubMed] [Google Scholar]
- Hedlund M, Nagaeva O, Kargl D, Baranov V, Mincheva-Nilsson L. Thermal- and oxidative stress causes enhanced release of NKG2D ligand-bearing immunosuppressive exosomes in leukemia/lymphoma T and B cells. PLoS ONE 2011; 6: e16899. [DOI] [PMC free article] [PubMed] [Google Scholar]
- Lopez-Soto A, Folgueras AR, Seto E, Gonzalez S. HDAC3 represses the expression of NKG2D ligands ULBPs in epithelial tumour cells: potential implications for the immunosurveillance of cancer. Oncogene 2009; 28: 2370–2382. [DOI] [PubMed] [Google Scholar]
- Liu PY, Erriquez D, Marshall GM, Tee AE, Polly P, Wong M et al. Effects of a novel long noncoding RNA, lncUSMycN, on N-Myc expression and neuroblastoma progression. J Natl Cancer Inst 2014; 106: dju113. [DOI] [PubMed] [Google Scholar]
- Liu T, Tee AE, Porro A, Smith SA, Dwarte T, Liu PY et al. Activation of tissue transglutaminase transcription by histone deacetylase inhibition as a therapeutic approach for Myc oncogenesis. Proc Natl Acad Sci USA 2007; 104: 18682–18687. [DOI] [PMC free article] [PubMed] [Google Scholar]
- Marshall GM, Gherardi S, Xu N, Neiron Z, Trahair T, Scarlett CJ et al. Transcriptional upregulation of histone deacetylase 2 promotes Myc-induced oncogenic effects. Oncogene 2010; 29: 5957–5968. [DOI] [PubMed] [Google Scholar]
- Marshall GM, Liu PY, Gherardi S, Scarlett CJ, Bedalov A, Xu N et al. SIRT1 promotes N-Myc oncogenesis through a positive feedback loop involving the effects of MKP3 and ERK on N-Myc protein stability. PLoS Genet 2011; 7: e1002135. [DOI] [PMC free article] [PubMed] [Google Scholar]
- Liu T, Liu PY, Tee AE, Haber M, Norris MD, Gleave ME et al. Over-expression of clusterin is a resistance factor to the anti-cancer effect of histone deacetylase inhibitors. Eur J Cancer 2009; 45: 1846–1854. [DOI] [PubMed] [Google Scholar]
- Sun Y, Liu PY, Scarlett CJ, Malyukova A, Liu B, Marshall GM et al. Histone deacetylase 5 blocks neuroblastoma cell differentiation by interacting with N-Myc. Oncogene 2014; 33: 2987–2994. [DOI] [PubMed] [Google Scholar]
- Kaplan EL, Meier P. Nonparametric estimation from incomplete observations. In: Kotz S, Johnson N (eds). Breakthroughs in Statistics. Springer: New York, NY, USA, 1992, pp 319–337. [Google Scholar]
Associated Data
This section collects any data citations, data availability statements, or supplementary materials included in this article.


