

Abstract
In this present work, we characterized the proteomes of pancreatic ductal adenocarcinoma (PDAC) cell line PANC-1 and normal pancreatic duct cells by mass spectrometry using LTQ-Orbitrap and identified more than 1700 proteins from each sample. On the basis of the spectra count label-free quantification approach, we identified a large number of differentially expressed metabolic enzymes and proteins involved in cytoskeleton, cell adhesion, transport, transcription, translation, and cell proliferation as well. The data demonstrated that metabolic pathways were altered in PANC-1, consistent with the Warburg effect. In addition, the comparative MS analysis unveiled anomalous metabolism of glutamine, suggesting that glutamine was largely consumed as a nitrogen donor in nucleotide and amino acid biosynthesis in PANC-1. Our analysis provides a potentially comprehensive picture of metabolism in PANC-1, which may serve as the basis of new diagnostics and treatment of PDAC.
Keywords: mass spectrometry, proteomics, pancreatic ductal adenocarcinoma, metabolism, Warburg effect, glutamine
Graphical abstract
1. INTRODUCTION
Glucose and glutamine are the two molecules catabolized in substantial quantities in both normal and cancer cells because they supply most of the carbon, nitrogen, free energy, and reducing equivalent necessary for cell growth and division.1 Using slices of living tissues, Otto Warburg studied the energy metabolism of a tumor and first reported that cancer cells produced large amounts of lactate even in aerobic condition.2 Since then, the Warburg effect was observed in several tumors in which the cells predominantly produced energy by a high rate of glycolysis followed by lactate fermentation in the cytosol, rather than by a comparatively low rate of glycolysis followed by oxidation of pyruvate in mitochondria like most normal cells, even in the presence of oxygen.3–5 Interestingly, many cultured cancer cells exhibit increased glutamine consumption, and DeBerardinis reported that glioblastoma cells in culture converted as much as 90% of glucose and 60% of glutamine they acquired into lactate or alanine by 13C-nuclear magnetic resonance spectroscopy measurements. The glutamate derived from glutamine was converted to α-ketoglutarate via the activity of glutamate dehydrogenase and was further catabolized into lactate with NADPH production via malic enzyme or was used to produce alanine via the activity of alanine aminotransferase.6 In addition, it has been reported that glutaminase, which converts glutamine to glutamate in the first step of glutaminolysis, was up-regulated in several cancer cells.7 Thus, glutamine’s relevance in tumor cell metabolism has drawn much attention in cancer research since it plays important roles in nucleotide biosynthesis, hexosamine biosynthesis and glycosylation reactions, amino acids synthesis, glutathione production, Krebs cycle substrate, and generation of reducing equivalent such as NADPH.8
Pancreatic cancer is the fourth leading cause of cancer death in the United States and Europe, and the tumor is notoriously resistant to therapy.9,10 In the past decade, mass spectrometry-based approaches have been applied to investigate the proteomes of diseased and normal samples from pancreatic tissues, juice, cell lines, and serum, with the goals of dissecting the abnormal signaling pathways underlying oncogenesis and identifying new biomarkers.11–14 The advantages of cell linses were their easy accessibility and homogeneity, whereas pancreatic cancer tissue specimen was heterogeneous, containing a high percentage of stromal cells, and the yield of duct cells from primary culture of pancreatic cancer tissue was low. Using liquid chromatography coupled to tandem mass spectrometry (LC–MS/MS), we recently characterized the proteome of pancreatic ductal adenocarcinoma (PDAC) cells from a metastatic cell line CFPAC-1, which was derived by differential trypsinization of explant cultures from a metastatic lesion in the liver of a 26 year old caucasian male with cystic fibrosis.15 On the basis of spectra count label-free quantification approach, we successfully identified a large number of differentially expressed metabolic enzymes and demonstrated that metabolic pathways were altered in CFPAC-1, consistent with the Warburg effect.16 Currently, there are a large number of stable pancreatic cancer cell lines that are used by researchers worldwide, derived from various sources such as ascites, primary tumor, and metastasis. Specifically, PANC-1 is a one of the most commonly used primary pancreatic cancer cell line which was started from a human pancreatic carcinoma of ductal cell origin.17 Here, in an effort to systematically reveal protein expression in PANC-1, particularly focusing on the metabolism of glutamine, we performed proteomic analysis of PANC-1 and normal pancreatic duct cells by LC–MS/MS using an LTQ-Orbitrap mass spectrometer. The result illuminates the fundamental metabolic alterations in PANC-1, concurring with observations from CFPAC-1 and provides insight into the biochemical foundation for selective pharmacological probes to perturb these proteins in PDAC.
2. MATERIALS AND METHODS
2.1. Sample Preparation
PANC-1 cells from American Type Culture Collection (ATCC; Manassas, VA) were cultured at 37 °C in Dulbecco modified Eagle’s medium (DMEM) (Invitrogen; Carlsbad, CA) supplemented with 20 mM glutamine, 10% fetal calf serum (FCS), and 40 μg/mL Gentamycin with humidified 5% CO2. The cells were harvested and washed with Hank’s balanced salt solution (Sigma-Aldrich; Saint Louis, MO). The cell pellet was freeze-dried overnight and stored at −80 °C until use. Normal human pancreatic duct cells were obtained by primary culture of pancreatic duct from a single brain death donor under IRB approval (San Raffaele Scientific Institute; Milano, Italy) based on the published method.18 The duct cells were cultured in medium DMEM/F12 (1:1), supplemented with 2 mM glutamine, 10% FCS, 100 U/mL penicillin, and 100 μg/mL streptomycin. Through a period of suspension culture, epithelial cells were enriched while stromal components were reduced to less than 1%, confirmed by FACS analysis with markers for epithelial (ESA, Ca19.9) and fibroblast (CD73, CD105, CD90) phenotype. The PANC-1 cells and normal duct cells were resuspended for 1 h in lysis buffer consisting of Tris/HCl (50 mM, pH 7.4), NaCl (150 mM), Triton X-100 (0.5% w/v), NP-40 (0.5% w/v), 80 mM dithiothreitol (DTT), 10 μL/mL protease inhibitor cocktails (Sigma-Aldrich), 1 mM PMSF, 1 mM Na3VO4 and PhosStop phosphatase inhibitor cocktail (Roche Applied Science; Indianapolis, IN), sonicated for 30 s, and centrifuged at 16000× g for 10 min. The supernatants were precipitated with 4 volume of acetone (Sigma-Aldrich) overnight at − 20 °C and centrifuged at 9000× g for 5 min. The pellets were dried by lyophilization (Heto Drywinner; Birkerod, Denmark) for 2 h.
2.2. Trypsin Digestion and Desalting
The cell pellets were resuspended in 200 μL of 8 M urea, and the protein concentration was measured by Bradford Assay (BioRad; Hercules, CA). The proteins were transferred to a 1.5-mL eppendorf tube, reduced by 10 mM dithiothreitol (DTT) for 30 min at 37 °C, and then alkylated by 50 mM iodoacetamide for 20 min at room temperature. The concentrated urea in the sample was diluted to a final concentration of 2 M, and the proteins were digested by trypsin at 37 °C for 6 h in a buffer containing ammonium bicarbonate (50 mM, pH 9). The digestion mixture was then acidified by adding glacial acetic acid to a final concentration of 2% and desalted by ZipTip (Millipore; Billerica, MA).
2.3. Mass Spectrometry for Peptide Identification
The peptides were analyzed by high sensitive LC–MS/MS using an LTQ-Orbitrap mass spectrometer (Thermo Fisher Scientific; Waltham, MA). The reversed-phase LC column was slurry-packed in-house with 5 μm, 200 Å pore size C18 resin (Michrom BioResources Inc.; Auburn, CA) in a 100 μm i.d × 10 cm long piece of fused silica capillary (Polymicro Technologies; Phoenix, AZ) with a laser-pulled tip. After packing, the new column, the HPLC system (Surveyor MS Pump Plus from Thermo Fisher Scientific) and the LTQ-Orbitrap, were tested by analyzing 100 fmol “Yeast Enolase Standard & Tryptic Digestion” from Michrom Bioresources, Inc. (catalogue number PTD/00001/46) to ensure that stable ESI, desired mass accuracy, peak resolution, peak intensity and retention time could be obtained. Additional iteration was performed to ensure reproducibility. A total of 100 fmol of standard peptide angiotensin I (Ang I) was spiked into the sample as an internal standard. After sample injection, the column was washed for 5 min with mobile phase A (0.1% formic acid), and peptides were eluted using a linear gradient of 0% mobile phase B (0.1% formic acid, 80% acetonitrile) to 50% B in 160 min at 200 nL/minute, then to 100% B in an additional 10 min for the proteomics analysis. Before and after analyzing one sample, the column was washed with HPLC mobile phase B for 30 min, then mobile phase A for 20 min at high flow rate (1 μL/min) to reduce potential carryover. The LTQ-Orbitrap mass spectrometer was operated in a data-dependent mode in which each full MS scan (60000 resolving power) was followed by eight MS/MS scans where the eight most abundant molecular ions were dynamically selected and fragmented by collision-induced dissociation (CID) using a normalized collision energy of 35%. The Dynamic Exclusion Time was 30 s, and the Dynamic Exclusion Size was 200. The “FT master scan preview mode”, “Charge state screening”, “Monoisotopic precursor selection”, and “Charge state rejection” were enabled so that only the 1+, 2+, and 3+ ions were selected and fragmented by CID.
2.4. Mass Spectrometry Data Analysis
Tandem mass spectra collected by Xcalibur (version 2.0.2) were searched against the NCBI human protein database (released in September 2009 with 37391 entries) using SEQUEST (Bioworks software from Thermo Fisher Scientific, version 3.3.1) with full tryptic cleavage constraints, static cysteine alkylation by iodoacetamide, and variable methionine oxidation. Mass tolerance for precursor ions was 5 ppm and mass tolerance for fragment ions was 0.25 Da. The SEQUEST search results of proteomics data were filtered by the criteria “Xcorr versus charge 1.9, 2.2, 3.0 for 1+, 2+, 3+ ions; ΔCn > 0.1; ranked top #1; probability of randomized identification of peptide <0.01”. Confident peptide identifications were determined using these stringent filter criteria for database match scoring followed by manual evaluation of the results. The “false discovery rate (FDR)” was estimated by searching a combined forward-reversed database as described by Elias.19 The SEQUEST search results were exported to Excel files and compared.
3. RESULTS AND DISCUSSION
3.1. LC–MS/MS Analysis of the Proteomes of PANC-1 and Normal Duct Cells
The same amount of proteins (100 μg) from PANC-1 cells and normal duct cells were digested by trypsin and desalted by ZipTip. Twenty micrograms of the extracted peptides per iteration were analyzed by LC–MS/MS using LTQ-Orbitrap, and three iterations were performed for each sample. Common MS normalization was done in order to reduce extraneous variability. Both exogenous control (spiking standard peptide Ang I) and internal controls (peptide from trypsin autolysis, and peptides from housekeeping protein actin) were utilized to ensure that the desired mass accuracy, peak intensity, peak retention time, and reproducible chromatography could be obtained from the two samples. For analyzing complex biological samples by LC–MS/MS, a relatively longer/shallower HPLC gradient is generally applied to improve resolution and acquire more MS2 spectra for protein identification; however, if the gradient is too long, it is challengeable to obtain reproducible elution profiles from multiple samples, and the MS sensitivity will drop due to bigger peak width and lower peak intensity of the eluted peptide.20 Here, we used 160 min gradient, ramping mobile phase B from 0 to 50%, and identified a large number of proteins with highly reproducible elution profiles from the samples (Figure 1). The SEQUEST search results were filtered by stringent criteria as described above and yielded 1547, 1554, and 1569 proteins with 1% FDR from iteration 1, 2, and 3, respectively, in the sample of normal duct cells. A total of 1779 proteins were identified in the sample from the combined three iterations, and among these proteins, 1382 were commonly found in each of the three iterations. In parallel, the SEQUEST search results yielded 1666, 1642, and 1660 proteins with 1% FDR from iteration 1, 2, and 3, respectively, in the sample of PANC-1 cells. A total of 1947 proteins were identified in the sample from the combined three iterations, and among these proteins, 1407 were commonly found in each of the three iterations. Mostly, the abundant proteins have more than 10 spectra counts, the medium-abundance proteins from 2 to 10, and low-abundance proteins less than 2. The newly identified proteins from succeeding iterations were mainly from proteins with spectra count less than 5 (Supporting Information Table 1S, Figure 2). For LC–MS/MS analysis, the mass spectrometer was operated to sequentially select and fragment ions from high-intensity to low-intensity with dynamic exclusion; however, in very complex peptide mixtures the number of ions coeluting can significantly exceed the number of ions for which tandem mass spectra can be acquired. As a result, the high-abundance and medium-abundance proteins would be repeatedly identified from multiple iterations, whereas some low-abundance proteins could not. The result concurred with previous report in shotgun proteomics that randomness was observed in data-dependent acquisitions of peptide ions in complex peptide mixtures and the number of identified proteins was increased somewhat with repeated iterations.21
Figure 1.

Chromatogram of LC–MS/MS analysis of tryptic peptides from normal pancreatic duct and PANC-1 cells. Twenty microgram tryptic peptides and 100 fmol standard peptide Ang I were loaded to C18 capillary column, and the eluted peptides were analyzed by LTQ-Orbitrap. For the first iteration of normal duct sample, the retention time of exogenous control Ang I was 78 min, and the retention times of 4 internal control peptides were 26 min, 42 min, 56 min, and 91 min respectively. Labeled peak A is the peptide IWHHTFYNELR (2+ ion, m/z 758.3766) from actin, gamma 1; peak B is the peptide VAPEEHPVLLTEAPLNPK (2+ ion, m/z 977.5364) from actin, gamma 1; peak C is the peptide LGEHNIDVLEGNEQFINAAK (2+ ion, m/z 1106.0545) from trypsin autolysis; peak D is the peptide LCYVALDFEQEMATAASSSSLEK (2+ ion, m/z 1275.5953) from actin, gamma 1. The mass accuracy of these peptides was within 5 ppm. These peptides were also identified in the second and third iterations of normal duct sample, and in 3 iterations of PANC-1 sample with similar retention times (±2.0 min), indicating that the experimental procedure was reproducible and the MS results could be compared.
Figure 2.

LC–MS/MS analysis of the proteomes of normal duct and PANC-1 cells. (A) Total of 1547, 1554, and 1569 proteins with 1% FDR were identified from iteration 1, 2, and 3, respectively, in the sample of normal duct cells. Among the identified proteins, 91, 79, and 100 were found only in iteration 1, 2, and 3, respectively, but not in the other two iterations; dozens were found in two iterations but not in the other one; 1382 were commonly found in all three iterations. In parallel, a total of 1666, 1642, and 1660 proteins with 1% FDR were identified from iteration 1, 2, and 3, respectively, in the sample of PANC-1. Among the identified proteins, 113, 96, and 124 were found only in iteration 1, 2, and 3, respectively, but not in the other two iterations; dozens were found in two iterations but not in the other one; 1407 were commonly found in all three iterations. (B) Total of 1547, 1679, and 1779 proteins were identified from the first iteration, combined first and second iterations, and combined three iterations, respectively, in the sample of normal duct cell; a total of 1666, 1823, and 1947 proteins were identified from the first iteration, combined first and second iterations, and combined three iterations, respectively, in the sample of PANC-1 cells.
Relative quantitation based on MS2 spectra count has been used to compare the same protein from two samples with similar complexities under identical experimental procedure.16,21,22 Since the obtained MS2 spectra count of each protein could be different through multiple iterations, it may be desirable to use the average spectra count to reduce measurement variability. As shown in Table 1S (Supporting Information), the difference of spectra count from one protein was mostly between 0 and 10 through multiple iterations. The coeffcient of variation (CV), defined as the ratio of standard deviation (SD) of spectra count to average spectra count, was less than 0.2 for most abundant and medium-abundance proteins, but more than 0.5 for some low-abundance proteins whose average spectra counts were less than 2, indicating that the degree of spectra count variation from one iteration to another was relative higher for low-abundance proteins (Supporting Information Figure 1S). Therefore, a great deal of caution should be exercised in assessing the relative quantity of a protein that was identified as low-abundance in both groups. Nevertheless, reliable relative quantitation can be obtained if the protein was identified as low-abundance in one group but high-abundance in another group, or if the protein was identified as high-abundance in both groups but the difference of spectra count was dramatic. We thus performed relative quantitative analysis of these identified proteins from normal duct and PANC-1 cells based on average MS2 spectra count, and confidently revealed a large number of differentially expressed proteins (Table 1S, Supporting Information). Notably, many of these proteins are involved in metabolism (Tables 1 and 2).
Table 1.
Partial List of Up-regulated Metabolic Proteins in PANC-1
| proteins | functional annotationa | accession number | average spectra count | |
|---|---|---|---|---|
|
| ||||
| normal duct | PANC-1 | |||
| pyruvate kinase, muscle isoform M1 | glycolysis | 33286420 | 39.0 | 100.0 |
| pyruvate kinase, muscle isoform M2 | glycolysis | 33286418 | 20.3 | 76.7 |
| enolase 2 | glycolysis | 5803011 | 61.0 | 271.0 |
| L-lactate dehydrogenase B | pyruvate fermentation | 4557032 | 2.7 | 45.7 |
| glucose-6-phosphate dehydrogenase isoform b | pentose phosphate pathway | 108773793 | 1.3 | 41.0 |
| ATP citrate lyase isoform 1 | fatty acid synthesis | 38569421 | 3.7 | 24.0 |
| fatty acid synthase | fatty acid synthesis | 41872631 | 5.0 | 125.0 |
| acyl-CoA thioesterase 7 isoform hBACHa | fatty acid metabolism | 75709208 | 0.0 | 5.7 |
| CTP synthase | pyrimidine biosynthesis | 148491070 | 0.0 | 36.0 |
| uridine monophosphate synthase | pyrimidine biosynthesis | 4507835 | 0.3 | 4.3 |
| phosphoribosylglycinamide formyltransferase | purine synthesis | 209869993 | 2.0 | 9.0 |
| adenylosuccinate lyase isoform a | purine synthesis | 4557269 | 0.0 | 4.3 |
| 5-aminoimidazole-4-carboxamide ribonucleotide formyltransferase | purine synthesis | 20127454 | 5.0 | 28.3 |
| inosine monophosphate dehydrogenase 2 | purine synthesis | 66933016 | 2.0 | 12.3 |
| phosphoribosylformylglycinamidine synthase | purine metabolism | 31657129 | 0.0 | 6.7 |
| guanine monophosphate synthetase | purine metabolism | 4504035 | 3.3 | 15.7 |
| hypoxanthine phosphoribosyltransferase 1 | purine salvage | 4504483 | 0.0 | 16.0 |
| acetyl-Coenzyme A acetyltransferase 2 | mevalonate pathway | 148539872 | 0.0 | 8.3 |
| 24-dehydrocholesterol reductase precursor | cholesterol synthesis | 13375618 | 0.0 | 4.0 |
| ornithine aminotransferase precursor | proline synthesis | 4557809 | 0.0 | 14.0 |
| phosphoserine aminotransferase 1 isoform 2 | serine synthesis | 10863955 | 0.0 | 6.7 |
| methylenetetrahydrofolate dehydrogenase 1 | one carbon metabolism | 222136639 | 1.0 | 14.7 |
| methylenetetrahydrofolate dehydrogenase 2 | one carbon metabolism | 94721354 | 0.0 | 5.7 |
| carnitine palmitoyltransferase 1A liver isoform 1 | fatty acid metabolism | 73623030 | 0.0 | 4.0 |
| UDP-glucose dehydrogenase | nucleotide-sugar synthesis | 4507813 | 12.0 | 37.0 |
| UDP-N-acetylglucosamine pyrophosphorylase 1 | nucleotide-sugar synthesis | 156627575 | 0.3 | 12.3 |
| UDP-N-acetylglucosamine-2-epimerase/N-acetylmannosamine kinase isoform 2 | N-acetylneuraminic acid biosynthesis | 4885285 | 0.0 | 3.0 |
Functional annotation is based on Protein Knowledgebase at http://www.uniprot.org.
Table 2.
Partial List of Down-regulated Metabolic Proteins in PANC-1
| proteins | functional annotationa | accession number | average spectra count | |
|---|---|---|---|---|
|
| ||||
| normal duct | PANC-1 | |||
| liver phosphofructokinase | glycolysis | 48762920 | 11.3 | 0.0 |
| phosphoglycerate kinase 2 | glycolysis | 31543397 | 11.0 | 2.3 |
| pyruvate dehydrogenase (lipoamide) beta | Krebs cycle | 156564403 | 14.0 | 5.3 |
| aconitase 1 | Krebs cycle | 8659555 | 14.3 | 3.7 |
| aconitase 2, mitochondrial precursor | Krebs cycle | 4501867 | 31.7 | 3.7 |
| isocitrate dehydrogenase 2 (NADP+), mitochondrial precursor | Krebs cycle | 28178832 | 38.7 | 3.3 |
| succinate-CoA ligase, GDP-forming beta subunit precursor | Krebs cycle | 157779135 | 12.7 | 4.3 |
| succinate dehydrogenase complex, subunit A, flavoprotein precursor | Krebs cycle | 156416003 | 22.0 | 4.3 |
| succinate NADH dehydrogenase complex, subunit B, iron sulfur (Ip) precursor | Krebs cycle | 115387094 | 4.7 | 0.0 |
| dihydrolipoamide S-succinyltransferase (E2 component of 2-oxo-glutarate complex) | Krebs cycle | 19923748 | 9.0 | 2.3 |
| dehydrogenase (ubiquinone) Fe–S protein 1, 75 kDa precursor | oxidative phosphorylation | 33519475 | 15.0 | 0.7 |
| NADH dehydrogenase (ubiquinone) Fe–S protein 4 precursor | oxidative phosphorylation | 4505369 | 4.0 | 0.0 |
| ubiquinol-cytochrome c reductase core protein II | oxidative phosphorylation | 50592988 | 26.7 | 6.0 |
| cytochrome c oxidase subunit VIIc precursor | oxidative phosphorylation | 4502993 | 3.0 | 0.0 |
| ATP synthase, H+ transporting, mitochondrial F0 complex, subunit F6 isoform a precursor | oxidative phosphorylation | 18644883 | 7.3 | 0.7 |
| ATP synthase, H+ transporting, mitochondrial F1 complex, alpha subunit precursor | oxidative phosphorylation | 4757810 | 60.7 | 24.3 |
| ATP synthase, H+ transporting, mitochondrial F1 complex, gamma subunit isoform H (heart) precursor | oxidative phosphorylation | 4885079 | 4.7 | 1.0 |
| mitochondrial ATP synthase, O subunit precursor | oxidative phosphorylation | 4502303 | 20.3 | 10.3 |
| acyl-Coenzyme A dehydrogenase, very long chain isoform 2 precursor | fatty acid β -oxidation | 76496475 | 33.3 | 6.0 |
| mitochondrial trifunctional protein, alpha subunit precursor | fatty acid β -oxidation | 20127408 | 45.0 | 10.3 |
| L-3-hydroxyacyl-Coenzyme A dehydrogenase precursor | fatty acid β -oxidation | 94557308 | 15.3 | 5.3 |
| acetyl-Coenzyme A acyltransferase 1 isoform a | fatty acid β -oxidation | 4501853 | 5.3 | 0.0 |
| acetyl-coenzyme A acyltransferase 2 | fatty acid β -oxidation | 167614485 | 25.7 | 1.0 |
| nicotinamide nucleotide transhydrogenase | NADPH generation | 122939155 | 11.7 | 1.7 |
| UDP-glucose pyrophosphorylase 2 isoform a | glycogenesis | 48255966 | 4.7 | 0.3 |
| fructose-1,6-bisphosphatase 1 | gluconeogenesis | 189083692 | 10.7 | 0.0 |
| aldo-keto reductase family 1, member C2 | steroid metabolism | 4503285 | 11.3 | 0.0 |
| aldehyde dehydrogenase 1A1 | retinol metabolism | 21361176 | 44.7 | 0.0 |
| aldehyde dehydrogenase 1A3 | retinol metabolism | 153266822 | 9.0 | 0.0 |
| argininosuccinate synthetase 1 | arginine biosynthesis | 53759107 | 5.0 | 0.0 |
| nicotinamide phosphoribosyltransferase precursor | NAD+ biosynthesis | 5031977 | 33.3 | 5.7 |
| nicotinate phosphoribosyltransferase domain containing 1 | NAD+ biosynthesis | 194394158 | 4.7 | 0.0 |
| cytochrome b5 reductase 3 isoform s | steroid biosynthesis | 6552328 | 22.0 | 5.3 |
| L-arginine:glycine amidinotransferase precursor | creatine biosynthesis | 4503933 | 28.3 | 0.0 |
| monoamine oxidase A | catecholamine metabolism | 4557735 | 13.7 | 0.0 |
| quinoid dihydropteridine reductase | tetrahydrobiopterin biosynthesis | 208973246 | 5.3 | 0.0 |
| delta-aminolevulinic acid dehydratase | heme biosynthesis | 189083849 | 4.7 | 0.0 |
| pyridoxine 5′-phosphate oxidase | pyridoxine biosynthesis | 8922498 | 3.7 | 0.0 |
| 3-hydroxy-3-methylglutaryl CoA lyase | leucine degradation | 62198232 | 3.0 | 0.0 |
| adenylate kinase 1 | ATP/ADP ratio | 4502011 | 20.0 | 0.7 |
| adenylate kinase 3 | ATP/ADP ratio | 19923437 | 8.3 | 0.0 |
| carbonic anhydrase II | CO2 conversion | 4557395 | 32.7 | 0.0 |
Functional annotation is based on Protein Knowledgebase at http://www.uniprot.org.
3.2. The Warburg Effect in PANC-1
In glycolysis, pyruvate kinase (PK) catalyzes the dephosphorylation of phosphoenolpyruvate to pyruvate, and is responsible for net energy production within the glycolytic pathway; L-lactate dehydrogenase (LDH) converts pyruvate to lactate when oxygen is absent or in short supply, and the enzymes are homo or hetero tetramers composed of M and H protein subunits encoded by the LDHA and LDHB genes respectively.1 Here, we identified both pyruvate kinase, muscle isoform M1 from normal duct cells with 39.0 average spectra counts, PANC-1 cells with 100.0, and isoform M2 from normal duct cells with 20.3 average spectra counts, PANC-1 cells with 76.7, indicating that both isoforms were moderately increased in PANC-1. Separately, LDH subunit M (L-lactate dehydrogenase A) was identified from normal duct cells with 51.0 average spectra counts, PANC-1 cells with 79.7, whereas LDH subunit H (L-lactate dehydrogenase B) was identified from normal duct cells with 2.7 average spectra counts, PANC-1 cells with 45.7, indicating that subunit M level may be slightly up-regulated in PANC-1, but subunit H was eminently increased in PANC-1. Interestingly, enolase 2 (ENO2), also known as gamma-enolase or neuron specific enolase,23 was identified from normal duct cells with 61.0 average spectra counts, PANC-1 with 271.0, indicating that the enzyme was greatly elevated in PANC-1 cells.
In mitochondrion, Krebs cycle and oxidative phosphorylation are essential metabolic pathways that converts carbohydrates, fats, and proteins to carbon dioxide and water to generate adenosine triphosphate (ATP) for intracellular energy transfer with the consumption of oxygen.1 Importantly, our comparative analysis showed that several enzymes in Krebs cycle, such as aconitase, isocitrate dehydrogenase 2 (NADP+), succinate-CoA ligase, succinate dehydrogenase, and the components of oxidative phosphorylation, such as NADH dehydrogenase, ubiquinol-cytochrome c reductase, cytochrome c oxidase, ATP synthase, were anomalous and down-regulated in PANC-1. In addition, the protein level of several enzymes involved in fatty acid β-oxidation in mitochondrion was reduced, whereas the ATP citrate lyase and the fatty acid synthase (FAS), the enzymes involved in fatty acid synthesis, were rigorously escalated in PANC-1. NADPH is needed for fatty acid synthesis, and NADPH can be produced either from the pentose phosphate pathway in the cytosol or by nicotinamide nucleotide transhydrogenase (NNT) in mitochondrion in normal cells.1 Since the glucose-6-phosphate dehydrogenase isoform b, the enzyme catalyzing the first and rate-limiting reaction in the pentose phosphate pathway, was abundantly expressed in PANC-1, while NNT was abated, the majority of NADPH was likely acquired from the pentose phosphate pathway for fatty acid synthesis in PANC-1. Hence, these data demonstrated that the prominent function of mitochondrion was severely altered and there was a shift in energy production in PANC-1, consistent with the observed Warburg effect. Some of these proteins and their roles in metabolic pathways are presented schematically in Figure 3.
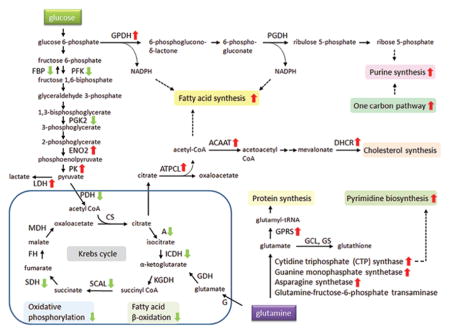
Figure 3.

Schematic illustration of up and down-regulated metabolic proteins in PANC-1 cells. Several enzymes for Krebs cycle, oxidative phosphorylation, and fatty acid β-oxidation pathways were down-regulated (green arrow), and enzymes for pyruvate fermentation, pentose phosphate pathway, fatty acid synthesis, protein synthesis, purine synthesis, pyrimidine synthesis, and cholesterol synthesis were up-regulated (red arrow). Abbreviations: FBP, fructose-1,6-bisphosphatase; PFK, phosphofructokinase; PGK2, phosphoglycerate kinase 2; ENO2, enolase 2; PK, pyruvate kinase; LDH, L-lactate dehydrogenase; PDH, pyruvate dehydrogenase; A, aconitase; ICDH, isocitrate dehydrogenase; SCAL, succinate-CoA ligase; SDH, succinate dehydrogenase; FH, fumarate hydratase; MDH, malate dehydrogenase; GPDH, glucose-6-phosphate dehydrogenase; PGDH, phosphogluconate dehydrogenase; ATPCL, ATP citrate lyase; ACAAT, acetyl-Coenzyme A acetyltransferase; DHCR, 24-dehydrocholesterol reductase; G, glutaminase; GDH, glutamate dehydrogenase; GPRS, glutamyl-prolyl tRNA synthase; GCL, glutamate-cysteine ligase; GS, glutathione synthetase.
As shown in Tables 1 and 2, several more metabolic proteins were up-regulated involved in cholesterol synthesis, purine and pyrimidine synthesis, nucleotide-sugar synthesis, mevalonate pathway, and one carbon metabolism, and down-regulated involved in glycogenesis, gluconeogenesis, creatine biosynthesis, heme biosynthesis, and energy homeostasis, etc. The results described in the current study uncovered a previously unappreciated diversity and quantity of metabolism alteration in PANC-1 besides the Warburg effect.
3.3. Glutamine Metabolism in PANC-1 Cells
It is well-known that some cancer cell lines display addiction to glutamine despite the fact that glutamine is a nonessential amino acid that can be synthesized from glucose.24 We next sought to investigate whether the enzymes involved in glutamine metabolism were differentially expressed in normal duct and PANC-1 cells. Indeed, our proteomic analysis identified several enzymes involved in glutamine metabolism (Table 3). Glutaminase, which generates glutamate from glutamine (Figure 2S, Supporting Information), was identified from normal duct and PANC-1 cells with 2.7 and 6.7 average spectra counts, respectively, indicating that glutaminase was likely moderately increased in PANC-1; glutamine-fructose-6-phosphate transaminase 2 (GFPT2), which is involved in glucosamine biosynthesis and glycosylation, was identified from normal duct and PANC-1 cells with the same 2.0 average spectra counts, indicating that GFPT2 was not considerably changed in PANC-1. Separately, three other enzymes that use glutamine as substrates, cytidine triphosphate (CTP) synthase, guanine monophosphate synthetase, and asparagines synthetase, were found to be sharply up-regulated in PANC-1. Particularly, 36.0 average spectra counts were matched to CTP synthase in PANC-1, and zero in normal duct cells, indicating that CTP synthase was extremely overexpressed in PANC-1 (Figure 3S, Supporting Information). The enzyme interconverts uridine triphosphate (UTP) and CTP, and catalyzes the last committed step in pyrimidine nucleotide biosynthesis.1 Up-regulated CTP synthase activity has been widely seen in human and rodent tumors, and the glutamine analog DON has been used as an anticancer agent by acting as an irreversible inhibitor.25,26 Furthermore, glutamyl-prolyl tRNA synthase (GPRS), a bifunctional aminoacyl-tRNA synthetase that catalyzes the aminoacylation of glutamate and proline tRNA species,27 was identified from normal duct and PANC-1 cells with 7.3 and 35.7 average spectra counts, respectively, indicating that GPRS level was strikingly increased in PANC-1 cells (Figure 4S, Supporting Information). In contrast, glutamate dehydrogenase 1 (GDH1), which converts glutamate to α-ketoglutarate in mitochondria, and the two enzymes involved in glutathione synthesis, gamma-glutamylcysteine synthetase and glutathione synthetase, were identified in PANC-1 without apparent up-regulation. Notably, the enzyme alanine aminotransferase (or named glutamicpyruvate transaminase), which catalyzes the production of alanine from glutamate, was not identified in our MS analysis, indicating that the abundance of this enzyme was low in cells and no significant change could be detected. Taken together, these proteomic data demonstrated that the glutamine metabolism was altered in PANC-1, and the glutaminolysis could be different from that observed in glioblastoma cells (Figure 3).6 It is likely that the high rate of glutamine uptake in PANC-1 resulted from its role as a nitrogen donor in nucleotide and amino acid biosynthesis to meet the need of fast growing cancer cells, and it is less likely that the excessive glutamine was primarily consumed as mitochondrial substrate for NADPH production since down-regulation of Krebs cycle enzymes and nicotinamide nucleotide transhydrogenase was observed in PANC-1.
Table 3.
Partial List of Identified Proteins Involved in Glutamine Metabolism
| proteins | functional annotationa | accession number | average spectra count | |
|---|---|---|---|---|
|
| ||||
| normal duct | PANC-1 | |||
| Glutaminase | glutamine catabolism | 156104878 | 2.7 | 6.7 |
| glutamine-fructose-6-phosphate transaminase 2 | UDP-N-acetyl-alpha-D-glucosamine biosynthesis | 4826742 | 2.0 | 2.0 |
| glutamyl-prolyl tRNA synthase | aminoacyl-tRNA synthetase | 62241042 | 7.3 | 35.7 |
| glutamate dehydrogenase 1 | glutamate catabolism | 4885281 | 22.7 | 16.0 |
| glutamate-cysteine ligase (gamma-glutamylcysteine synthetase) regulatory protein | glutathione biosynthesis | 4504011 | 0.0 | 1.7 |
| glutathione synthetase | glutathione biosynthesis | 4504169 | 1.3 | 0.3 |
| CTP synthase | pyrimidine biosynthesis | 148491070 | 0.0 | 36.0 |
| guanine monophosphate synthetase | purine metabolism | 4504035 | 3.3 | 15.7 |
| asparagine synthetase | asparagines biosynthesis | 168229248 | 0.3 | 9.7 |
Functional annotation is based on Protein Knowledgebase at http://www.uniprot.org.
3.4. Other Proteins in PANC-1 cells
In addition to metabolic enzymes, our study unveiled many other aberrantly expressed proteins involving in cytoskeleton, cell adhesion, transport, transcription, translation, and cell proliferation (Tables 1S, 2S and 3S, Supporting Information). Particularly, many translation initiation and elongation factors, aminoacyl-tRNA synthetases, and subunits of ribosome, were exceedingly up-regulated in PANC-1, implicating active protein synthesis in PANC-1. On the other hand, several proteins secreted by pancreas, such as regenerating islet-derived 1 alpha, regenerating islet-derived 3 alpha, glucagon preproprotein, carboxypeptidase A1, carboxypeptidase B1, elastase 3A, and chymotrypsin B2 were diminished in PANC-1. Interestingly, the average spectra count of retinol binding protein 1 (RBP1) from normal duct cells was 8.3, but zero from PANC-1, indicating that this protein was dropped in PANC-1. RBP1 is the carrier protein involved in the transport of retinol (vitamin A alcohol) from the liver storage site to peripheral tissue, and loss of RBP1 was associated with the development of endometrial cancer.28 Separately, the average spectra count of selenium binding protein 1 (SBP1) from normal duct and PANC-1 was 19.0 and 0.3, respectively, indicating that this protein was also lessened in PANC-1. Selenium is an essential nutrient that exhibits potent anticarcinogenic properties, and reduced expression of SBP1 has been reported in some human cancers.29,30
Intriguingly, several lysosomal proteases, such as cathepsin D, cathepsin H, hexosaminidase B, dipeptidyl peptidase 7, acid alpha-glucosidase, alpha-N-acetylgalactosaminidase, galactosidase, sialate O-acetylesterase, and aspartylglucosaminidase, were decreased in PANC-1, implicating that lysosome was impaired in PANC-1. Lysosomes are cellular organelles that contain acid hydrolase enzymes to break down waste materials and cellular debris. It has been proposed that the increased expression and altered trafficking of lysosomal enzymes in cancer cells participated in tissue invasion.31–33 For instance, the aspartic protease cathepsin D has been found to be overexpressed and secreted at high levels by human epithelial breast cancer cells, and the protein has been used as a marker of poor prognosis in breast cancer.34 Thus, our comparative analysis of lysosomal enzymes in PANC-1 was discrepant from the observations in several other cancers.
It has been reported that K-RAS gene mutation was a cause of several cancers, including pancreatic cancer;35 however, the protein GTPase KRas was not identified in either normal duct or PANC-1 cells, indicating that its protein concentration was too low to be detected by MS in this study, and verification of protein mutation in PANC-1 by MS could not be achieved. It also has been reported that hypoxia-inducible factor-1 (HIF-1) functioned as a master transcriptional regulator of the adaptive response to hypoxia. Under hypoxic conditions, HIF-1 activated the transcription of over 40 genes, including erythropoietin, glucose transporters, glycolytic enzymes, and other genes whose protein products increase oxygen delivery or facilitate metabolic adaptation or hypoxia.36,37 Unfortunately, HIF-1 was not identified in this study either, designating its low abundance in the samples. On the other hand, a protein named hypoxia up-regulated 1 (accession number 5453832) was characterized to be up-regulated in PANC-1. This protein has a pivotal role in cytoprotective cellular mechanisms triggered by oxygen deprivation and may play a role as a molecular chaperone to participate in protein folding.38
3.5. Discussion
Collectively, our MS analysis revealed a global change of PANC-1 proteome, including a large number of differentially expressed metabolic proteins which have been found in our previous MS analysis of CFPAC-1 cells.16 We see many of the same alterations in metabolic regulating enzymes that specifically point to changes in aerobic to anaerobic respiration in pancreatic cancer, consistent with Warburg effect. The result supports the hypothesis that, in rapidly growing solid tumor, oxygen level is low due to poor vascularization, and hypoxia promotes PDAC cells to reprogram metabolic pathways through the pyruvate fermentation, the Krebs cycle, and oxidative phosphorylation deviation in order to minimize the oxygen consumption. As a result, the oxidative stress in pancreatic cancer cells was lower than that of normal duct cells, and the tumor cells expressed less antioxidant proteins, such as manganese superoxide dismutase, superoxide dismutase 1, peroxiredoxin 2, glutathione reductase, and glutathione transferase, due to cell’s adaptation to low-oxygen environment (Table 4). The preliminary findings from this proteomic analysis, as usual, require further investigations to determine their relevant roles in the PDAC cells in vivo and validation of the differences observed, since the cell culture condition does not always reflect the tumor microenvironment and data obtained with cell lines may not be representative of primary samples.
Table 4.
Partial List of Identified Proteins Involved in Oxidative Stress
| proteins | functional annotationa | accession number | average spectra count | |
|---|---|---|---|---|
|
| ||||
| normal duct | PANC-1 | |||
| manganese superoxide dismutase isoform A precursor | radicals removal | 67782305 | 175.0 | 0.3 |
| superoxide dismutase 1, soluble | radicals removal | 4507149 | 10.3 | 3.0 |
| peroxiredoxin 2 isoform a | antioxidant | 32189392 | 12.0 | 0.0 |
| peroxiredoxin 4 | antioxidant | 5453549 | 12.0 | 4.0 |
| glutathione reductase | antioxidant | 50301238 | 12.3 | 1.0 |
| glutathione peroxidase 1 isoform 2 | antioxidant | 41406082 | 3.0 | 0.0 |
| glutathione S-transferase alpha 2 | glutathione conjugation | 215276987 | 10.7 | 0.0 |
| glutathione transferase | glutathione conjugation | 4504183 | 43.0 | 21.0 |
| glutathione transferase zeta 1 isoform 1 | glutathione conjugation | 22202624 | 3.7 | 0.0 |
| glutathione S-transferase mu 3 | glutathione conjugation | 23065552 | 9.3 | 2.0 |
Functional annotation is based on Protein Knowledgebase at http://www.uniprot.org.
It is well-known that chemotherapy and radiation therapy are commonly applied to kill the tumors. Most chemotherapeutic drugs work by impairing mitosis, effectively targeting fast-dividing cancer cells, however, tumor cells can develop resistance to the treatment by alteration of drug metabolism.39 Radiation therapy works by damaging the DNA of cancerous cells through free radicals. Oxygen is a potent radio-sensitizer, increasing the effectiveness of a given dose of radiation by forming free radicals. Unfortunately, tumor cells in a hypoxic environment may be more resistant to radiation damage than those in a normal oxygen environment.40 Since the discovery of the Warburg effect, a myriad of drugs targeting metabolic pathways have been developed,41 and some researchers have reported that glucose restriction could be therapeutic for tumors because some tumor cells rely heavily on glycolysis for ATP generation.42 Thus, MS analysis of the proteome of PANC-1 cells and identification of differentially expressed proteins may serve as the basis of new diagnostics and treatment of PDAC.
4. CONCLUSION
Today, mass spectrometry is used routinely for large-scale protein identifications from complex biological mixtures.43–45 In our previous report, we characterized the proteome of PDAC cells from a metastatic cell line CFPAC-1 by LC–MS/MS and revealed metabolic alterations in CFPAC-1.16 Here, we extend these findings to another cell line PANC-1 which was derived from primary tumor, in order to verify this altered architecture. Using an improved LC–MS/MS method, we successfully identified a large number of proteins in PANC-1 and normal duct cells, mostly from abundant and medium-abundance proteins, and compared the protein expression between these two distinct samples based on spectra count label-free quantification approach. Our MS analysis unveiled Warburg effect and anomalous metabolism of glutamine in PANC-1 cells, which will facilitate our understanding of cancer cell’s survival in hypoxic environment. In addition, the result could reveal important clues to tumorigenic processes in pancreatic cancer and point to new therapeutic strategies to treat this deadly cancer.
Supplementary Material
Acknowledgments
This work was supported in part by grants from the Associazione Italiana Ricerca sul Cancro (AIRC nr. 5548), Fondazione San Paolo (Special Project Oncology), Ministero della Salute: Progetto integrato Oncologia, Regione Piemonte: Ricerca Industriale e Sviluppo Precompetitivo (BIOPRO and ONCOPROT), Ricerca Industriale “Converging Technologies” (BIOTHER), Progetti strategici su tematiche di interesse regionale o sovra regionale (IMMONC), Ricerca Sanitaria Finalizzata, Ricerca Sanitaria Applicata, European Pancreatic Cancer-Tumor-Microenvironment Network (EPC-TM-Net nr. 256974), Ministero dell’Istruzione e della Ricerca, Progetti di Rilevante Interesse Nazionale (MIUR PRIN 2009), and the College of Science at George Mason University.
Footnotes
Supplemental Table 1S is the result of proteomic analysis of PANC-1 and normal pancreatic duct cells. The table contains four sheets that list the identified proteins from the normal duct and PANC-1 cells, comparison between these two samples, and arbitrary criteria for selection of differentially expressed proteins based on spectra count. The proteins are sorted by average spectra count. The up-regulated proteins from PDAC cells are highlighted with green, and the down-regulated are highlighted with blue. Supplemental Table 2S is a partial list of up-regulated proteins in PANC-1, and Supplemental Table 3S is a partial list of down-regulated proteins in PANC-1. Supplemental Figure 1S is the statistical analysis of the identified proteins from normal duct and PANC-1 cells. Supplemental Figure 2S is the enzymes and their catalyzed chemical reactions involved in glutamine metabolism. Supplemental Figure 3S is the identification of CTP synthase by LC–MS/MS, and Supplemental Figure 4S is the identification of glutamyl-prolyl tRNA synthase by LC–MS/MS. This material is available free of charge via the Internet at http://pubs.acs.org.
References
- 1.Stryer L. Biochemistry. W. H. Freeman and Company; NewYork: 1995. [Google Scholar]
- 2.Warburg O. On respiratory impairment in cancer cells. Science. 1956;124(3215):269–270. [PubMed] [Google Scholar]
- 3.Vander Heiden MG, Cantley LC, Thompson CB. Understanding the Warburg effect: the metabolic requirements of cell proliferation. Science. 2009;324(5930):1029–1033. doi: 10.1126/science.1160809. [DOI] [PMC free article] [PubMed] [Google Scholar]
- 4.Levine AJ, Puzio-Kuter AM. The control of the metabolic switch in cancers by oncogenes and tumor suppressor genes. Science. 2010;330(6009):1340–1344. doi: 10.1126/science.1193494. [DOI] [PubMed] [Google Scholar]
- 5.Koppenol WH, Bounds PL, Dang CV. Otto Warburg’s contributions to current concepts of cancer metabolism. Nat Rev Cancer. 2011;11(5):325–337. doi: 10.1038/nrc3038. [DOI] [PubMed] [Google Scholar]
- 6.DeBerardinis RJ, Mancuso A, Daikhin E, Nissim I, Yudkoff M, Wehrli S, Thompson CB. Beyond aerobic glycolysis: transformed cells can engage in glutamine metabolism that exceeds the requirement for protein and nucleotide synthesis. Proc Natl Acad Sci USA. 2007;104(49):19345–19350. doi: 10.1073/pnas.0709747104. [DOI] [PMC free article] [PubMed] [Google Scholar]
- 7.Erickson JW, Cerione RA. Glutaminase: a hot spot for regulation of cancer cell metabolism? Oncotarget. 2010;1(8):734–740. doi: 10.18632/oncotarget.208. [DOI] [PMC free article] [PubMed] [Google Scholar]
- 8.DeBerardinis RJ, Cheng T. Q’s next: The diverse functions of glutamine in metabolism, cell biology and cancer. Oncogene. 2010;29(3):313–324. doi: 10.1038/onc.2009.358. [DOI] [PMC free article] [PubMed] [Google Scholar]
- 9.Ghaneh P, Costello E, Neoptolemos JP. Biology and management of pancreatic cancer. Gut. 2007;56(8):1134–1152. doi: 10.1136/gut.2006.103333. [DOI] [PMC free article] [PubMed] [Google Scholar]
- 10.Omura N, Goggins M. Epigenetics and epigenetic alterations in pancreatic cancer. Int J Clin Exp Pathol. 2009;2(4):310–326. [PMC free article] [PubMed] [Google Scholar]
- 11.Chen R, Pan S, Brentnall TA, Aebersold R. Proteomic profiling of pancreatic cancer for biomarker discovery. Mol Cell Proteomics. 2005;4(4):523–533. doi: 10.1074/mcp.R500004-MCP200. [DOI] [PubMed] [Google Scholar]
- 12.Aspinall-O’Dea M, Costello E. The pancreatic cancer proteome — recent advances and future promise. Proteomics Clin Appl. 2007;1(9):1066–1079. doi: 10.1002/prca.200700144. [DOI] [PubMed] [Google Scholar]
- 13.Chen R, Pan S, Aebersold R, Brentnall TA. Proteomics studies of pancreatic cancer. Proteomics Clin Appl. 2007;1(12):1582–1591. doi: 10.1002/prca.200700414. [DOI] [PMC free article] [PubMed] [Google Scholar]
- 14.Tonack S, Aspinall-O’Dea M, Neoptolemos JP, Costello E. Pancreatic cancer: proteomic approaches to a challenging disease. Pancreatology. 2009;9(5):567–576. doi: 10.1159/000212083. [DOI] [PubMed] [Google Scholar]
- 15.Schoumacher RA, Ram J, Iannuzzi MC, Bradbury NA, Wallace RW, Hon CT, Kelly DR, Schmid SM, Gelder FB, Rado TA. A cystic fibrosis pancreatic adenocarcinoma cell line. Proc Natl Acad Sci USA. 1990;87(10):4012–4016. doi: 10.1073/pnas.87.10.4012. [DOI] [PMC free article] [PubMed] [Google Scholar]
- 16.Zhou W, Capello M, Fredolini C, Piemonti L, Liotta L, Novelli F, Petricoin E. Proteomic analysis of pancreatic ductal adenocarcinoma cells reveals metabolic alterations. J Proteome Res. 2011;10(4):1944–1952. doi: 10.1021/pr101179t. [DOI] [PubMed] [Google Scholar]
- 17.Lieber M, Mazzetta J, Nelson-Rees W, Kaplan M, Todaro G. Establishment of a continuous tumor-cell line (panc-1) from a human carcinoma of the exocrine pancreas. Int J Cancer. 1975;15(5):741–747. doi: 10.1002/ijc.2910150505. [DOI] [PubMed] [Google Scholar]
- 18.Klein T, Heremans Y, Heimberg H, Pipeleers D, Madsen OD, Serup P, Heller RS. Investigation and characterization of the duct cell-enriching process during serum-free suspension and monolayer culture using the human exocrine pancreas fraction. Pancreas. 2009;38(1):36–48. doi: 10.1097/MPA.0b013e3181816547. [DOI] [PubMed] [Google Scholar]
- 19.Elias JE, Gygi SP. Target-decoy search strategy for increased confidence in large-scale protein identifications by mass spectrometry. Nat Methods. 2007;4(3):207–214. doi: 10.1038/nmeth1019. [DOI] [PubMed] [Google Scholar]
- 20.Snyder LR, Kirkland JJ, Dolan JW. Introduction to modern liquid chromatography. John Wiley & Sons, Inc; Hoboken, NJ: 2010. [Google Scholar]
- 21.Liu H, Sadygov R, Yates JR., III A model for random sampling and estimation of relative protein abundance in shotgun proteomics. Anal Chem. 2004;76(14):4193–4201. doi: 10.1021/ac0498563. [DOI] [PubMed] [Google Scholar]
- 22.Ishihama Y, Oda Y, Tabata T, Sato T, Nagasu T, Rappsilber J, Mann M. Exponentially modified protein abundance index (emPAI) for estimation of absolute protein amount in proteomics by the number of sequenced peptides per protein. Mol Cell Proteomics. 2005;4(9):1265–1272. doi: 10.1074/mcp.M500061-MCP200. [DOI] [PubMed] [Google Scholar]
- 23.Haimoto H, Takahashi Y, Koshikawa T, Nagura H, Kato K. Immunohistochemical localization of gamma-enolase in normal human tissues other than nervous and neuroendocrine tissues. Lab Invest. 1985;52(3):257–263. [PubMed] [Google Scholar]
- 24.Wise DR, Thompson CB. Glutamine addiction: a new therapeutic target in cancer. Trends Biochem Sci. 2010;35(8):427–433. doi: 10.1016/j.tibs.2010.05.003. [DOI] [PMC free article] [PubMed] [Google Scholar]
- 25.Kizaki H, Williams JC, Morris HP, Weber G. Increased cytidine 5′-triphosphate synthetase activity in rat and human tumors. Cancer Res. 1980;40(11):3921–3927. [PubMed] [Google Scholar]
- 26.Ahluwalia GS, Grem JL, Hao Z, Cooney DA. Metabolism and action of amino acid analog anti-cancer agents. Pharmacol Ther. 1990;46(2):243–271. doi: 10.1016/0163-7258(90)90094-i. [DOI] [PubMed] [Google Scholar]
- 27.Cerini C, Kerjan P, Astier M, Gratecos D, Mirande M, Semeriva M. A component of the multisynthetase complex is a multifunctional aminoacyl-tRNA synthetase. EMBO J. 1991;10(13):4267–4277. doi: 10.1002/j.1460-2075.1991.tb05005.x. [DOI] [PMC free article] [PubMed] [Google Scholar]
- 28.Orlandi A, Ferlosio A, Ciucci A, Francesconi A, Lifschitz-Mercer B, Gabbiani G, Spagnoli LG, Czernobilsky B. Cellular retinol binding protein-1 expression in endometrial hyperplasia and carcinoma: diagnostic and possible therapeutic implications. Mod Pathol. 2006;19(6):797–803. doi: 10.1038/modpathol.3800586. [DOI] [PubMed] [Google Scholar]
- 29.Zhang P, Zhang C, Wang X, Liu F, Sung CJ, Quddus MR, Lawrence WD. The expression of selenium-binding protein 1 is decreased in uterine leiomyoma. Diagn Pathol. 2010;5:80. doi: 10.1186/1746-1596-5-80. [DOI] [PMC free article] [PubMed] [Google Scholar]
- 30.Raucci R, Colonna G, Guerriero E, Capone F, Accardo M, Castello G, Costantini S. Structural and functional studies of the human selenium binding protein-1 and its involvement in hepatocellular carcinoma. Biochim Biophys Acta. 2011;1814(4):513–522. doi: 10.1016/j.bbapap.2011.02.006. [DOI] [PubMed] [Google Scholar]
- 31.Allison AC. Lysosomes in cancer cells. J Clin Pathol Suppl (R Coll Pathol) 1974;7:43–50. [PMC free article] [PubMed] [Google Scholar]
- 32.Fehrenbacher N, Jäättelä M. Lysosomes as targets for cancer therapy. Cancer Res. 2005;65(8):2993–2995. doi: 10.1158/0008-5472.CAN-05-0476. [DOI] [PubMed] [Google Scholar]
- 33.Kroemer G, Jäättelä M. Lysosomes and autophagy in cell death control. Nat Rev Cancer. 2005;5(11):886–897. doi: 10.1038/nrc1738. [DOI] [PubMed] [Google Scholar]
- 34.Rochefort H. Cathepsin D in breast cancer: a tissue marker associated with metastasis. Eur J Cancer. 1992;28A:1780–1783. doi: 10.1016/0959-8049(92)90003-k. [DOI] [PubMed] [Google Scholar]
- 35.Motojima K, Urano T, Nagata Y, Shiku H, Tsurifune T, Kanematsu T. Detection of point mutations in the Kirsten-ras oncogene provides evidence for the multicentricity of pancreatic carcinoma. Ann Surg. 1993;217(2):138–143. doi: 10.1097/00000658-199302000-00007. [DOI] [PMC free article] [PubMed] [Google Scholar]
- 36.Arany Z, Huang LE, Eckner R, Bhattacharya S, Jiang C, Goldberg MA, Bunn HF, Livingston DM. An essential role for p300/CBP in the cellular response to hypoxia. Proc Natl Acad Sci USA. 1996;93(23):12969–12973. doi: 10.1073/pnas.93.23.12969. [DOI] [PMC free article] [PubMed] [Google Scholar]
- 37.Jaakkola P, Mole DR, Tian YM, Wilson MI, Gielbert J, Gaskell SJ, Kriegsheim Av, Hebestreit HF, Mukherji M, Schofield CJ, Maxwell PH, Pugh CW, Ratcliffe PJ. Targeting of HIF-alpha to the von Hippel-Lindau ubiquitylation complex by O2-regulated prolyl hydroxylation. Science. 2001;292(5516):468–472. doi: 10.1126/science.1059796. [DOI] [PubMed] [Google Scholar]
- 38.Ozawa K, Kuwabara K, Tamatani M, Takatsuji K, Tsukamoto Y, Kaneda S, Yanagi H, Stern DM, Eguchi Y, Tsujimoto Y, Ogawa S, Tohyama M. 150-kDa oxygen-regulated protein (ORP150) suppresses hypoxia-induced apoptotic cell death. J Biol Chem. 1999;274(10):6397–6404. doi: 10.1074/jbc.274.10.6397. [DOI] [PubMed] [Google Scholar]
- 39.Fodale V, Pierobon M, Liotta L, Petricoin E. Mechanism of cell adaptation: when and how do cancer cells develop chemoresistance? Cancer J. 2011;17(2):89–95. doi: 10.1097/PPO.0b013e318212dd3d. [DOI] [PMC free article] [PubMed] [Google Scholar]
- 40.Harrison LB, Chadha M, Hill RJ, Hu K, Shasha D. Impact of tumor hypoxia and anemia on radiation therapy outcomes. Oncologist. 2002;7(6):492–508. doi: 10.1634/theoncologist.7-6-492. [DOI] [PubMed] [Google Scholar]
- 41.Pelicano H, Martin DS, Xu RH, Huang P. Glycolysis inhibition for anticancer treatment. Oncogene. 2006;25(34):4633–4646. doi: 10.1038/sj.onc.1209597. [DOI] [PubMed] [Google Scholar]
- 42.Shelton LM, Huysentruyt LC, Mukherjee P, Seyfried TN. Calorie restriction as an anti-invasive therapy for malignant brain cancer in the VM mouse. ASN Neuro. 2010;2(3):e00038. doi: 10.1042/AN20100002. [DOI] [PMC free article] [PubMed] [Google Scholar]
- 43.Domon B, Aebersold R. Mass spectrometry and protein analysis. Science. 2006;312(5771):212–217. doi: 10.1126/science.1124619. [DOI] [PubMed] [Google Scholar]
- 44.Cravatt BF, Simon GM, Yates JR., III The biological impact of mass-spectrometry-based proteomics. Nature. 2007;450(7172):991–1000. doi: 10.1038/nature06525. [DOI] [PubMed] [Google Scholar]
- 45.Nilsson T, Mann M, Aebersold R, Yates JR, III, Bairoch A, Bergeron JJ. Mass spectrometry in high-throughput proteomics: ready for the big time. Nat Methods. 2010;7(9):681–685. doi: 10.1038/nmeth0910-681. [DOI] [PubMed] [Google Scholar]
Associated Data
This section collects any data citations, data availability statements, or supplementary materials included in this article.