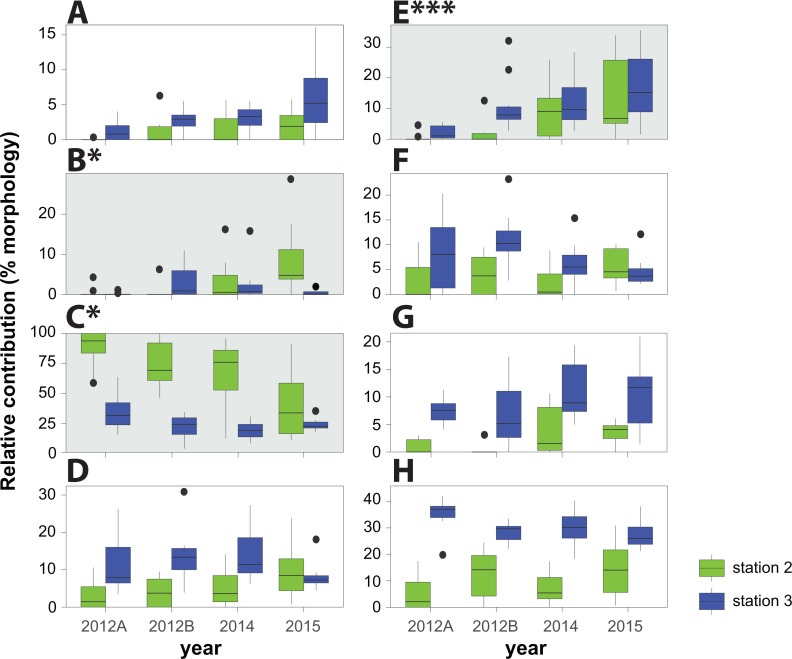
Figure 2. Community weight mean (CWM) of trait values.
Community weight mean (CWM) of trait values representing the contribution (%) of corals representing each given morphology. Significant results are shaded with a grey background (Kruskal-Wallis/Conover tests, * p < 0.05; *** p < 0.01). 2012A refers to pre-typhoon data and 2012B refers to post-typhoon data, both from White et al. (2013). (A) Arborescent; (B) Plate-like; (C) Laminar & Foliose; (D) Massive & Submassive; (E) Bushy; (F) Columnar; (G) Unattached; (H) Encrusting.

