

Abstract
Background
The renal proximal tubule is essential for removing organic solutes and exogenous medications from the circulation. We evaluated diurnal, prandial, and long-term biological variation of four candidate endogenous markers of proximal tubular secretion.
Methods
We used liquid chromatography-mass spectrometry to measure plasma and urine concentrations of hippurate (HA), cinnamoylglycine (CMG), indoxyl sulfate (IS), and p-cresol sulfate (PCS) in 25 healthy adults. We measured plasma concentrations of secreted solutes at 13 time points over a 24-hour period, and again after 2 weeks and 14 weeks of follow-up. We further measured 24-hour renal clearances of secreted solutes at baseline, 2 weeks, and 14 weeks.
Results
Plasma concentrations of secreted solutes varied over the 24-hour baseline period. Diurnal variation was greatest for HA, followed by CMG, IS, and PCS. Plasma concentrations of HA (P=0.002) and IS (P=0.02), but not CMG and PCS, increased significantly following meals. Long-term intra-individual variation (CVI) in plasma concentrations of secreted solutes over 14 weeks varied from 21.8% for IS to 67.3% for PCS, and exceeded that for plasma creatinine (CVI 7.1%). Variation in 24-hour renal clearances was similar among the secreted solutes (CVA+I 33.6% – 47.3%) and was lower using pooled plasma samples from each study visit.
Conclusions
Plasma concentrations of HA, CMG, IS, and PCS fluctuate within individuals throughout the day and over weeks. Renal clearances of these secreted solutes, which serve as estimates of renal proximal tubule secretion, are also subject to intra-individual biological variation that can be improved by additional plasma measurements.
Keywords: kidney function, tubular secretion, uremic solutes, indoxyl sulfate, p-cresol sulfate, hippurate, cinnamoylglycine
INTRODUCTION
The glomerular filtration rate (GFR) is the established metric of kidney function that is currently used in clinical practice to evaluate and treat chronic kidney disease (CKD) (1). GFR is typically estimated from serum creatinine concentrations and represents the clearance of freely circulating molecules that are readily filtered at the glomerulus (2–4). However, GFR does not assess the independent secretory function of the kidneys, which is vital for eliminating non-filtered substances and medications, particularly protein bound molecules that cannot readily cross the glomerulus. Proximal tubular secretion is the primary mechanism by which the kidneys excrete protein bound metabolites, including retained products of gut microbial metabolism that circulate bound to albumin and are suspected to contribute to uremic toxicity (5–11). Proximal tubular secretion also represents the primary mechanism by which the kidneys eliminate hundreds of commonly prescribed drugs and their metabolites (5).
Despite the recognized importance of tubular secretion in metabolite and drug clearance, this vital kidney function has been difficult to quantify in clinical and research settings due to the lack of validated assays for endogenous secretion markers. Recent studies have used liquid chromatography-mass spectrometry (LC-MS) to quantify secreted solutes in serum and urine (12–14). These studies have demonstrated marked intra-individual differences in estimated tubule clearance relative to GFR, and independent associations of proximal tubule clearances with mortality, renal, and cardiovascular events (12,13). The ongoing development of novel assays to estimate renal tubule clearance could promote many important clinical applications, including differentiation among the various etiologies of kidney disease, optimization of renal medication dosing strategies, and identification of new therapeutic targets of uremic toxicity (8,15).
The development of new assays for proximal tubule solutes requires careful evaluation of intra-individual diurnal, prandial, and long-term variation of measured analytes. Such evaluation is lacking for currently identified candidate markers of renal solute clearance. Therefore, in this study we comprehensively determined these measurement properties for four candidate markers: hippurate (HA), cinnamoylglycine (CMG), indoxyl sulfate (IS), and p-cresol sulfate (PCS) in a group of healthy individuals (16,17). We calculated diurnal variation in plasma concentrations of secreted solutes from samples that were collected at multiple time points over a 24-hour period and assessed long-term variation in plasma concentrations and timed renal clearances of these solutes at 2 and 14 weeks of follow-up.
METHODS
Study Population
We evaluated 25 overweight individuals (body mass index 28–33 kg/m2) from a previous randomized trial that compared the effect of a diet rich in n-3-polyunsaturated fatty acids to a control diet on body weight, appetite, and energy expenditure over 14 weeks (18,19). The trial was conducted from 2005–2008. Of the 33 randomized participants, 25 completed all three follow-up visits and were included in the current study. The original study protocol was approved by the University of Washington Institutional Review Board, and was conducted in accordance with the Declaration of Helsinki.
Study Procedures
Participants completed 24-hour study visits at the University of Washington Clinical Research Center at baseline and then at 2 and 14 weeks following randomization. During these visits, nurses collected 5 mL blood samples every 30 min between 0800 and 2100 h and every 60 min between 2100 and 0800 h the next day. Coordinators also collected timed urine samples over the complete 24-hour period. Clinical Research Center staff administered meals at 0800, 1200, and 1730 h, and a snack at 2000 h. All meals were completed within 30 min. Coordinators centrifuged blood samples for 15 minutes at 1,600 × g and 4 °C and prepared plasma aliquots, which were frozen individually in 1.5 mL polypropylene screw cap micro tubes (Sarstedt, Nuermbrecht, Germany) and stored at −70°C until analysis. Additionally, study coordinators created pooled plasma samples representative of 24-h blood concentrations by combining 50 μL plasma from each sample drawn at 30-min intervals and 100 μL plasma from each sample drawn at 60-min intervals. Coordinators froze urine samples individually in 1.5 mL polypropylene screw cap micro tubes (Sarstedt, Nuermbrecht, Germany), which were stored at −70°C until analysis. For the purposes of this study, we analyzed plasma samples from 13 selected time points during the baseline study visit, including before and after meals, as well as 0800 h samples from the week 2 and week 14 follow-up visits and the pooled plasma and timed urine samples from all study visits.
Laboratory Methods
We determined plasma and urine concentrations of HA, CMG, IS, and PCS using liquid chromatography-tandem mass spectrometry (LC-MS/MS). For plasma HA and CMG, phospholipids were removed using a Phenomenex Phree 96-well plate after the addition of internal standard (10 μL of 100 ng/mL cinnamoylglycine-d2 and 10 μg/mL hippuric acid-d5) and 300 μL 1% formic acid in acetonitrile to the appropriate number of wells. Delipidated samples were evaporated to dryness, reconstituted in 100 μL water, and 50 μL was injected onto the LC-MS/MS system. For urine HA and CMG, 10 μL of diluted samples (1:10 with water) were spiked with 10 μL internal standard, further diluted with 80 μL of water (final dilution 1:100), and injected (10 μL) onto the LC-MS/MS system. We resolved analytes using an Acquity HSS T3 1.8μm 2.1×50 mm column (Waters) and a linear gradient from 98% (0.1% formic acid in water):2% (methanol) to 45% (0.1%Formic Acid in water):55% (methanol) in 5.75 min. Retention times were 3.4 and 5.2 min for hippurate and cinnamoylglycine, respectively. We detected analytes using a Xevo TQ-MS (Waters) operated in positive ion electrospray ionization mode. The transitions monitored were m/z 206.04>131.04 and 206.04>103.06 for CG, and m/z 181.03>105.01 and 181.03>76.97 for HA.
For IS and PCS we added subject plasma samples to wells of a 0.5 mL polypropylene microplate, then diluted to a 50:50 v/v with 4% phosphoric acid to disrupt protein bound analytes. Authentic analyte standards at various concentrations in ACN:MeOH 75:25 v/v were added to wells containing MSG 4000 to generate a dose response curve. All samples received internal standards (d-2H5 IS, d-2H7 PCS) to make final concentrations of 0.5 μg/ml and 1.0 μg/ml upon reconstitution. Microplates were vortexed and contents transferred to a pre-equilibrated weak anion exchange microelution plate. The plate was washed with 200 μL of MeOH, then 2 × 75 μL of 5% NH4OH in ACN:MeOH 60:40 v/v. The 5% NH4OH in ACN:MeOH 60:40 v/v elutants were evaporated to dryness under vacuum, then reconstituted in 100 μL of 5 mM NH4CH3COO at pH 6.8. Ten μL of each elutant was subjected to LC-MS/MS analysis. For urine measurements, we diluted patient urine with water before LC-MS/MS, at a final dilution of 1/35. We assayed analyte standards in the presence of 3% phosphate buffered saline to mimic salt concentration in urine. We added deuterated standards to all samples as before. For both plasma and urine IS and PCS, we separated analytes using reverse phase chromatography over a C18 2.1 × 100 mm, 3 μm Waters T3 column. The LC mobile phases were: (A) 5 mM NH4HCOO pH 6.8 and (B) ACN. After an initial wash at 5% B for 1.0 minute, we applied a gradient of B from 15% to 60% in 5.5 min to elute analytes and then washed the column with 80% B for 2 min before re-equilibration. The retention times for IS and PCS were 5.19 and 5.65 min, respectively. The ion transitions monitored were m/z 212>132 m/z for IS and m/z 217>137 for its deuterated form. For PCS and its deuterated form, the ion transitions were m/z 187>107 and m/z 194>114 m/z, respectively.
We measured plasma concentrations of creatinine, blood urea nitrogen, phosphorus, and cystatin C (Gentian assay) on a Beckman-Coulter DXC automated chemistry analyzer. We calculated the estimated glomerular filtration rate (eGFR) using the 2012 Chronic Kidney Disease Epidemiology Collaboration (CKD-EPI) creatinine plus cystatin C equation (4).
Statistical Analysis
We evaluated the effect of n-3-polyunsaturated fatty acid dietary intervention treatment assignment on daily urinary excretion and plasma concentrations of each solute over the 14-week study period using a linear mixed model with a time by diet group interaction. We found no significant impact of treatment group on 24-hour urinary excretion or plasma concentrations of any measured solute (Supplemental Tables 1 and 2). Given these findings, we pooled subjects assigned to both treatment arms into a single group for analyses. We compared weighted mean from 13 timed samples collected during the baseline visit to pooled plasma concentrations from the same visit to demonstrate near perfect agreement (Supplemental Figure 1). Therefore, we used the weighted mean for analyses of diurnal variation.
Because samples from participants in the study were not assayed in duplicate, we assessed the laboratory component of error using quality control standards to calculate analytic coefficients of variation (CVs) for creatinine, IS and PCS, and using low- and high-concentration clinical samples for HA and CMG. For each analyte, we calculated renal clearance as the blood volume cleared of that solute per minute:
where UX was the urinary concentration of the solute, PX was the total plasma concentration of the solute, and V was the 24-h urine volume divided by 1440 min.
To evaluate diurnal variability over 24 h in plasma concentrations of each analyte, we calculated group level weighted means and plotted medians and interquartile ranges for each time point over the 24-h baseline visit. Additionally, to assess the extent to which individual plasma measurements of each solute capture 24-h exposure, we regressed weighted mean plasma biomarker concentrations from the baseline study visit on concentrations from individual time-points over the 24-h visit and calculated model R2 values.
To evaluate biological variation in plasma concentrations and renal clearances of each protein-bound solute over the 14-week study period, we calculated means with standard deviations using 0800 h plasma samples and 24-h pooled plasma samples at the baseline, 2-week, and 14-week study visits. To assess for systematic trends in concentrations of secreted solutes, we fit linear mixed regression models with a time effect. No systematic trends were observed. Using the criteria established by Reed et al. (20), we compared each individual’s mean values in relation to the group values. No outliers were detected. Homogeneity of the within-person variances for each secreted solute was evaluated using Cochran’s test (21). For HA, CMG, and PCS, homogeneity of variance was achieved after excluding one patient each, and for creatinine after excluding three patients. Variance homogeneity for IS was achieved without exclusion of any individual. We next plotted the participant-level distributions of each plasma and urinary clearance measurement at the three study visits. We estimated intra-individual and inter-individual biological variation separately using balanced ANOVA models on log-transformed data; corresponding confidence intervals were derived using methods described by Burdick and Graybill (21–23). CVs were calculated through back-transformation of the standard deviations of the log transformed data (σ) as (24):
As the estimates of intra-individual biological variation (CVA+I) included a component of analytical imprecision (CVA), we further estimated the intra-individual biological variation in the absence of analytic variation (CVI) for plasma concentrations of each secreted solute as:
The CVA values used in application of this formula were generated from low concentration laboratory standards for each solute. The index of individuality was calculated as the ratio of the within-person biological variation (CVA+I) to the between-person biological variation (CVG). Reference change values (RCVs) for measurement increases (RCVpos) and decreases (RCVneg), expressed as a percent and defined as the difference required for significance for two serial results from an individual, were calculated from log-transformed data as (24):
where σA+I was the standard deviation of the log transformed intra-individual variability data, inclusive of the analytic variability component. We excluded a single 0800 h creatinine value of 0.16 mg/dL from the long-term variation analyses due to suspected laboratory error.
In a set of additional analyses to explore the potential impact of over- or under-collection of urine on calculated clearances, we calculated 24-h creatinine excretion for each subject from the urine creatinine concentration and urine volume, and divided by expected values for 24-h creatinine excretion (17.5 mg per kg of lean body mass for women and 22.5 mg per kg for men) to give observed-to-expected creatinine excretion ratios (25). We then recalculated clearances of each secreted solute at the 2-week and 14-week follow-up visits scaling urine collection intervals to achieve baseline-equivalent daily creatinine excretion. Statistical analyses were performed with R 3.2.3 (R Foundation for Statistical Computing, Vienna, Austria).
RESULTS
Description of the measured solutes
The mean age of study participants was 38.7 ± 12.9 y and the mean body mass index was 30.2 ± 1.3 kg/m2 (Table 1). Total analytic imprecision for plasma HA was 9.5% at a HA concentration of 0.88 μg/mL, 8.9% at a HA concentration of 6.76 μg/mL, 11.0% at a CMG concentration of 0.0018 μg/mL and 9.5% at a CMG concentration of 0.045 μg/mL. Analytic imprecision for IS and PCS were 14.3% at a IS concentration of 0.11 μg/mL, 8.4% at a IS concentration of 0.96 μg/mL, 13.3% at a PCS concentration of 0.43 μg/mL, and 7.2% at a PCS concentration of 4.1 μg/mL. In contrast, analytic imprecision for plasma creatinine measurement was 4.6% at a concentration of 7.4 mg/dL, 2.0% at a concentration of 4.17 mg/dL, and 2.4% at a concentration 0.83 mg/dL.
Table 1.
Baseline characteristics of study participants (N = 25).
| Characteristic | Mean (standard deviation) or number (%) |
|---|---|
| Age, y | 38.7 (12.9) |
| Female | 15 (60) |
| BMI (kg/m2) | 30.2 (1.3) |
| Plasma measurements | |
| Blood urea nitrogen (mg/dL) | 14 (2.0) |
| Creatinine (mg/dL) | 0.7 (0.1) |
| Cystatin C (mg/L) | 0.7 (0.1) |
| Estimated GFR (mL/min/1.73 m2)1 | 117 (14) |
| Urine measurements | |
| Volume (mL/24 hours) | 3535 (1260) |
| Creatinine, (mg/24 hours) | 1542 (597) |
| Hippurate (mg/24 hours) | 598 (253) |
| Cinnamoylglycine (mg/24 hours) | 4 (4) |
| Indoxyl sulfate (mg/24 hours) | 71 (35) |
| p-cresol sulfate (mg/24 hours) | 96 (86) |
GFR= Glomerular filtration rate estimated using the 2012 CKD-EPI equation
Plasma and urine concentrations of HA, CMG, IS and PCS at baseline were considerably lower than those of creatinine (Table 2). The 24-h urinary clearances of HA and CMG at baseline were substantially higher than creatinine clearance, whereas the clearances of IS and PCS were lower (Figure 1, Table 3).
Table 2.
Variability of plasma secreted solute concentrations and estimates of variance components over 14 weeks.
| Hippurate (μg/mL) |
Cinnamoylglycine (μg/mL) |
Indoxyl sulfate (μg/mL) |
p-cresol sulfate (μg/mL) |
Creatinine (mg/dL) |
|
|---|---|---|---|---|---|
| 0800 h samples | |||||
| Baseline | 0.66 (0.51) | 0.012 (0.010) | 0.83 (0.43) | 3.5 (2.3) | 0.69 (0.14) |
| 2 Weeks | 0.55 (0.24) | 0.011 (0.008) | 0.78 (0.34) | 3.7 (2.2) | 0.72 (0.15) |
| 14 Weeks | 0.57 (0.34) | 0.013 (0.012) | 0.79 (0.38) | 3.7 (2.4) | 0.71 (0.12) |
| CVa+i (%) | 39.6 (32.7, 50.6) | 48.1 (39.4, 62.9) | 26.1 (21.5, 33.3) | 68.6 (54.8, 93.0) | 7.5 (6.2, 9.5) |
| CVi (%) | 38.4 (31.3, 49.7) | 46.8 (37.8, 61.9) | 21.8 (16.1, 30.1) | 67.3 (53.2, 92.0) | 7.1 (5.7, 9.2) |
| CVg (%) | 63.1 (43.6, 101.7) | 138.2 (91.2, 279.4) | 41.9 (29.3, 65.3) | 83.1 (50.7, 157.4) | 18.2 (13.5, 26.6) |
| II | 0.63 | 0.35 | 0.62 | 0.83 | 0.41 |
| RCVneg, RCVpos (%) | −65, 188 | −72, 254 | −51, 104 | −82, 460 | −19, 23 |
| Pooled samples | |||||
| Baseline | 1.03 (0.37) | 0.009 (0.007) | 0.90 (0.42) | 3.3 (2.0) | 0.68 (0.13) |
| 2 Weeks | 0.94 (0.35) | 0.010 (0.008) | 0.90 (0.36) | 3.9 (2.5) | 0.68 (0.12) |
| 14 Weeks | 1.00 (0.46) | 0.010 (0.009) | 0.98 (0.49) | 3.8 (2.5) | 0.71 (0.12) |
| CVa+i (%) | 23.9 (19.1, 31.0) | 34.2 (27.6, 44.3) | 11.4 (4.5, 18.8) | 43.3 (33.9, 58.8) | 7.9 (6.5, 10.2) |
| CVi (%) | 25.7 (21.3, 32.4) | 35.9 (29.7, 45.6) | 18.3 (15.0, 23.6) | 45.3 (36.4, 60.3) | 8.3 (6.9, 10.5) |
| CVg (%) | 50.8 (36.7, 77.9) | 127.2 (86.5, 243.6) | 37.3 (26.6, 58.2) | 62.3 (39.9, 110.4) | 15.9 (11.6, 23.5) |
| II | 0.51 | 0.28 | 0.49 | 0.73 | 0.52 |
| RCVneg, RCVpos (%) | −50, 102 | −62, 163 | −40, 65 | −70, 231 | −20, 26 |
CVA+I = intra-individual coefficient of variation (including component of analytic imprecision); CVI = intra-individual coefficient of variation (excluding component of analytic imprecision); CVG = inter-individual coefficient of variation; RCVneg = reference change value for measurement decreases; RCVpos = reference change value for measurement increases; II = index of individuality.
Values for plasma concentrations are reported as mean (standard deviation)
Figure 1. Distributions of 24-h renal solute clearances at the baseline study visit.
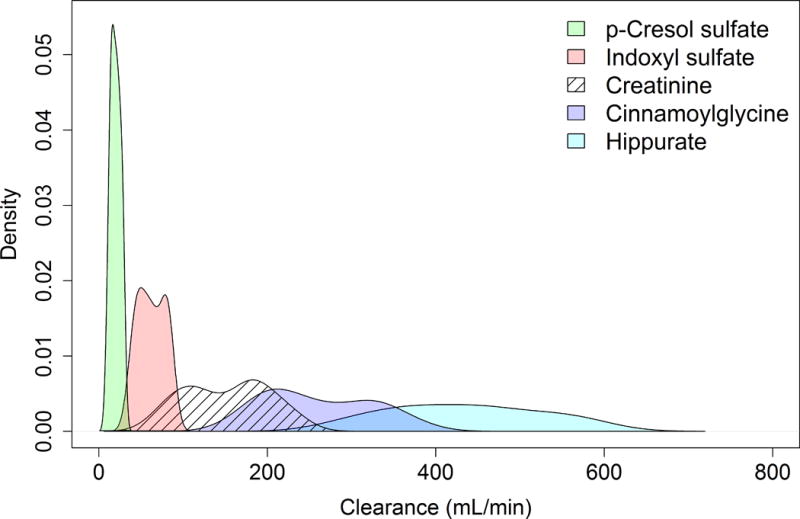
Values are calculated weighted mean clearances. Density estimates truncated to exclude top and bottom 5% of values.
Table 3.
Variability of 24-h urinary secreted solute clearances and estimates of variance components over 14 weeks.
| Hippurate clearance (mL/min) |
Cinnamoylglycine clearance (mL/min) |
Indoxyl sulfate clearance (mL/min) |
p-cresol sulfate clearance (mL/min) |
Creatinine clearance (mL/min) |
|
|---|---|---|---|---|---|
| 0800 h samples | |||||
| Baseline | 829 (525) | 209 (102) | 67 (28) | 17 (7) | 157 (52) |
| 2 Weeks | 901 (678) | 287 (126) | 74 (23) | 21 (10) | 157 (45) |
| 14 Weeks | 884 (517) | 256 (105) | 82 (35) | 24 (10) | 158 (45) |
| CVa+i (%) | 44.3 (36.5, 56.4) | 47.3 (38.8, 60.9) | 33.6 (27.6, 43.1) | 40.5 (33.0, 52.8) | 32.3 (26.6, 41.5) |
| CVg (%) | 39.9 (23.7, 65.2) | 13.9 (0.0, 33.8) | 23.8 (10.6, 40.6) | 26.4 (9.2, 47.1) | 23.0 (10.3, 39.2) |
| II | 1.11 | 3.40 | 1.41 | 1.53 | 1.41 |
| RCVneg, RCVpos (%) | −69, 224 | −71, 248 | −60, 148 | −66, 195 | −58, 140 |
| Pooled samples | |||||
| Baseline | 415 (110) | 259 (73) | 63 (18) | 20 (8) | 158 (54) |
| 2 Weeks | 423 (116) | 298 (82) | 64 (14) | 21 (5) | 163 (49) |
| 14 Weeks | 422 (107) | 298 (81) | 68 (22) | 23 (8) | 159 (54) |
| CVa+i (%) | 16.2 (13.5, 20.3) | 18.3 (15.3, 23.0) | 21.4 (17.5, 27.5) | 30.9 (25.1, 40.4) | 32.1 (26.4, 41.1) |
| CVg (%) | 26.1 (18.8, 38.5) | 24.4 (17.0, 36.6) | 23.3 (14.7, 37.4) | 20.6 (6.5, 37.2) | 26.9 (14.9, 44.4) |
| II | 0.62 | 0.75 | 0.92 | 1.50 | 1.19 |
| RCVneg, RCVpos (%) | −36, 56 | −40, 66 | −44, 80 | −57, 131 | −58, 138 |
CVA+I = intra-individual coefficient of variation (including component of analytic imprecision); CVI = intra-individual coefficient of variation (excluding component of analytic imprecision); CVG = inter-individual coefficient of variation; RCVneg = reference change value for measurement decreases; RCVpos = reference change value for measurement increases; II = index of individuality. Values for solute clearances are reported as mean (standard deviation).
Diurnal variation of plasma solutes
Circulating concentrations of all solutes varied to some extent throughout the day (Figure 2). HA exhibited the greatest amount of diurnal variation (Figure 2, Supplemental Figure 2). Plasma concentrations of HA and IS increased following meals (p=0.002 and p=0.02, respectively), whereas CMG, PCS, and creatinine concentrations did not exhibit significant postprandial changes. Plasma creatinine concentrations demonstrated the lowest diurnal variation. Single 0800 h plasma concentrations of CMG and PCS were reasonable predictors of their respective 24-h mean values (R2 0.85 and 0.84 respectively; Supplemental Table 3), whereas prediction statistics for HA and IS were lower. The addition of a second plasma measurement at 1830 h improved the proportion of variability captured for all solutes. There was minimal additional improvement upon addition of a third measurement at 1200 h.
Figure 2. Diurnal variation in plasma concentrations of measured solutes.

Line segments show the 25th/75th percentiles of marker values at each time point; dots are median marker value at that time point. Dotted line shows the median weighted mean marker value. Values from baseline study visit.
Long-term variation of plasma solutes and solute clearances
Intra-individual variation in 0800 h plasma concentrations of the secreted solutes over the baseline, 2-week, and 14-week follow-up visits was lowest for IS (CVI 21.8%) and highest for PCS (CVI 67.3%), with intermediate values observed for HA and CMG (Table 2). In contrast, the CVI for plasma creatinine was 7.1%. Long-term variation in the pooled plasma concentrations of secreted solutes was lower than that of the 0800 h samples (Figure 3, Supplemental Figure 3). The within-subject variation in 24-hour renal clearances of measured secreted solutes based on 0800 h plasma measurements were generally similar, with CVA+I ranging from 33.6% for IS to 47.3% for HA. Renal clearances of secreted solutes calculated from pooled plasma samples were generally more reliable than those calculated using 0800 h plasma measurements (Table 3, Supplemental Figures 4 and 5).
Figure 3. Subject-specific distribution of secreted solute plasma concentrations over 14 weeks.

Values from blood samples collected at 0800 h on each study visit day. Participants were sampled at baseline, 2 weeks, and 14 weeks. Dots indicate analyte values. ID, identification number
For all secreted solutes, inter-individual biological variation of plasma concentrations exceeded intra-individual variation (Table 2). For measurements on 0800 h blood samples, CVG ranges from 41.9% for IS to 138.2% for CMG; in comparison, CVG for plasma creatinine was 18.2%. In the setting of high CVG relative to CVA+I, the II for 0800 h plasma measurements of all secreted solutes was low, ranging from 0.35 for CMG to 0.83 for PCS. Inter-individual variation in 24-h renal clearances of secreted solutes using 0800 h plasma measurements was lowest for IS and highest for hippurate (CVG 13.9% and 39.9%, respectively). CVG values calculated from pooled plasma samples were similar among secreted solutes (Table 3).
In statistical sensitivity analyses, inclusion of individuals who were excluded in the primary analyses due to heterogeneity of variances did not substantially change estimates of the components of biological variability for either plasma concentrations or renal clearances of secreted solutes (Supplemental Tables 4 and 5). In a second set of statistical sensitivity analyses, scaling urine collection times per weight and gender based expected values did not meaningfully alter estimates of renal clearances of any of the secreted solutes (Supplemental Table 6).
DISCUSSION
In this longitudinal study of 25 healthy individuals, we observed moderate diurnal and long-term variation in circulating concentrations of four solutes that are cleared predominantly by renal proximal tubular secretion. Diurnal variation in plasma concentrations of HA and CMG was greater than that for IS and PCS; variation in concentrations all four secreted solutes was greater than that for creatinine. Biological variation of plasma concentrations and calculated renal clearances of the four secreted solutes over the 14-week follow-up period was moderate, and generally improved when using 24-h pooled plasma samples. Scaling urine collection times at follow-up visits to account for the estimated amount of over- or under-collection did not substantially affect any component of biological variation of calculated renal clearances.
Over the past decade, there have been numerous papers published examining the association between blood concentrations of secreted solutes and outcomes in patients with chronic kidney disease.(26–32) In such studies, blood samples for measurements were typically been collected at a single time point, may not have been collected at the same time of the day for all participants, and may not have been standardized with respect to food intake. The results of our study show that, in fact, there is substantial diurnal and long-term biological variation in both plasma concentrations and renal clearances of secreted solutes. The sources of the observed diurnal variation are likely multiple, and may include fluctuations in plasma concentrations due to diurnal or postprandial changes in intestinal absorption of microbial metabolic byproducts, adaptive post-translational modification of organic anion transporters in response to changing metabolic activity (33), or physiologic variation in tubular secretion function in response to hemodynamic fluctuations. Though assays for measurement of secreted solutes have not yet been used in clinical practice, future incorporation of such measurements into clinical decision making must be done with recognition of the observed biologic variability. For example, the rise in plasma concentrations of HA and IS following food intake suggests that such measurements should be made on fasting blood samples to minimize dietary influences. Additionally, consideration should be given using two serial secreted solutes measurements to estimate proximal tubular secretion function in future investigations. Finally, novel markers of tubular secretion function need to be identified that are subject to less intra-individual biological variability, allowing more precise inference regarding true longitudinal patient-level change in tubular secretion.
We found that long-term biological variability in renal clearances of secreted solutes was substantially greater than variability in solute plasma concentrations. Additionally, the use of 24-h pooled plasma samples to calculate renal clearances reduced variability for each secreted solute studied. Taken together, these findings suggest that true longitudinal biologic variability in secreted solute plasma concentrations and clearances may be driving the observed results. Our results echo those from previous investigations, which showed that biological variation of measured creatinine clearance exceeds that for plasma creatinine, which lessens the clinical usefulness of the creatinine clearance as a reflection of the true GFR (34,35). Additionally, “gold standard” methods of estimation of the GFR, including iothalamate or inulin clearance, also display large intra-individual variability, suggesting that true GFR is a dynamic function with inherent continuous variation (36). Our results demonstrate that intra-individual diurnal and long-term biological variability in both plasma concentrations and renal clearances of secreted solutes substantially exceeds that even for creatinine, that the true biological variability of tubular secretion function is likely greater than that for glomerular filtration, and that interpretation of measurements of tubular secretion markers must be performed with the recognition of this phenomenon.
Despite its strengths, our study should be interpreted in light of some limitations. First, participants were healthy individuals who had normal kidney function; variation in plasma solute concentrations and urinary solute clearances may differ among individuals who have established kidney disease. Second, the sampling intervals for repeated measurements over the 14-week study period were irregular, and thus calculated measures of biological variability incorporated variation over these differing intervals. Third, the number of repeated longitudinal samples per individual was low, and this contributed to imprecision in the calculated estimates for the components of biological variability. Finally, prolonged storage of frozen samples may have resulted in some degradation of measured solutes, and thus may have contributed to the observed variation in plasma concentrations and calculated clearances.
In summary, we describe patterns of biological variation in four candidate markers of kidney proximal tubular secretion collection in healthy individuals. We observed substantially greater intra-individual and inter-individual variation in both plasma concentrations and renal clearances of these markers compared to creatinine, which may limit their application in clinical practice. However, these data should inform the methodology of future studies that investigate proximal tubular solute clearance as a complementary kidney function measure to GFR for improving detection of early kidney disease, investigating causes of uremic toxicity, and optimizing renal medication dosing strategies.
Supplementary Material
Acknowledgments
This work was supported by grants from the National Institute of Diabetes and Digestive and Kidney Diseases (T32 DK007467 supporting M.B.R, R01 DK094891 to B.R.K., and P30 DK035816 supporting the University of Washington Nutrition Obesity Research Center), the National Center for Advancing Translational Sciences (KL2 TR000421 supporting M.B.R.) and an unrestricted gift from the Northwest Kidney Centers to the Kidney Research Institute.
References
- 1.Levey AS, de Jong PE, Coresh J, El Nahas M, Astor BC, Matsushita K, et al. The definition, classification, and prognosis of chronic kidney disease: a KDIGO Controversies Conference report. Kidney Int. 2011;80:17–28. doi: 10.1038/ki.2010.483. [DOI] [PubMed] [Google Scholar]
- 2.Levey AS, Bosch JP, Lewis JB, Greene T, Rogers N, Roth D. A more accurate method to estimate glomerular filtration rate from serum creatinine: a new prediction equation. Modification of Diet in Renal Disease Study Group. Ann Intern Med. 1999;130:461–70. doi: 10.7326/0003-4819-130-6-199903160-00002. [DOI] [PubMed] [Google Scholar]
- 3.Levey AS, Stevens LA, Schmid CH, Zhang YL, Castro AF, Feldman HI, et al. A new equation to estimate glomerular filtration rate. Ann Intern Med. 2009;150:604–12. doi: 10.7326/0003-4819-150-9-200905050-00006. [DOI] [PMC free article] [PubMed] [Google Scholar]
- 4.Inker LA, Schmid CH, Tighiouart H, Eckfeldt JH, Feldman HI, Greene T, et al. Estimating glomerular filtration rate from serum creatinine and cystatin C. N Engl J Med. 2012;367:20–9. doi: 10.1056/NEJMoa1114248. [DOI] [PMC free article] [PubMed] [Google Scholar]
- 5.Nolin TD, Naud J, Leblond FA, Pichette V. Emerging evidence of the impact of kidney disease on drug metabolism and transport. Clin Pharmacol Ther. 2008;83:898–903. doi: 10.1038/clpt.2008.59. [DOI] [PubMed] [Google Scholar]
- 6.Ramezani A, Raj DS. The gut microbiome, kidney disease, and targeted interventions. J Am Soc Nephrol JASN. 2014;25:657–70. doi: 10.1681/ASN.2013080905. [DOI] [PMC free article] [PubMed] [Google Scholar]
- 7.Ramezani A, Massy ZA, Meijers B, Evenepoel P, Vanholder R, Raj DS. Role of the Gut Microbiome in Uremia: A Potential Therapeutic Target. Am J Kidney Dis. 2016;67:483–98. doi: 10.1053/j.ajkd.2015.09.027. [DOI] [PMC free article] [PubMed] [Google Scholar]
- 8.Nigam SK, Wu W, Bush KT, Hoenig MP, Blantz RC, Bhatnagar V. Handling of Drugs, Metabolites, and Uremic Toxins by Kidney Proximal Tubule Drug Transporters. Clin J Am Soc Nephrol. 2015;10:2039–49. doi: 10.2215/CJN.02440314. [DOI] [PMC free article] [PubMed] [Google Scholar]
- 9.Meyer TW, Hostetter TH. Uremia. N Engl J Med. 2007;357:1316–25. doi: 10.1056/NEJMra071313. [DOI] [PubMed] [Google Scholar]
- 10.Meyer TW, Hostetter TH. Approaches to Uremia. J Am Soc Nephrol. 2014;25:2151–8. doi: 10.1681/ASN.2013121264. [DOI] [PMC free article] [PubMed] [Google Scholar]
- 11.Rossi M, Campbell KL, Johnson DW, Stanton T, Vesey DA, Coombes JS, et al. Protein-bound uremic toxins, inflammation and oxidative stress: a cross-sectional study in stage 3–4 chronic kidney disease. Arch Med Res. 2014;45:309–17. doi: 10.1016/j.arcmed.2014.04.002. [DOI] [PubMed] [Google Scholar]
- 12.Suchy-Dicey AM, Laha T, Hoofnagle A, Newitt R, Sirich TL, Meyer TW, et al. Tubular Secretion in CKD. J Am Soc Nephrol. 2016;27:2148–55. doi: 10.1681/ASN.2014121193. [DOI] [PMC free article] [PubMed] [Google Scholar]
- 13.Poesen R, Claes K, Evenepoel P, de Loor H, Augustijns P, Kuypers D, et al. Microbiota-Derived Phenylacetylglutamine Associates with Overall Mortality and Cardiovascular Disease in Patients with CKD. J Am Soc Nephrol. 2016;27:3479–87. doi: 10.1681/ASN.2015121302. [DOI] [PMC free article] [PubMed] [Google Scholar]
- 14.Poesen R, Viaene L, Verbeke K, Claes K, Bammens B, Sprangers B, et al. Renal Clearance and Intestinal Generation of p-Cresyl Sulfate and Indoxyl Sulfate in CKD. Clin J Am Soc Nephrol. 2013;8:1508–14. doi: 10.2215/CJN.00300113. [DOI] [PMC free article] [PubMed] [Google Scholar]
- 15.Putt TL, Duffull SB, Schollum JBW, Walker RJ. GFR may not accurately predict aspects of proximal tubule drug handling. Eur J Clin Pharmacol. 2014;70:1221–6. doi: 10.1007/s00228-014-1733-7. [DOI] [PubMed] [Google Scholar]
- 16.Sirich TL, Funk BA, Plummer NS, Hostetter TH, Meyer TW. Prominent accumulation in hemodialysis patients of solutes normally cleared by tubular secretion. J Am Soc Nephrol. 2014;25:615–22. doi: 10.1681/ASN.2013060597. [DOI] [PMC free article] [PubMed] [Google Scholar]
- 17.Sirich TL, Aronov PA, Plummer NS, Hostetter TH, Meyer TW. Numerous protein-bound solutes are cleared by the kidney with high efficiency. Kidney Int. 2013;84:585–90. doi: 10.1038/ki.2013.154. [DOI] [PMC free article] [PubMed] [Google Scholar]
- 18.Kratz M, Callahan HS, Yang PY, Matthys CC, Weigle DS. Dietary n-3-polyunsaturated fatty acids and energy balance in overweight or moderately obese men and women: a randomized controlled trial. Nutr Metab. 2009;6:24. doi: 10.1186/1743-7075-6-24. [DOI] [PMC free article] [PubMed] [Google Scholar]
- 19.Kratz M, Swarbrick MM, Callahan HS, Matthys CC, Havel PJ, Weigle DS. Effect of dietary n–3 polyunsaturated fatty acids on plasma total and high-molecular-weight adiponectin concentrations in overweight to moderately obese men and women. Am J Clin Nutr. 2008;87:347–53. doi: 10.1093/ajcn/87.2.347. [DOI] [PMC free article] [PubMed] [Google Scholar]
- 20.Reed AH, Henry RJ, Mason WB. Influence of Statistical Method Used on the Resulting Estimate of Normal Range. Clin Chem. 1971;17:275–84. [PubMed] [Google Scholar]
- 21.Fraser GG, Harris EK. Generation and Application of Data on Biological Variation in Clinical Chemistry. Crit Rev Clin Lab Sci. 1989;27:409–37. doi: 10.3109/10408368909106595. [DOI] [PubMed] [Google Scholar]
- 22.Røraas T, Petersen PH, Sandberg S. Confidence Intervals and Power Calculations for Within-Person Biological Variation: Effect of Analytical Imprecision, Number of Replicates, Number of Samples, and Number of Individuals. Clin Chem. 2012;58:1306–13. doi: 10.1373/clinchem.2012.187781. [DOI] [PubMed] [Google Scholar]
- 23.Burdick R, Graybill F. Confidence intervals on variance components. New York: Marcel Dekker; 1992. [Google Scholar]
- 24.Fokkema MR, Herrmann Z, Muskiet FAJ, Moecks J. Reference Change Values for Brain Natriuretic Peptides Revisited. Clin Chem. 2006;52:1602–3. doi: 10.1373/clinchem.2006.069369. [DOI] [PubMed] [Google Scholar]
- 25.Walser M. Creatinine excretion as a measure of protein nutrition in adults of varying age. J Parenter Enter Nutr. 1987;11:73S–78S. doi: 10.1177/014860718701100510. [DOI] [PubMed] [Google Scholar]
- 26.Meijers BKI, Claes K, Bammens B, de Loor H, Viaene L, Verbeke K, et al. p-Cresol and cardiovascular risk in mild-to-moderate kidney disease. Clin J Am Soc Nephrol. 2010;5:1182–9. doi: 10.2215/CJN.07971109. [DOI] [PMC free article] [PubMed] [Google Scholar]
- 27.Meijers BKI, Bammens B, De Moor B, Verbeke K, Vanrenterghem Y, Evenepoel P. Free p-cresol is associated with cardiovascular disease in hemodialysis patients. Kidney Int. 2008;73:1174–80. doi: 10.1038/ki.2008.31. [DOI] [PubMed] [Google Scholar]
- 28.Meijers BKI, Van kerckhoven S, Verbeke K, Dehaen W, Vanrenterghem Y, Hoylaerts MF, et al. The Uremic Retention Solute p-Cresyl Sulfate and Markers of Endothelial Damage. Am J Kidney Dis. 2009;54:891–901. doi: 10.1053/j.ajkd.2009.04.022. [DOI] [PubMed] [Google Scholar]
- 29.Cao X-S, Chen J, Zou J-Z, Zhong Y-H, Teng J, Ji J, et al. Association of Indoxyl Sulfate with Heart Failure among Patients on Hemodialysis. Clin J Am Soc Nephrol. 2015;10:111–9. doi: 10.2215/CJN.04730514. [DOI] [PMC free article] [PubMed] [Google Scholar]
- 30.Wu I-W, Hsu K-H, Lee C-C, Sun C-Y, Hsu H-J, Tsai C-J, et al. p-Cresyl sulphate and indoxyl sulphate predict progression of chronic kidney disease. Nephrol Dial Transplant. 2011;26:938–47. doi: 10.1093/ndt/gfq580. [DOI] [PMC free article] [PubMed] [Google Scholar]
- 31.Hsu H-J, Yen C-H, Chen C-K, Wu I-W, Lee C-C, Sun C-Y, et al. Association between uremic toxins and depression in patients with chronic kidney disease undergoing maintenance hemodialysis. Gen Hosp Psychiatry. 2013;35:23–7. doi: 10.1016/j.genhosppsych.2012.08.009. [DOI] [PubMed] [Google Scholar]
- 32.Wu C-C, Hsieh M-Y, Hung S-C, Kuo K-L, Tsai T-H, Lai C-L, et al. Serum Indoxyl Sulfate Associates with Postangioplasty Thrombosis of Dialysis Grafts. J Am Soc Nephrol. 2015;27:1254–64. doi: 10.1681/ASN.2015010068. [DOI] [PMC free article] [PubMed] [Google Scholar]
- 33.Duan P, You G. Short-Term Regulation of Organic Anion Transporters. Pharmacol Ther. 2010;125:55–61. doi: 10.1016/j.pharmthera.2009.08.002. [DOI] [PMC free article] [PubMed] [Google Scholar]
- 34.Toffaletti JG, McDonnell EH. Variation of serum creatinine, cystatin C, and creatinine clearance tests in persons with normal renal function. Clin Chim Acta. 2008;395:115–9. doi: 10.1016/j.cca.2008.05.020. [DOI] [PubMed] [Google Scholar]
- 35.Gowans EM, Fraser CG. Biological variation of serum and urine creatinine and creatinine clearance: ramifications for interpretation of results and patient care. Ann Clin Biochem. 1988;25:259–63. doi: 10.1177/000456328802500312. [DOI] [PubMed] [Google Scholar]
- 36.Agarwal R. Ambulatory GFR measurement with cold iothalamate in adults with chronic kidney disease. Am J Kidney Dis. 2003;41:752–9. doi: 10.1016/s0272-6386(03)00022-2. [DOI] [PubMed] [Google Scholar]
Associated Data
This section collects any data citations, data availability statements, or supplementary materials included in this article.