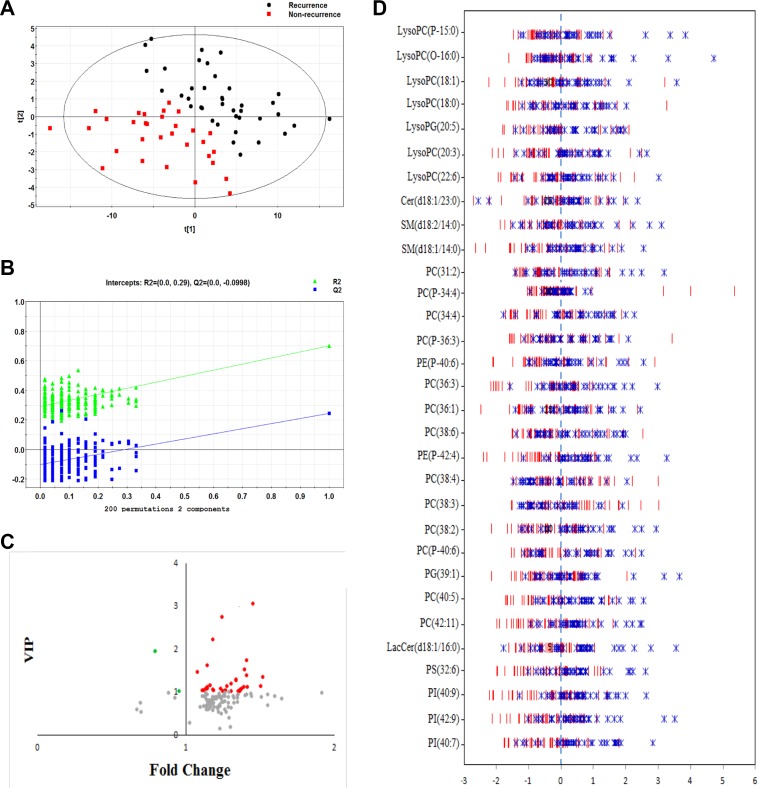
Figure 1.
(A) PLS-DA score plot distinguishing EOC recurrence from non-EOC recurrence (two latent variables with the performance of R2X = 0.364, R2Y = 0.701 and Q2 = 0.224); (B) Validation plot for discriminating between EOC recurrence and non-EOC recurrence with 200 permutations; (C) The scatter plot depicting the importance of metabolites in discriminating EOC recurrence from non-EOC recurrence; red dots represent down-regulation in EOC patients with recurrence, green dots represent up-regulation in EOC patients with recurrence; (D) The Z-score plot of differentiating metabolites between EOC recurrence and non-EOC recurrence. The values were standardized using mean centering and unit variance scaling of each variable.

