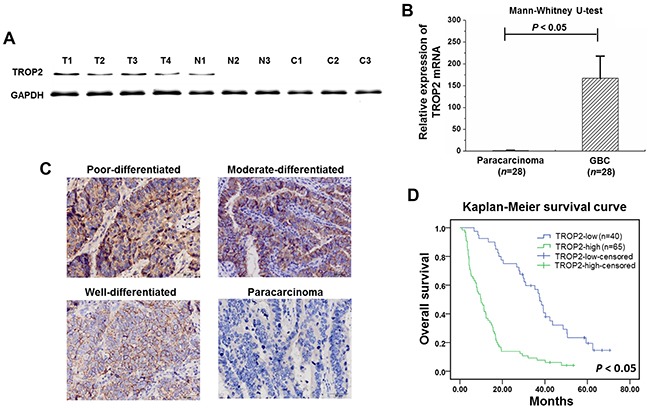
Figure 1. TROP2 expression in GBC samples.

(A) TROP2 protein was highly expressed in GBC, lower in paracarcinoma, and undetectable in chronic cholecystitis tissues (T: GBC, N: paracarcinoma, and C: chronic cholecystitis tissues). (B) TROP2 mRNA expression in GBC was significantly higher compared to paracarcinoma (167.06±50.71 VS 1.20±0.79, P<0.05). Columns, n=28; bars, S.D. P< 0.05, GBC compared with paracarcinoma. (C) TROP2 protein expression was higher in advanced GBCs revealed by IHC staining. No TROP2 expression was detected in paracarcinoma. (D) Kaplan-Meier survival curve showed that GBC patients with high TROP2 expression had a worse prognosis.
