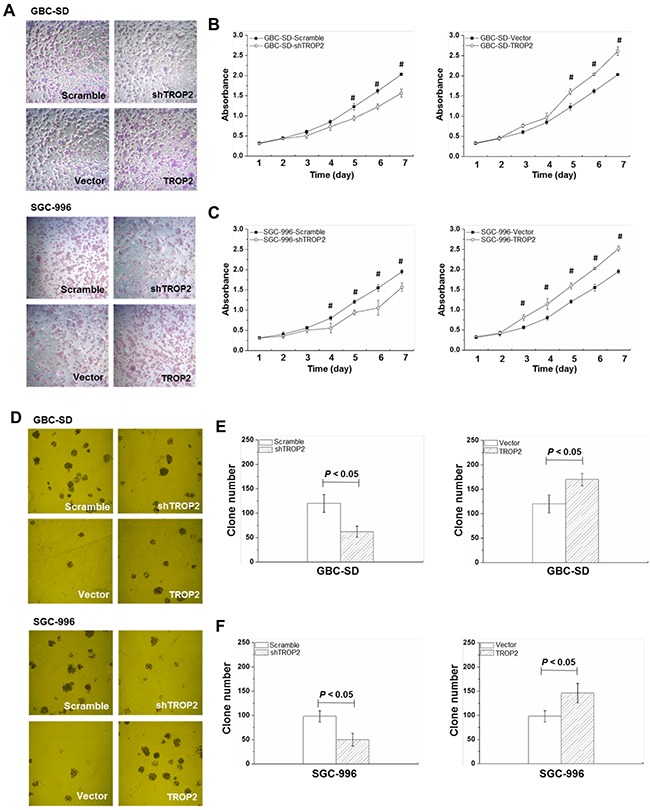
Figure 3. Effects of TROP2 on proliferation and clone formation of GBC-SD and SGC-996 cells.

(A) Microscope images of GBC-SD and SGC-996 cell growth after TROP2 knockdown and overexpression. (B and C) Growth curves of GBC-SD and SGC-996 cells after RNA interference or plasmid transfection. Graphs, mean of three experiments; bars, S.D. *P < 0.05, shTROP2 group compared with the control group. #P < 0.05, TROP2 overexpression group compared with the control group. Each experiment was repeated three times. (D) Microscope images of GBC-SD and SGC-996 cell clone formation after TROP2 knockdown and overexpression. (E and F) The number of clone formation of GBC-SD and SGC-996 cells after RNA interference or plasmid transfection. Columns, mean of three experiments; bars, S.D. Each experiment was repeated three times.
