
Figure 4. MIBC subclassification of the Chungbuk cohort by Illumina microarray analysis (n=42).
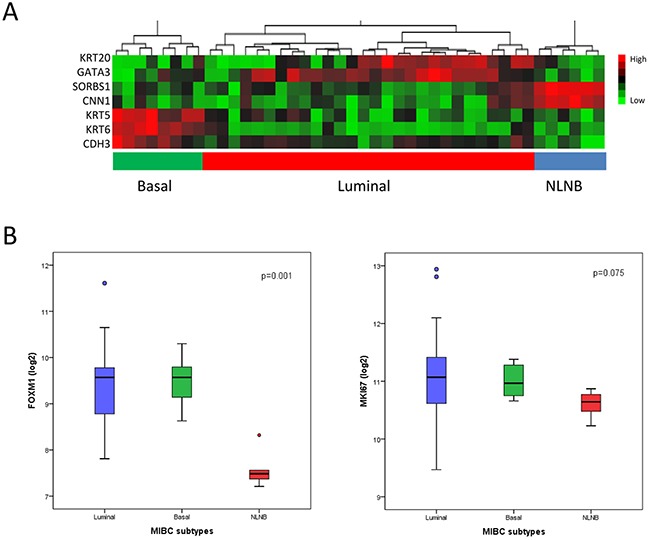
(A) Heatmap generated by unsupervised hierarchical clustering using a 7-gene signature. Luminal: KRT20, GATA3 (blue); basal: KRT6A, CDH3, KRT5 (green); NLNB: SORBS1, CNN1 (red). (B) Subtype specific expression of FOXM1 and MKI67 analyzed by qRT-PCR. Data are represented as median ±SD.