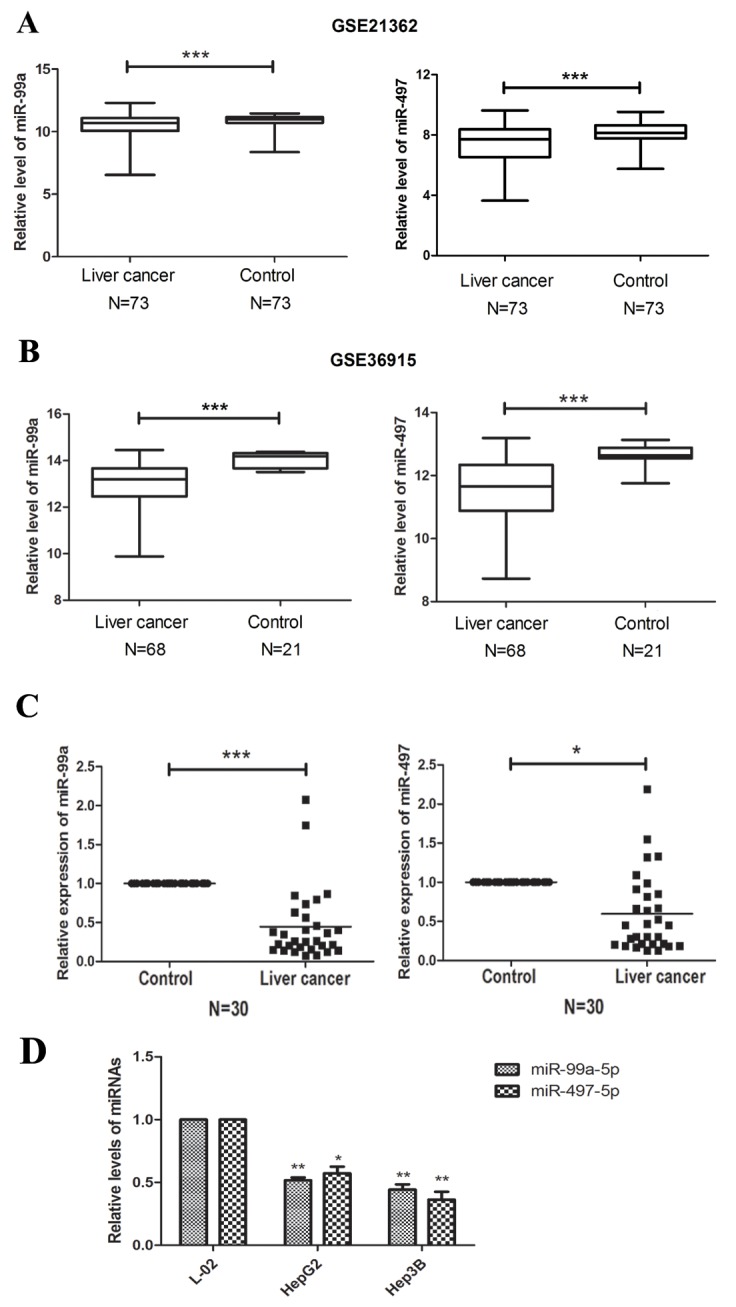
Figure 2. miR-99a and MiR-497 were down-regulated in HCC tissues and cell lines.

(A, B) Expression profiling of miRNAs showing that miR-99a and miR-497 were down-regulated in HCC tissues compared with non-cancerous liver tissues. The miRNA microarray data were obtained from NCBI, GEO database (Accession No: GSE21362 and GSE36915). The miRNA expression of HCC patients were illustrated by box plots. The median expression was indicated by horizontal line. (C) The qRT-PCR analysis for 30 paired HCC tissues and non-cancerous liver tissues. Both miR-99a and miR-497 were significantly down-regulated in HCC tissues compared to non-tumor tissues. (D) The qRT-PCR analysis of miR-99a and miR-497 for HCC cell lines (HepG2 and Hep3B) and liver normal cell lines (L-02). GAPDH was used as control. *P<0.05, **P<0.005, ***P<0.001, compared to control or L-02.
