Abstract
Label-free optical biosensors are powerful tools in drug discovery for the characterization of biomolecular interactions. In this study, we describe the use of four routinely used biosensor platforms in our laboratory to evaluate the binding affinity and kinetics of ten high-affinity monoclonal antibodies (mAbs) against human proprotein convertase subtilisin kexin type 9 (PCSK9). While both Biacore T100 and ProteOn XPR36 are derived from the well-established Surface Plasmon Resonance (SPR) technology, the former has four flow cells connected by serial flow configuration, whereas the latter presents 36 reaction spots in parallel through an improvised 6 x 6 crisscross microfluidic channel configuration. The IBIS MX96 also operates based on the SPR sensor technology, with an additional imaging feature that provides detection in spatial orientation. This detection technique coupled with the Continuous Flow Microspotter (CFM) expands the throughput significantly by enabling multiplex array printing and detection of 96 reaction sports simultaneously. In contrast, the Octet RED384 is based on the BioLayer Interferometry (BLI) optical principle, with fiber-optic probes acting as the biosensor to detect interference pattern changes upon binding interactions at the tip surface. Unlike the SPR-based platforms, the BLI system does not rely on continuous flow fluidics; instead, the sensor tips collect readings while they are immersed in analyte solutions of a 384-well microplate during orbital agitation.
Each of these biosensor platforms has its own advantages and disadvantages. To provide a direct comparison of these instruments' ability to provide quality kinetic data, the described protocols illustrate experiments that use the same assay format and the same high-quality reagents to characterize antibody-antigen kinetics that fit the simple 1:1 molecular interaction model.
Keywords: Biochemistry, Issue 122, optical biosensors, antibody-antigen interactions, binding kinetics, drug discovery, Surface Plasmon Resonance, BioLayer Interferometry
Introduction
The acquisition of reliable kinetic parameters for characterizing antibody-antigen interactions is an essential component of the drug discovery and development process1. Optical Surface Plasmon Resonance (SPR) biosensors, the "gold standard" for real-time detection of these interactions, have been used for approximately two decades to enable early selection of criteria-meeting therapeutic antibody candidates2,3. In addition to providing an affinity ranking of antibody candidates by the rapid binding screening of crude supernatants4, and rigorous kinetic constant determinations of purified preparations5, biosensors can further differentiate the functional activity of lead candidates via epitope binning studies6,7.
To meet the growing demand of antibody-based products for various therapeutic indications8, a wide variety of innovative biosensor instruments have been developed in recent years that increase the efficiency of candidate identification and characterization9,10. These instruments differ in microfluidic channel configuration design and/or in the optical principles involved in detecting biomolecular interactions. Specifically, the Octet RED38411, ProteOn XPR3612, and IBIS MX967 have expanded the number of interactions measured in a single binding cycle to 16, 36, and 96 respectively, representing significant throughput improvements over the traditional Biacore platform. Although these various biosensor platforms all provide essential kinetic data for characterizing antibody-antigen interactions, they differ in experimental setup and operational procedures due to variations in instrumental configurations. For example, in the IBIS MX96's SPR imaging array platform, the multiplex ligand immobilization step is performed in an off-line mode in an external printing device separate from the detector7,13; in contrast, the other three biosensor platforms utilize an "all-in-one" setup, where the addition of component onto the sensor surface, whether it is the activation reagent, ligand, or analyte, is recorded in real time and through pre-programmed commands in sequential order. In the Octet RED384, a unique feature of this BioLayer Interferometry (BLI)-based platform is the availability of pre-coated optical fiber biosensors for immediate "dip-and-read" use14, eliminating the need for ligand surface preparation and initiation/conditioning steps, which are often required for the sensor chips in SPR-based platforms. This instrument's fluidic-free design also simplifies the mechanics and avoids clogging and contamination concerns when dealing with crude samples. With the novel 6 x 6 crisscrossing fluidic design in the ProteOn XPR36, a "one-shot" kinetics approach can be implemented by switching the flow channels between horizontal and vertical directions to create 36 interaction spots15. Instead of assessing binding kinetics one ligand or analyte concentration at a time, as is done in the traditional serial flow Biacore T100 platform, this approach offers the ability to monitor up to 36 different interactions simultaneously in a single binding cycle.
Despite their differences, these four biosensor platforms are all widely used by many laboratories worldwide. For new users with little hands-on biosensor experience, deciding which instrument to use can be a challenging task given the differences in instrumental design. To determine the most appropriate instrument for their research purposes, factors such as data quality, performance consistency, throughput, ease of operation, and material consumption need to be considered collectively. While several benchmark studies have explored the variability of kinetic rate constants obtained from multiple laboratories and biosensors5,16, a recently published head-to-head comparison study further addresses the systematic factors that influence data reliability from the instrumental performance point of view17,18. The protocols supplied in this video focus on the experimental setup and procedures in detail, and are accompanied by the research article entitled, "Comparison of biosensor platforms in the evaluation of high affinity antibody-antigen binding kinetics"17. These protocols are intended not only to help new biosensor users implement these instruments for their research purposes, but also to provide additional insights for current biosensor users regarding technical challenges and considerations in experimental designs for evaluating high-affinity antibody-antigen interactions.
Protocol
1. Proteins and Antibodies
Produce and purify the human proprotein convertase subtilisin kexin type 9 (PCSK9) and ten mouse-derived anti-PCSK9 mAbs as previously described17.
Assess the purity of the purified products by sequentially injecting 10 µg of each sample into an analytical size exclusion (SEC) column using a UPLC system19.
2. Kinetic Measurements in the Biacore T100
- Instrument and Reagent Preparation
- Equilibrate the CM5 sensor chip at room temperature for 15 min.
- Thaw two 200 µL aliquots of 200 mM 1-ethyl-3-(3-dimethylaminopropyl)carbodiimide hydrochloride (EDC) and two 200 µL aliquots of 50 mM N-hydroxysuccinimide (NHS) at room temperature.
- Prepare a 1-L bottle of 1x HBS-EP (10 mM HEPES [pH 7.4], 150 mM NaCl, 3 mM EDTA, and 0.005% v/v polysorbate P20) running buffer by diluting a 10x HBS-EP+ stock solution in water.
- Prepare 1 mL of protein A/G at 30 µg/mL in 10 mM sodium acetate (pH 4.5) and 500 µL of each mAb sample at 0.063 µg/mL in the HBS-EP running buffer. Thaw a frozen vial of human PCSK9 on ice.
- In the control software, click "Tools | Eject Chip", place the sensor chip into the sheath and close. Click "Tools | Set Temperature", enter "25" °C as the analysis temperature and "10" °C as the compartment temperature.
- Surface Immobilization
- In the control software, click "File | Open/New Wizard Template" and select "Immobilization" from the list in the left-hand panel.
- Click "New" to enter the immobilization setup window. Choose "CM5" as the chip type and select "1" flow cell per cycle.
- Check the box next to each "Immobilize flow cell 1/2/3/4" to activate the options. Select "Aim for immobilized level" and "Amine" as the method for all flow cells.
- Enter "30 µg/mL ProA/G" as ligand, ensure that the target level is set to "10000" response units (RU) for all of the flow cells.
- Check "Prime before run", and click "Next". Select "Reagent Rack 2", define the location for the reagents and pipette into individual sample vials accordingly. Insert the rack back into the instrument, then click "Start" and enter an experiment name to be saved to start the run.
- Analyte Binding and Regeneration Cycles
- Click "File | Open/New Method", select "20140812 hu anti-PCSK9 IgGs binding to hu PCSK9" and open the method. Review the parameters in the method.
- In "Assay Steps", ensure there are 10 cycles in which "hu PCSK9" is the name with "Sample" selected in "Purpose". The replicate number is set to "1".
- In "Cycle Types", set the contact time to "220" s for Capture 1 over flow path "2", "110" s for Capture 2 over flow path "3", and "55" s for Capture 3 over flow path "4". The flow rate is "10" µL/min for all of the capture cycles.
- Select "Sample 1", check "Sample solution" as variable. Set the contact time to "600" s and the dissociation time to "2700" s over flow path "1, 2, 3, 4". The flow rate is set to "30" µL/min.
- Select "Regeneration 1", enter "Glycine-HCl pH 1.5" in the solution field and set the contact time to "20" s over flow path "1, 2, 3, 4".
- In "Variable Settings", enter 2-fold titrating concentrations of "100 nM - 6.25 nM" for Cycle 1-3, "50 nM - 3.12 nM" for Cycle 4-8, and "5 nM - 0.323 nM" for Cycle 9-10.
- In "Setup Run", choose the detection flow path "2-1, 3-1, 4-1", click "Next", check "Prime before run", and click "Next".
- Select "Sample and Reagent Rack 1", define the location for the reagents and pipette into individual sample vials accordingly. Insert the rack into the instrument, then click "Start" and enter an experiment name to be saved to start the run.
- Data Analysis Using BiaEvaluation
- Click "Kinetics/Affinity | Surface bound", choose Fc "2-1", "3-1", or "4-1" separately and check all of the displayed curves from the various analyte concentrations as well as the "zero" concentration blank.
- Click "Next" to obtain the buffer blank subtracted curves. Then click "Kinetics," choose the "1:1 Binding" model, and click "Fit" to obtain the fitted kinetic parameters.
- For the global fitting of multiple mAb surfaces, click "Multiple Rmax" at the bottom and add the binding curves from the other Fcs for the same mAb to the list.
- Click "Next" to obtain all of the buffer blank subtracted binding curves. Then click "Kinetics," choose "1:1 Binding" model, and choose "fit local" for each Rmax in the parameters to obtain the globally fitted kinetic parameters.
3. Kinetic Measurements in the ProteOn XPR36
- Instrument and Reagent Preparation
- Equilibrate a GLM sensor chip and a 2-L bottle of PBS-T-EDTA (PBS [pH 7.4], 0.005% Tween-20, and 3 mM EDTA) running buffer at room temperature for 15 min.
- In the control software, click "Eject" and then insert the GLM chip. Set the chip temperature to "25" °C and the autosampler temperature to "10" °C. Click "Glycerol Initialization" and follow the prompted instructions to initialize the chip.
- Click "File | Open" a preconditioning protocol from the list, prepare solutions into a 96-well plate. Then click "Run", select the protocol and click "Start".
- Thaw one 1 mL aliquot of 400 mM EDC and one 1 mL aliquot of 100 mM N-hydroxysulfosuccinimide (sulfo-NHS) at room temperature.
- Prepare 2 mL of protein A/G at 60 µg/mL in 10 mM sodium acetate (pH 4.5) and 500 µL of each mAb sample at 0.25 µg/mL, 0.125 µg/mL, and 0.063 µg/mL in the PBS-T-EDTA running buffer. Thaw a frozen vial of human PCSK9 on ice.
- Immobilization, Analyte Binding and Regeneration
- Click "File | New | New Protocol". In "Configuration", enter the experiment name, select "GLM" chip, select "Microplates", and enter "2.2" mL volume.
- Select "Protocols | Samples", define "EDC/sulfo-NHS" as "Activator" in wells H1-H6, "Protein A/G" as "Ligand" in G1-G6, "Ethanolamine" as "Deactivator" in F1-F6, "Glycine" as "Regenerator" in E1-E6, PBS-T-EDTA" as "Blank" in D1-D6, "mAb X sample" as "ligand" in C1-C6, and "human PCSK9" as "Analyte in wells H1-H6 in a second 96-well plate.
- Select "Steps", double click "Immobilization" in the "Protocol Editor", the steps include three subsequent horizontal injections of EDC/sulfo-NHS, protein A/G, and 1 M ethanolamine each at a flow rate of "30" µL/min and a contact time of "300" s.
- Click "Regenerate", inject three "18"-s pulses of glycine (pH 1.5) at "100" µL/min in both the horizontal and vertical directions, followed by two "60"-s pulses of PBS-T-EDTA at "25" µL/min also in both directions.
- Click "Ligand", inject mAb 1 mAb 2 in the vertical direction using a flow rate of "25" µL/min and a contact time of "160" s.
- Click "Analyte", inject five concentrations of human PCSK9 (100 nM to 6.25 nM in 2-fold serial dilutions) and a blank buffer over 6 horizontal channels simultaneously, at "40" µL/min for "600" s of association time followed by "2700" s of dissociation time.
- Click "Regenerate", inject two "18"-s pulses of glycine (pH 1.5) at "100" µL/min in both the horizontal and vertical directions.
- Repeat the above steps after each binding cycle for the remaining mAbs. NOTE: In addition to the 100 nM - 6.25 nM human PCSK9 concentration series, 25 nM - 1.56 nM and 5 nM - 0.313 nM concentration series are used.
- Prepare the samples and reagents in two 96-well plates according to the reagent positions defined in step 3.2.2, then click the "Run" tab, select the protocol/experiment and click "Start".
- Data Analysis Using ProteOn Manager
- Click "Panel Type" and select "Analyte". Then click "Protocol Step" and select all the binding curves in the list.
- Click "Auto Process", and click "Process | Channel Reference | Interspot". Then click "Process | Double Reference | Row | A6".
- Click "Create Dataset" to save individual datasets for each mAb at all three surfaces for kinetic analysis.
- Click "Analysis Dataset", highlight each mAb dataset and click "Analysis | Kinetic". Choose "Langmuir" model and "Simultaneous ka/kd" and click "Next".
- Highlight both the association and dissociation fit range, choose "Local" Rmax, and click "Next" to perform the fit to obtain the fitted kinetic parameters.
- Repeat the above step but choose "Grouped" Rmax for the fitting to obtain the experimental Rmax values for calculating the ligand surface activity.
4. Kinetic Measurements in the Octet RED384
- Reagent and Sample Plate Preparation
- Prepare 50 mL of 1x KB (Kinetic Buffer containing PBS pH [7.4], 0.02% Tween-20, 0.1% albumin, and 0.05% sodium azide) by diluting a 10x stock solution in PBS.
- Dispense the 1x KB into a 96-well plate at 200 µL per well. Hydrate 48 anti-human capture (AHC) biosensor tips in these individual wells for at least 10 min.
- Prepare each mAb sample at 20 µg/mL, 10 µg/mL, and 5 µg/mL in 1x KB, as well as human PCSK9 at 7 titrated concentrations from 100 nM to 1.56 nM in 2-fold serial dilutions.
- Load the mAb samples into a 384-well tilted-bottom microplate (referred to as the Reagent Plate) and the human PCSK9 solutions into another 384-well microplate (referred to as the Sample Plate) at 90 µL per well.
- Load series of 1x KB and glycine (pH 1.5) solutions in wells within the Sample Plate. NOTE: These 1x KB wells are used for chip preconditioning, baseline stabilization, and analyte dissociation. The glycine solution is used for regeneration.
- Experimental Method Setup
- In the data acquisition software, click "Experiment | New Experiment Wizard | New Kinetics Experiment | Basic Kinetics".
- In "Plate Definition", follow the steps below to define the sample types and positions.
- Select "16" channels and "384-well" format.
- Define the sample and reagent locations in the plate display by holding down the Shift key while left-clicking at the well to highlight 16 wells at a time.
- Right click on the wells containing the mAb samples and select "Load" to signify the step at which the mAbs are loaded (or captured) onto the AHC sensors. Enter the mAb names and concentrations in the table on the right side.
- Right click on the wells containing the human PCSK9 and select "Sample" to indicate the step at which the mAb-captured sensors are dipped and the binding interactions are measured. Enter the corresponding molar concentrations in the table on the right side.
- Define the wells containing 1x KB as "Buffer" or "Neutralization", and the wells containing glycine as "Regeneration".
- In "Assay Definition", follow the steps below to define the experimental setup:
- Click "Add" and select "Baseline", "Regeneration", "Equilibration", "Loading", "Association", and "Dissociation" steps to the list with times of "30" s, "30" s, "18" s, "200" s, "500" s, and "1800" s, respectively. The shake speed is "1000" rpm.
- To add the steps to "Assay Steps List", first click on a step, then click on the wells located in either the sample or the reagent plate. The steps are as follows:
- Equilibration-Regeneration: precondition the AHC sensors by three cycles of "15"-s dips in glycine (pH 1.5), alternating with "15"-s dips in 1x KB.
- Loading: capture the mAb samples onto the AHC sensors for "200" s.
- Baseline: establish the BLI signal for "60" s before the association step.
- Association: dip the sensors into wells containing varying concentrations of human PCSK9 for a "500"-s association period.
- Dissociation: dip the PCSK9-bound sensors into new wells of 1x KB for an "1,800"-s dissociation period.
- Regeneration: dip the mAb-PCSK9 bound sensors into wells of glycine (pH 1.5) with two "18"-s pulses between each binding cycle.
- In "Review Experiments", slide through the steps and make changes as necessary by going back to the previous tabs.
- In "Run Experiments", enter a "60" s delay time and shake the sample plate while waiting. Set the plate temperature to "25" °C and press "GO."
- Data Analysis Using ForteBio's Data Analysis Software
- Click "Data Selection | Loaded Data | Kinetics | PCSK9 antibodies binding to PCSK9 7.23.14"
- In "Processing", process the data as follows:
- In Step 1: click "Sensor Selection" to highlight sensors in H1-H6, right click on them and click "Change Sensor Type | Reference Sensor."
- In Step 2, check "Subtraction" and select "Average Reference Sensors" to subtract each active sample sensor from the average of the 6 blank buffer sensors.
- In Step 3, click "Align Y Axis" and select "Baseline" to align all the binding curves to the baseline step prior to association.
- In Step 5, check "Savitsky-Golay Filtering" to smooth the binding curves by increasing the signal-to-noise ratio, and click "Process Data!".
- In Step 6, click "Processed Results" to view the processed binding curves.
- In Step 7, review the four panels on the right displaying the binding curves after each processing step, and click "Save Processed Data".
- In "Analysis", check "Association and Dissociation" and choose "1:1" model.
- Highlight the binding curves for "Global (full)" fit and group them by "color". Use "Rmax linked" to perform the group fitting on sensors coated with the same mAb concentration to obtain the experimental Rmax values for calculating the ligand surface activity, and "Rmax unlinked by sensor" to perform global fitting on sensors coated with multiple mAb concentrations.
- Click "Fit Curves" to obtain the fitted kinetics parameters. Save the results at the end of each fitting analysis.
5. Kinetic Measurements in the IBIS MX96
- Instrument and Reagent Preparation
- Equilibrate a COOH-G chip at room temperature for 15 min.
- Prepare a 1-L bottle of system's running buffer (PBS [pH 7.4], 0.01% Tween-20) and the immobilization buffer (10 mM sodium acetate [pH 5.0], 0.01% Tween-20).
- Prepare each mAb from 20 µg/mL to 0.16 µg/mL by 2-fold serial dilutions in both the system running buffer and the sodium acetate (pH 5.0) immobilization buffer.
- Dispense the mAb samples into two separate 96-well plates in which each mAb occupies 8 vertical wells in the titration concentrations at 200 µL per well.
- Thaw aliquots of 400 mM EDC and 100 mM sulfo-NHS at room temperature.
- Prepare 300 µL of protein A/G at 50 µg/mL in the sodium acetate (pH 5.0) immobilization buffer and pipette it into a vial.
- Prepare 200 µL of human PCSK9 from 100 nM to 0.39 nM by 2-fold serial dilutions in the system running buffer. Pipette them into separate vials.
- Multi-cycle kinetics with amine-coupled antibody arrays
- Mix the EDC/sulfo-NHS (400 mM/100 mM) aliquots and dispense the mixture into the top 48 wells of a new 96-well plate at 200 µL per well.
- Place the mAb source plate (diluted in sodium acetate [pH 5.0]) in position 2 and the EDC/sulfo-NHS reagent plate in position 1 inside the printer.
- Install the sensor chip into the CFM. Open the "CFM 2.0" software, then click "Load Settings | 96 Amine Couple". The 10 x 8 antibody array is created as follows:
- Deliver the EDC/sulfo-NHS in the top half of the reagent plate to the sensor using 48 microchannels, and cycle them over the sensor surface for "5" min.
- Deliver the mAb samples in the top half of the source plate to the sensor and cycle them across the activated surfaces for "10" min.
- Deliver the immobilization buffer from a 50-mL conical tube over the antibody surface for "5" min.
- Repeat the above procedures for the remaining mAb samples in the bottom half of the source plate.
- Dock the printed sensor chip into the instrument. In the control software, click "File | Connect | Open Measurement | Existing Measurement" and select "2014-08-15".
- In "General", select "G - System Prime" under "Full system script". Then select "G - Quench" to deactivate the mAb surfaces by injecting 150 µL 1 M ethanolamine.
- Click "Camera" to visualize the mAb arrays and adjust the contrast if necessary. Position the red square boxes to surround the mAb spots, and move the green square boxes to the interspots located between the active mAb spots for referencing.
- In "Analysis Cycle", select "A - AP Standard Run" under "IBIS Scripts". Set 1.0 min for baseline, 10.0 min for association, and 90 steps for dissociation at 8 µL/s speed.
- Inside the "Cycles", inject human PCSK9 one concentration at a time following five buffer injections. Regenerate the mAb surfaces with glycine pH 2.0 between each binding cycle.
- Single-cycle kinetics with Fc-captured antibody arrays
- Install a new sensor chip into the CFM. Repeat steps 5.2.3 to 5.2.5 above by replacing the mAb samples with protein A/G.
- Remove the sensor chip from the MX96 and insert it back into the CFM printer.
- Deliver the mAbs in the top half of the plate to the protein A/G sensor surface using 48 microchannels, and cycle them across the surface using bidirectional flow for 10 min.
- Repeat the above step for the remaining mAb samples in the bottom half of the plate.
- Dock the printed sensor chip into the MX96 instrument. In the Data Acquisition Software, click "File | Connect | Open Measurement | Existing Measurement | Next" and select "Protein A+G binding kinetic7.30.14".
- Click "camera" to visualize the mAb arrays and adjust the contrast if necessary. Position the red square boxes to surround the mAb spots, and move the green square boxes to the interspots located between the active mAb spots for referencing.
- In "Analysis Cycle", select "A - AP Standard Run" under "IBIS Scripts". Set "1.0 min" for baseline, "10.0 min" for association, and "10" steps for dissociation at "8 µL/sec" speed.
- Inside the "Cycles", inject human PCSK9 one concentration at a time following five buffer injections. No regeneration is performed between each analyte injection.
- Data Analysis Using SPRint and Scrubber
- In the SprintX sofware, click "File | Open Triangle File", select all the sample injections in the list, and check "Save SprintX file," "Calibration", and "RLL determination" before clicking "Analyze." NOTE: The RLL values refer to the immobilized / captured mAb levels on the sensor surface.
- Check "Referencing" and select "Local" to use the adjacent reference spots. Also check "Align" on the first injection and then click "Start Automation."
- In the Serial tab, select "Show rulers in the toolbar," adjust them to select a small region of the baseline immediately prior to the first sample injection, and select "Zero."
- Generate an .IBMX file for analysis in the Scrubber by selecting "Export to ibmx file" and then click "Start Automation."
- Launch Scrubber and load the .IBMX file. Enter "100n" as the "Stock conc" and "2" as the "Dilution factor".
- Crop data, remove all baseline prior to the start of injection, and align the binding curves at the start of association. NOTE: For the single-cycle kinetics experiment, do not align the curves.
- Go to the "Kinetics" tab, adjust the ruler for the injection end time, select "kd" and fit, then "fix kd." Select "kakd" and fit it again.
- Float the kd column and fit again to further refine the fit. NOTE: For the fitting of single-cycle binding curves, click "Opts" and deselect "Subtract," then select "Separate" and float the "Begin Inj" column to fit the association profiles back to a theoretical baseline origin.
- Review the fitted kinetics parameters in the Results tab.
Representative Results
Figure 1 shows the antibody array image from the CFM and the spotted mAb levels by the two immobilization methods, and Figure 2 shows the corresponding binding sensorgrams generated in the MX96 from the multi-cycle kinetic and the single-cycle kinetic measurements on these mAb arrays. The real-time binding and kinetically fitted curves from multiple antibody-coated surfaces generated in the four biosensor platforms are shown in Figures 3 - 6. Figure 7 shows the comparison of the final kinetic rates and equilibrium binding constants obtained from the global analysis of these binding curves. The individual association (ka), dissociation (kd), and equilibrium (KD) binding constants are presented in Table 1. To demonstrate the variability of datasets generated within the same instrument, Figure 8 shows plots of ka, kd, and KD at different mAb surface densities, and Figure 9 further compares the calculated binding activities of the mAb surfaces across the biosensor platforms.
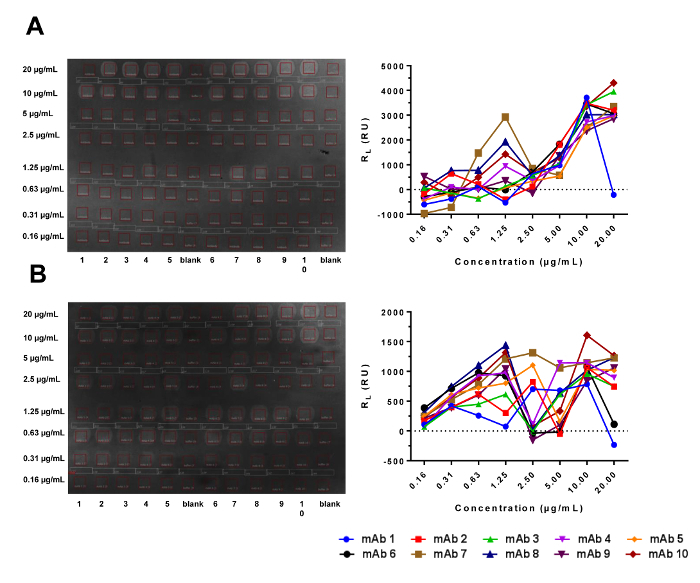 Figure 1. Multiplex Ligand Arrays of Amine-coupled (A) and Fc-captured (B) Antibody Surfaces from CFM Printing in the IBIS MX96. Images of the printed arrays are shown in the left panels, where the grey areas enclosed by red squares indicate the presence of antibody. The darker interspots located between the active antibody spots are used for reference subtraction. Each column contains an antibody printed at the titration concentrations identified below and to the left of the image. The amounts of the printed antibodies quantified by calculating the difference in bulk shifts between the active and reference locations are shown in the right panels. Please click here to view a larger version of this figure.
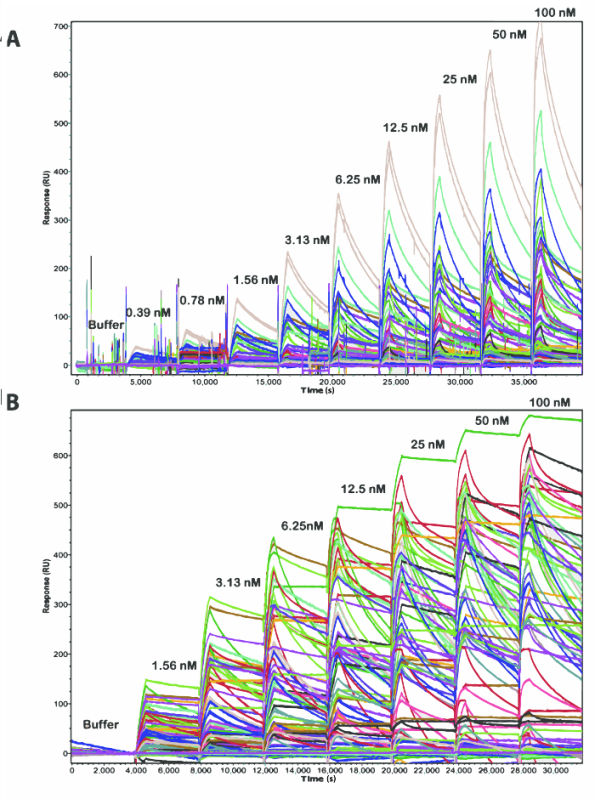 Figure 2. Comparison of Real-time Binding Sensorgrams from Multi-cycle (A) and Single-cycle (B) Kinetic Experiments in the IBIS MX96. The sequential injections of human PCSK9 at increasing concentrations across the 10 x 8 antibody arrays are noted above each corresponding sensorgram segment. Please click here to view a larger version of this figure.
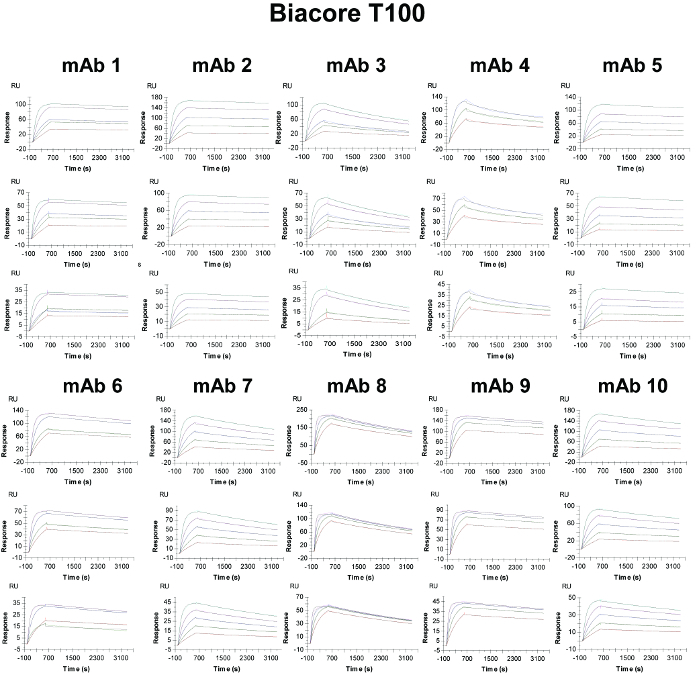 Figure 3. Binding Sensorgrams of the Captured Antibodies Interacting with Human PCSK9 and 1:1 Kinetic Model Fit Overlays in the Biacore T100. The interactions are evaluated over high- (top panels), medium- (middle panels), and low- (bottom panels) density surfaces. The overlaid smooth black lines represent the kinetic fit of the binding response signals at different human PCSK9 concentrations (colored lines) to a 1:1 interaction model. Please click here to view a larger version of this figure.
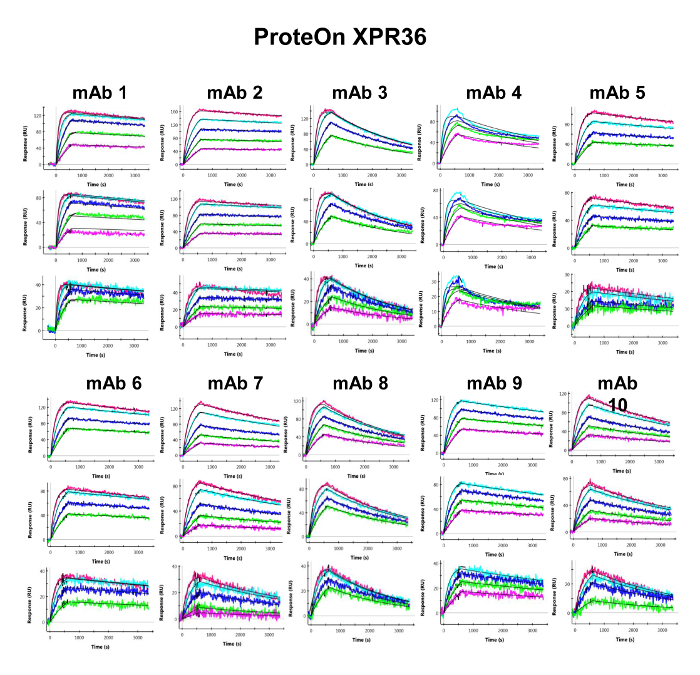 Figure 4. Binding Sensorgrams of the Captured Antibodies Interacting with Human PCSK9 and 1:1 Kinetic Model Fit Overlays in the ProteOn XPR36. The interactions are evaluated over high- (top panels), medium- (middle panels), and low- (bottom panels) density surfaces. The overlaid smooth black lines represent the kinetic fit of the binding response signals at different human PCSK9 concentrations (colored lines) to a 1:1 interaction model. Please click here to view a larger version of this figure.
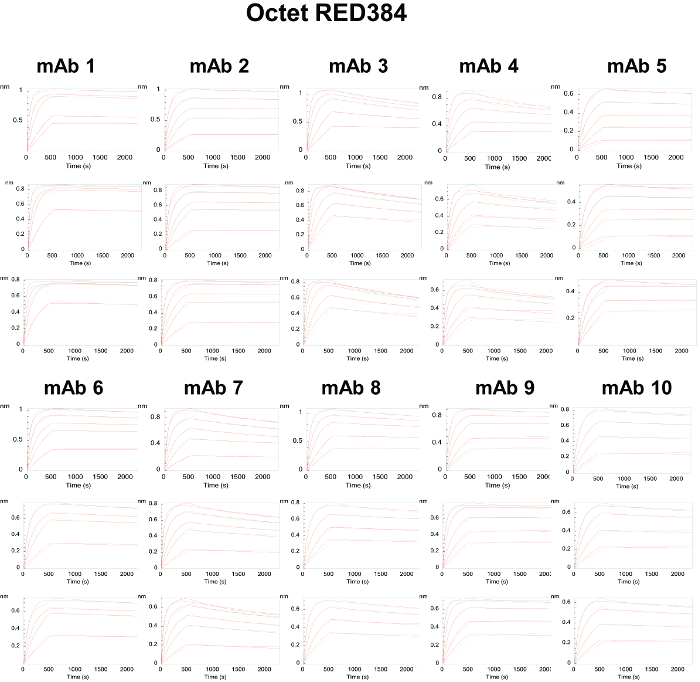 Figure 5. Binding Sensorgrams of the Captured Antibodies Interacting with Human PCSK9 and 1:1 Kinetic Model Fit Overlays in the Octet RED384. The interactions are evaluated over high- (top panels), medium- (middle panels), and low- (bottom panels) density surfaces. The overlaid red lines represent the kinetic fit of the binding response signals at different human PCSK9 concentrations (colored lines) to a 1:1 interaction model. Please click here to view a larger version of this figure.
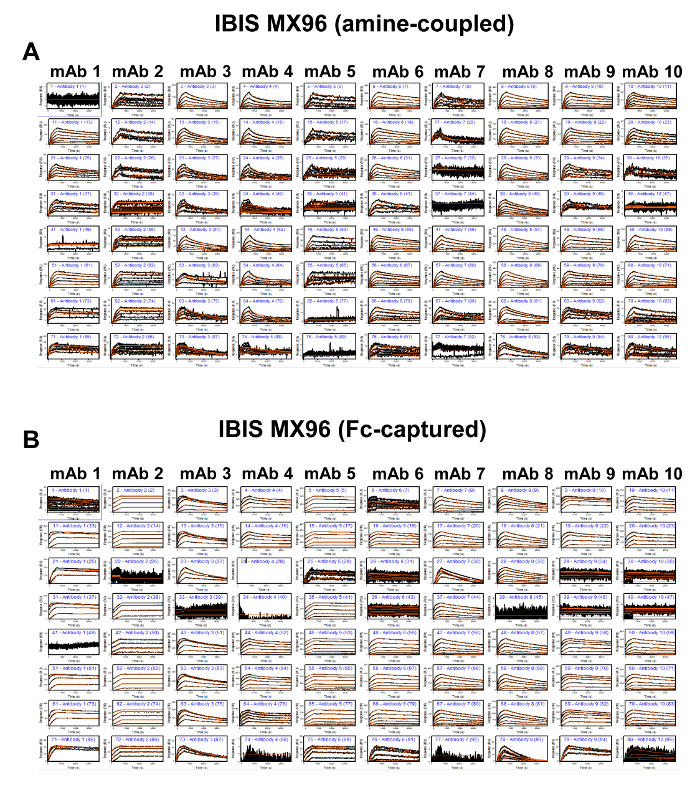 Figure 6. Binding Sensorgrams of the Amine-coupled (A) and Fc-captured (B) Antibodies Interacting with Human PCSK9 and 1:1 Kinetic Model Fit Overlays in the IBIS MX96. The binding profiles are organized as 10 x 8 panels that follow the array plate map in Figure 1. The black lines represent the recorded binding response signals at different human PCSK9 concentrations, and the overlaid red lines represent the fitted curves. Please click here to view a larger version of this figure.
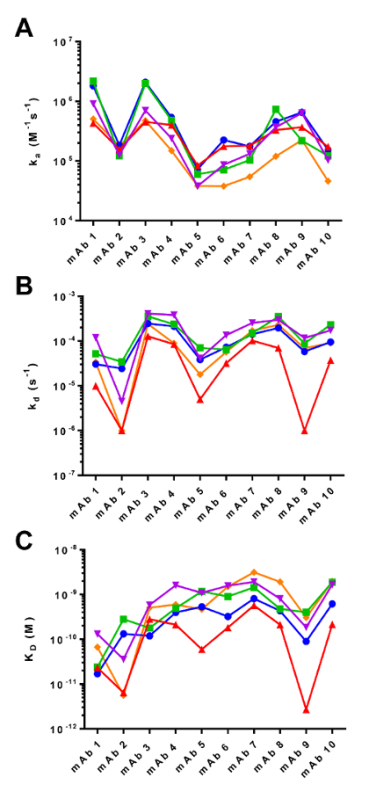 Figure 7. Comparison of the Association ka (A), Dissociation kd (B), and Equilibrium KD (C) Binding Constants Generated by the Four Biosensor Platforms. The kinetic parameters are derived from global analysis of the binding curves in Figures 3 - 6. The instruments are represented as follows: Biacore T100 (blue), ProteOn XPR36 (green), Octet RED384 (red), IBIS MX96, amine-coupled (purple), and IBIS MX96, Fc-captured (orange). Please click here to view a larger version of this figure.
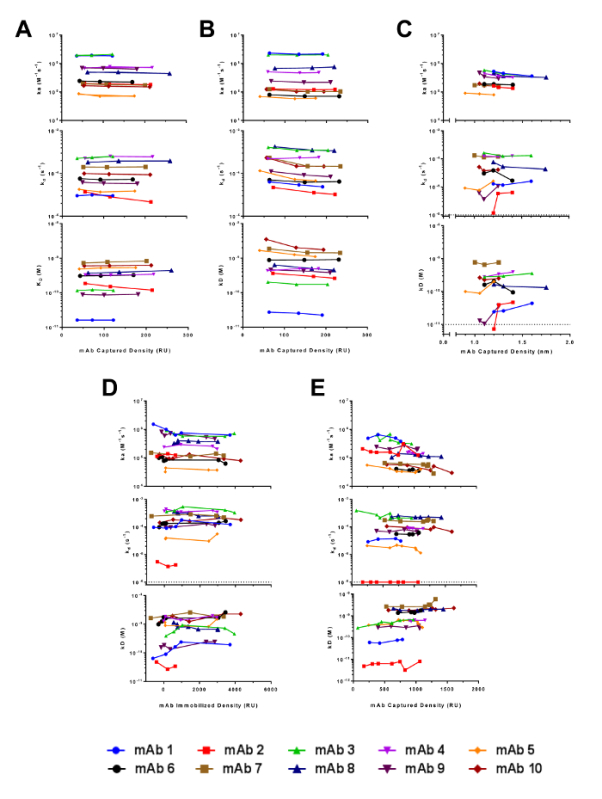 Figure 8. Comparison of the Consistency of Kinetic Rate Constants Over Multiple Antibody Surface Densities in the Biacore T100 (A), ProteOn XPR36 (B), Octet RED384 (C), IBIS MX96, amine-coupled (D), and IBIS MX96, Fc-captured (E). The kinetic parameters ka (top sub-panels), kd (middle sub-panels), and KD (bottom sub-panels) are derived from group analysis at individual antibody surface density. Please click here to view a larger version of this figure.
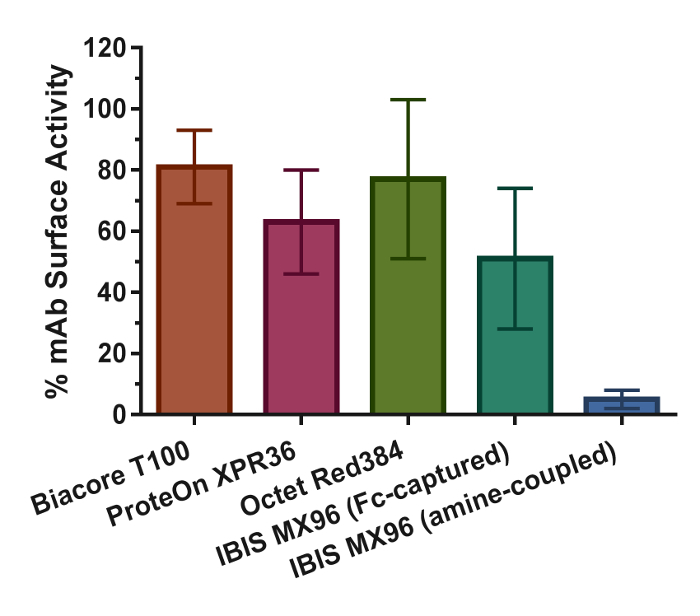 Figure 9.Binding Activities of the Antibody Surfaces and Their Standard Deviations (error bars) in the Four Biosensor Platforms. The values are calculated using equations described in the research articles17. Please click here to view a larger version of this figure.
| ka | kd | KD | |
| (M-1s-1) | (s-1) | (nM) | |
| mAb 1 | 11.7 (7.8) x 105 | 4.89 (4.18) x 10-5 | 0.052 (0.05) |
| mAb 2 | 1.53 (0.28) x 105 | 1.30 (1.54) x 10-5 | 0.092 (0.12) |
| mAb 3 | 11.4 (8.3) x 105 | 27.6 (11.0) x 10-5 | 0.333 (0.20) |
| mAb 4 | 3.61 (1.6) x 105 | 20.1 (12.3) x 10-5 | 0.659 (0.54) |
| mAb 5 | 0.59 (0.21) x 105 | 3.46 (2.50) x 10-5 | 0.663 (0.46) |
| mAb 6 | 1.19 (0.78) x 105 | 7.21 (3.83) x 10-5 | 0.894 (0.64) |
| mAb 7 | 1.29 (0.53) x 105 | 16.4 (5.63) x 10-5 | 1.57 (1.02) |
| mAb 8 | 4.02 (2.23) x 105 | 22.8 (10.7) x 10-5 | 0.768 (0.68) |
| mAb 9 | 4.20 (2.13) x 105 | 6.67 (4.3) x 10-5 | 0.197 (0.16) |
| mAb 10 | 1.20 (0.49) x 105 | 12.5 (7.64) x 10-5 | 1.27 (0.80) |
Table 1: Kinetic Rates and Equilibrium Binding Constants of 10 mAbs Obtained by Global Fitting of Binding Curves from Four Biosensor Instruments to the 1:1 Interaction Model.
Discussion
Our head-to-head comparison study shows that each biosensor platform has its own strengths and weaknesses. Even though the binding profiles of the antibodies are similar by visual comparison (Figures 3 - 6), and the rank order of the acquired kinetic rate constants are highly consistent across the instruments (Figure 7), our results show that SPR-based instruments with continuous flow fluidics) are better at resolving high-affinity interactions with slow dissociation rates. Upward drift during the dissociation phase is observed in datasets (e.g., mAb 2, mAb 5, and mAb 9; Figure 5) generated by the BLI fluidics-free instrument. This finding can be attributed in large part to sample evaporation over time in the microplate, which is a primary limitation of the system. With this inherent limitation, the experimental time is also restricted to less than 12 h; the experiments were therefore programmed with shorter times (500 s association and 30 min dissociation) compared to those of the other platforms (10 min association and 45 min dissociation). However, shortening the experimental time did not appear to mitigate the impact of evaporation on data quality/consistency, as the rate constants generated by the BLI-based instrument show less linearity as a result of fluctuations in some of the off-rates (Figure 8C). In addition to sample evaporation, differences in the capture reagents used may have also contributed to the differences in the results obtained. While protein A/G was used in all three fluidics-based SPR platforms, AHC sensors were used in the non-fluidics BLI platform. Since protein A/G is likely to have a weaker affinity for the mAbs than does the AHC, an antibody-based biosensor surface, the off-rates of the mAb-antigen complex from the protein A/G surfaces may artificially appear faster than those obtained from the AHC surface. This possibility is supported by the experimental data showing that the off-rate values generated by the BLI platform were consistently lower than those obtained from the other instruments (Figure 7, red line). Nevertheless, the BLI platform has different advantages over the other platforms. For example, it is highly flexible with regard to sensor choice and assay configuration due to the various pre-coated sensors for immediate use. In our experiments, use of the AHC sensors eliminated the need for ligand immobilization steps, reducing the preparation time. Furthermore, the BLI platform requires much less maintenance compared to the other fluidics SPR platforms, which feature complicated tubing and value switch configurations. This feature is an advantage for experiments involving crude samples that can cause clogging and contamination issues.
As the demand for the efficient, rapid, and accurate identification of therapeutic candidates increases, the need for biosensor throughput is also rising. Among the four biosensor platforms, the throughput from the biosensor capable of 96-ligand array printing is the highest, followed by the biosensor coupled to a crisscrossing 36-ligand format and the BLI-based biosensor with 16-channel simultaneous readout, which ultimately increase the number of interactions measured in a single binding cycle to 96, 36 and 16, respectively. These throughput capabilities are significantly higher than that of the traditional SPR platform, which is limited by having only four flow cells connected by a single serial flow. Since our experiments involved a relatively small sample set of 10 mAbs evaluated at multiple surface densities with long dissociation times, the instrumental throughputs played a moderate role in determining the efficiency of the experiments. There were no significant differences in the experimental times of the three high-throughput platforms, and in all cases the experiments were completed in one day. On the other hand, the traditional serial flow SPR experiments required 3 days to complete, despite the walk-away automation of data acquisition after setup. In other studies that involve a large number of samples (i.e. in the hundreds or thousands), for off-rate ranking/kinetic screening or epitope binning purposes, the throughput becomes a critical factor.
Although the throughput in the IBIS MX96 is orders of magnitude higher than that of the other biosensors and is therefore an optimal choice for these purposes, it has a few shortcomings. In particular, the array printing by the CFM shows large surface inconsistencies (Figure 1) and reduced data reproducibility (Figure 8D and 8E). For accurate kinetic measurements, the amount of ligand on the biosensor surface is a critical parameter that needs to be controlled to ensure that the binding responses are not disturbed by secondary factors such as mass transfer or steric hindrance. For the Biacore T100 and ProteOn XPR36, the optimal RL levels were determined based on the standard calculation of set Rmax values as described in the research article17. On the other hand, for the Octet RED384 and IBIS MX96 platforms, the mAb capture levels were attained empirically using a series of 2-fold serially diluted antibodies at constant times. The lack of knowledge or control of the capture step resulted in a high-density surface and high binding response signals (Figure 2) that may have compromised the accuracy of the kinetic rate constants. Furthermore, the separation of the printer from the SPR detector also presents a challenge when conducting multiple binding cycle measurements involving regenerations. The only way to perform the multi-cycle kinetics setup was through direct amine coupling of the mAbs, as opposed to capture through the mAb Fc by the immobilized protein A/G surface in the other three biosensor platforms. As a result, an additional regeneration scouting experiment was required to determine the optimal regeneration conditions. The outcome of this setup was linked to a ~90% lower observed surface activity compared to the Fc capture method (Figure 9), in addition to a longer experimental time. To execute the Fc capture method, an alternative single-cycle kinetic approach was adopted. This approach involves the sequential injection of analyte at increasing concentrations without regeneration between each injection (Figure 2). This highly convenient, but less commonly applied approach not only shortened the experimental time and reduced reagent consumption, but also produced kinetic rate constants highly similar to those from the other biosensors (Figure 7). Therefore, applying this single-cycle kinetics approach overcomes the inherent configuration limitation of the instrument and presents an opportunity for obtaining high-resolution kinetic rate constants in a high-throughput manner.
Despite the throughput being a major limitation in the Biacore T100, our results collectively show that it generated the most consistent data with the highest quality. This was followed by the ProteOn XPR36, which has ~ 10-fold higher throughput. Their ability to generate high-quality data becomes an advantage when characterizing high-affinity antibody-antigen interactions that can be technically challenging when the instruments' detection limits are reached. While the systematic limitations in instrumentation of the Octet RED384 hinder the accurate measurement of dissociation rate constants (i.e., falling short of the sensitivity to resolve sufficient signal decay for slow off-rates), both the Biacore T100 and ProteOn XPR36 can provide sensitive and reliable detection for differentiation.
Disclosures
Publication fees for this video-article were paid by Boehringer Ingelheim Pharmaceuticals.
Acknowledgments
The authors thank Noah Ditto and Adam Miles for technical assistance on the IBIS MX96.
References
- Cooper MA. Optical biosensors in drug discovery. Nat Rev Drug Discov. 2002;1(7):515–528. doi: 10.1038/nrd838. [DOI] [PubMed] [Google Scholar]
- Van Regenmortel MH, et al. Measurement of antigen-antibody interactions with biosensors. J Mol Rec. 1998;11(1-6):163–167. doi: 10.1002/(SICI)1099-1352(199812)11:1/6<163::AID-JMR414>3.0.CO;2-U. [DOI] [PubMed] [Google Scholar]
- Davidoff SN, Ditto NT, Brooks AE, Eckman J, Brooks BD. Surface Plasmon Resonance for Therapeutic Antibody Characterization. Label-Free Biosensor Methods in Drug Discovery. 2015. pp. 35–76. Available from: http://link.springer.com/10.1007/978-1-4939-2617-6_3.
- Canziani GA, Klakamp S, Myszka DG. Kinetic screening of antibodies from crude hybridoma samples using Biacore. Anal Biochem. 2004;325(2):301–307. doi: 10.1016/j.ab.2003.11.004. [DOI] [PubMed] [Google Scholar]
- Katsamba PS, et al. Kinetic analysis of a high-affinity antibody/antigen interaction performed by multiple Biacore users. Anal Biochem. 2006;352(2):208–221. doi: 10.1016/j.ab.2006.01.034. [DOI] [PubMed] [Google Scholar]
- Abdiche YN, Malashock DS, Pinkerton A, Pons J. Exploring blocking assays using Octet, ProteOn, and Biacore biosensors. Anal Biochem. 2009;386(2):172–180. doi: 10.1016/j.ab.2008.11.038. [DOI] [PubMed] [Google Scholar]
- Abdiche YN, et al. High-Throughput Epitope Binning Assays on Label-Free Array-Based Biosensors Can Yield Exquisite Epitope Discrimination That Facilitates the Selection of Monoclonal Antibodies with Functional Activity. PLoS ONE. 2014;9(3):e92451. doi: 10.1371/journal.pone.0092451. [DOI] [PMC free article] [PubMed] [Google Scholar]
- Ecker DM, Jones SD, Levine HL. The therapeutic monoclonal antibody market. mAbs. 2014;7(1):9–14. doi: 10.4161/19420862.2015.989042. [DOI] [PMC free article] [PubMed] [Google Scholar]
- Rich RL, Myszka DG. Higher-throughput, label-free, real-time molecular interaction analysis. Anal Biochem. 2007;361(1):1–6. doi: 10.1016/j.ab.2006.10.040. [DOI] [PubMed] [Google Scholar]
- Keighley W. The need for high throughput kinetics early in the drug discovery process. Drug Disc World. 2011;12(3):39–45. [Google Scholar]
- Lad L, et al. High-throughput kinetic screening of hybridomas to identify high-affinity antibodies using bio-layer interferometry. J Biomol Screen. 2015;20(4):498–507. doi: 10.1177/1087057114560123. [DOI] [PubMed] [Google Scholar]
- Bravman T, Bronner V, Nahshol O, Schreiber G. The ProteOn XPR36TM Array System-High Throughput Kinetic Binding Analysis of Biomolecular Interactions. Cell Mol Bioeng. 2008;1(4):216–228. [Google Scholar]
- Eddings MA, et al. Improved continuous-flow print head for micro-array deposition. Anal Biochem. 2008;382(1):55–59. doi: 10.1016/j.ab.2008.07.031. [DOI] [PubMed] [Google Scholar]
- Abdiche Y, Malashock D, Pinkerton A, Pons J. Determining kinetics and affinities of protein interactions using a parallel real-time label-free biosensor the Octet. Anal Biochem. 2008;377(2):209–217. doi: 10.1016/j.ab.2008.03.035. [DOI] [PubMed] [Google Scholar]
- Abdiche YN, Lindquist KC, Pinkerton A, Pons J, Rajpal A. Expanding the ProteOn XPR36 biosensor into a 36-ligand array expedites protein interaction analysis. Anal Biochem. 2011;411(1):139–151. doi: 10.1016/j.ab.2010.12.020. [DOI] [PubMed] [Google Scholar]
- Rich RL, et al. A global benchmark study using affinity-based biosensors. Anal Biochem. 2009;386(2):194–216. doi: 10.1016/j.ab.2008.11.021. [DOI] [PMC free article] [PubMed] [Google Scholar]
- Yang D, Singh A, Wu H, Kroe-Barrett R. Comparison of biosensor platforms in the evaluation of high affinity antibody-antigen binding kinetics. Anal Biochem. 2016;508:78–96. doi: 10.1016/j.ab.2016.06.024. [DOI] [PubMed] [Google Scholar]
- Yang D, Singh A, Wu H, Kroe-Barrett R. Dataset of the binding kinetic rate constants of anti-PCSK9 antibodies obtained using the Biacore T100 ProteOn XPR36, Octet RED384, and IBIS MX96 biosensor platforms. Data in Brief. 2016;8:1173–1183. doi: 10.1016/j.dib.2016.07.044. [DOI] [PMC free article] [PubMed] [Google Scholar]
- Bouvier ESP, Koza SM. Advances in size-exclusion separations of proteins and polymers by UHPLC. Trends Anal Chem. 2014;63:85–94. [Google Scholar]


