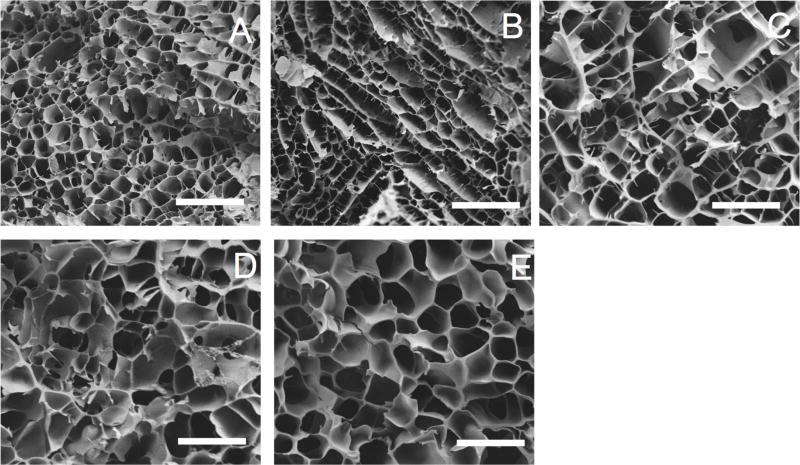
Figure 4.
Scanning electron micrographs of keratin gels. Each image is representative of the various formulations: (A) KOS (100:0 KOS:KTN) (B) 70:30 KOS:KTN. (C) 50:50 KOS:KTN. (D) 30:70 KOS: KTN. (E) KTN (0:100 KOS:KTN). Pore size and overall structure can be discerned. Images taken at 500X and 5kV. Scale bars represent 100 pm.

