Significance
In the somatosensory system, signals are transduced from peripheral sensors up to the cerebral cortex in a topographic manner, meaning that the relative spatial organization of the sensory receptors is represented by a map in the cortex. Because the somatosensory cortex is not the terminus of sensory signals, we investigated whether topographic maps are maintained beyond the cortex via cortical output pathways from thick-tufted layer 5B (L5B) neurons. We found that L5B neurons in the somatosensory cortex topographically target six separate subcortical nuclei with area-specific projection strength, map orientation, and topographic precision. Thus topographic organization persists beyond the primary cortex via the L5B pathway with target-specific precision.
Keywords: somatotopy, corticothalamic projections, whisker system, posterior medial thalamic nucleus, thalamus
Abstract
Neurons in cortical layer 5B (L5B) connect the cortex to numerous subcortical areas. Possibly the best-studied L5B cortico–subcortical connection is that between L5B neurons in the rodent barrel cortex (BC) and the posterior medial nucleus of the thalamus (POm). However, the spatial organization of L5B giant boutons in the POm and other subcortical targets is not known, and therefore it is unclear if this descending pathway retains somatotopy, i.e., body map organization, a hallmark of the ascending somatosensory pathway. We investigated the organization of the descending L5B pathway from the BC by dual-color anterograde labeling. We reconstructed and quantified the bouton clouds originating from adjacent L5B columns in the BC in three dimensions. L5B cells target six nuclei in the anterior midbrain and thalamus, including the posterior thalamus, the zona incerta, and the anterior pretectum. The L5B subcortical innervation is target specific in terms of bouton numbers, density, and projection volume. Common to all target nuclei investigated here is the maintenance of projection topology from different barrel columns in the BC, albeit with target-specific precision. We estimated low cortico–subcortical convergence and divergence, demonstrating that the L5B corticothalamic pathway is sparse and highly parallelized. Finally, the spatial organization of boutons and whisker map organization revealed the subdivision of the posterior group of the thalamus into four subnuclei (anterior, lateral, medial, and posterior). In conclusion, corticofugal L5B neurons establish a widespread cortico–subcortical network via sparse and somatotopically organized parallel pathways.
A common feature of sensory systems is the topographic organization of their ascending pathways from the sensors to the cortex. A prominent example of topographic projections is the rodent whisker system in which the arrangement of whisker follicles on the snout of the animal is mapped at each synaptic station up to the cortex, where the whisker map forms the cortical barrel field of rodents (1). Although this strict topographic organization is well established for the ascending pathway (2), the extent to which this map organization continues beyond the primary somatosensory cortex via descending projections to subcortical structures is less clear.
One major target of descending cortico-efferent projections is the thalamus, which is innervated by two distinct corticothalamic pathways. First, neurons in cortical layer 6 (L6) provide numerically large and somatotopically organized (3) feedback to the sensory thalamus. Secondly, layer 5B thick-tufted neurons (L5B) innervate exclusively higher-order thalamus with sparse but uniquely large driver synapses and unclear somatotopic organization (3–5). Probably the best-characterized example of a L5B target nucleus is the lateral part of the posterior group (PO) in the thalamus (POm), where cortical L5B neurons provide the dominant synaptic input (6, 7). Receptive field studies support somatotopic organization of the POm even though an anatomical whisker map has not been shown (8). L5B neurons also project to the ventral thalamus, midbrain, and brainstem (4, 5), but the organization of their projection fields is unknown. Here we investigated by quantitative anatomy whether cortico–subcortical projections to the thalamus and anterior midbrain are somatotopically organized.
We labeled barrel cortical boutons by dual-color anterograde tract tracing to reconstruct the 3D location of giant L5B boutons in the entire thalamus and the anterior midbrain. We found discrete bouton clouds in four areas of the dorsal thalamus, one in the ventral thalamus (zona incerta, ZI), and another in the anterior pretectum (APT). L5B projections to each of these areas were somatotopically arranged, thereby mapping the whisker pad to subcortical areas. The somatotopic precision, map orientation, and numbers of boutons were target-area specific and revealed the subdivision of the PO into four distinct L5B target nuclei.
Results
Labeling of L5B Neurons and Boutons.
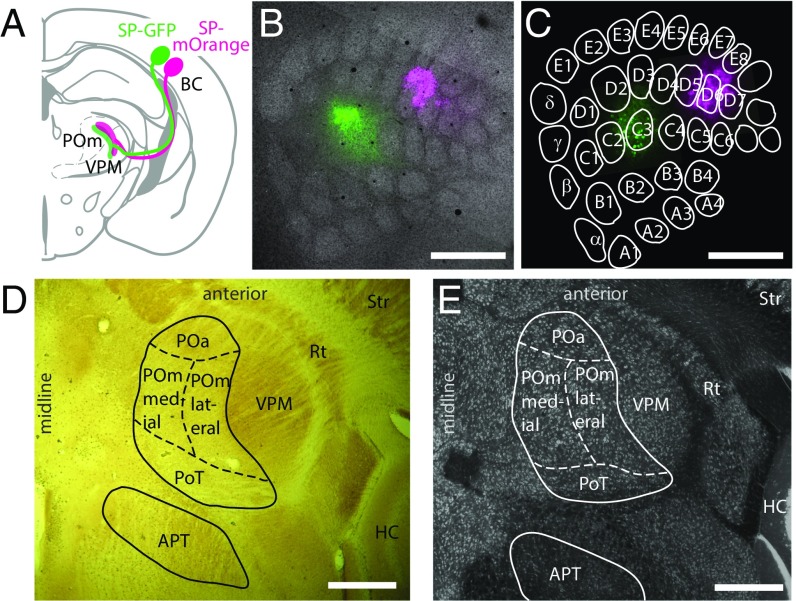
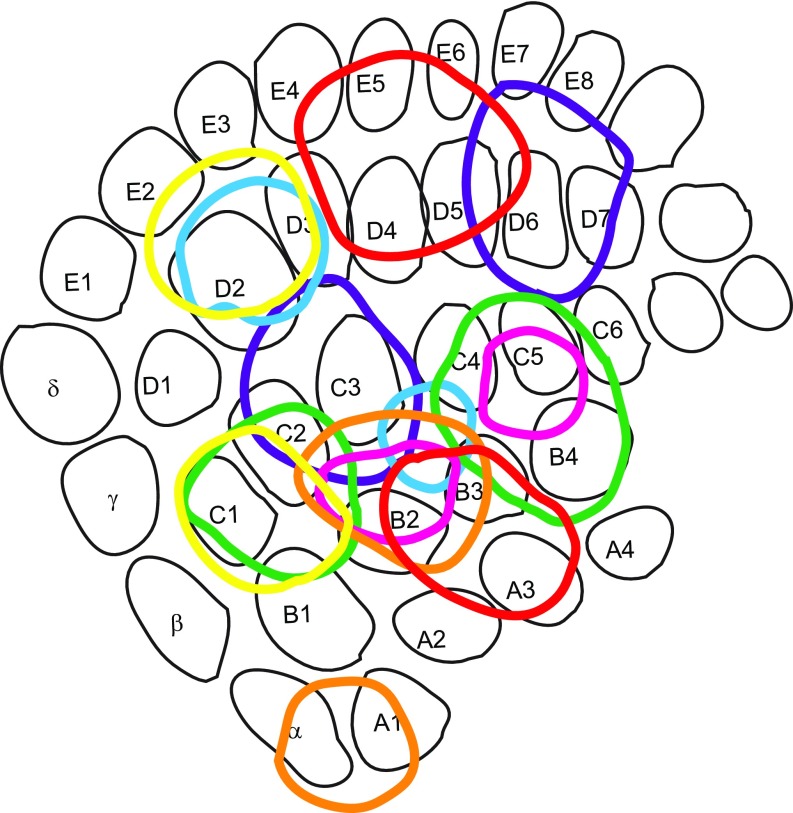
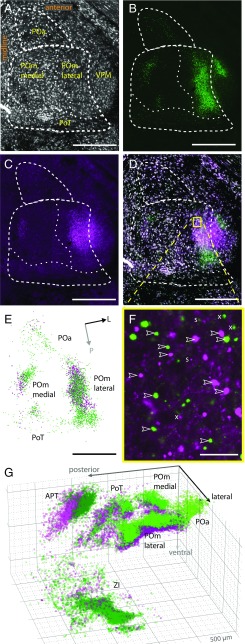
We labeled cortico–subcortical boutons by depositing two different adeno-associated virus (AAV) constructs in the barrel cortex (BC) of seven mice (Fig. 1 A–C and Fig. S1). Transfected cells expressed the presynaptic marker Synaptophysin fused to either GFP or mOrange (Fig. 1C) (9). Deposits were targeted to L5 and labeled on average 91 [median; first quartile (Q1): 50; third quartile (Q3): 141] L5B neurons in 3 (Q1: 2; Q3: 4) barrel columns. Dual virus deposits were always nonoverlapping, with their borders being 260 µm apart (Q1: 221 µm; Q3: 355 µm; equivalent to approximately two barrel diameters). In mice, the interbarrel septa are much less prominent than in rats (10). Viral deposits included barrel and septal regions (Fig. S1), so putative barrel- or septal-specific projection patterns (11) could not be distinguished. Following fluorophore expression, we acquired images of the entire thalamus and adjacent midbrain regions via mosaic confocal fluorescence microscopy (Figs. 1 D and E and 2 A–D and Fig. S2). These images were used to reconstruct the position of giant synaptic boutons (Fig. 2 E and F). Only boutons with apparent diameters >1.5 µm were defined as giant boutons originating from L5B neurons. Smaller boutons are from L6 and were ignored for the analyses (4). We thus generated 3D reconstructions of subcortical L5B bouton clouds in the entire thalamus and anterior midbrain (Fig. 2G and Movie S1).
Fig. 1.
Cortical bouton labeling and borders of subcortical target nuclei. Subcortical L5B boutons in the thalamus were labeled by virus-mediated expression of two different fluorescent proteins in barrel cortical neurons. (A) Schematic showing dual injection of viral particles encoding Synaptophysin–GFP (SP–GFP, green) and Synaptophysin–mOrange (SP–mOrange, magenta) into the BC and projections in the thalamus (modified from ref. 12). (B) Merged confocal fluorescence image of tangential sections of the BC at the level of layer 4, showing barrels (gray; Streptavidin staining) and deposits of SP–GFP (green) and SP–mOrange (magenta). (C) As in B, but at the L5B level with labeled L5B somata. Barrel outlines are from B. (D) Horizontal section (cytochrome c oxidase staining) containing L5B target nuclei in the thalamus: (POa, POmmedial, POmlateral, PoT, and APT). The VPM, thalamic reticular nucleus (Rt), striatum (Str), and hippocampus (HC) are indicated for orientation. Zona incerta is shown in Fig. S1. (E) An image at a level similar to that shown in D but stained for neuronal somata by NeuroTrace. (Scale bars: 500 µm in B–E.)
Fig. S1.
Overview of deposits. Illustration of all approximate deposit locations and sizes (colored circles) overlaid over a consensus barrel field. Deposits with the same color were obtained from the same animal with one deposit leading to the expression of GFP and the other to the expression of mOrange.
Fig. 2.
Reconstructions of subcortical L5B bouton clouds. Shown are examples of confocal sections and bouton reconstructions. (A–C) Individual channels of horizontal sections through L5B target nuclei in the dorsal thalamus. (A) Somata (NeuroTrace staining; gray). (B) GFP-labeled L5B boutons (green). (C) mOrange-labeled L5B boutons (magenta). (D) Overlaid sections A–C. Dashed lines indicate borders of PO nuclei. (E) Reconstructed boutons from B and C (green and magenta, respectively). Bouton diameters are up-scaled twofold to increase visibility. Arrows indicate orientation (L, lateral; P, posterior). (F) Enlarged view of the boxed area in D but without the NeuroTrace signal. Arrowheads mark examples of putative giant L5B boutons (>1.5 µm). Small puncta (s, <1.5 µm) were excluded; “x” indicates examples of boutons that had their maximum brightness in an adjacent z-section. (G) 3D illustration of reconstructed boutons from experiments in A–F. Major grid lines are spaced by 500 µm. (Scale bars: 500 µm in A–D and F; 25 µm in E.)
Fig. S2.
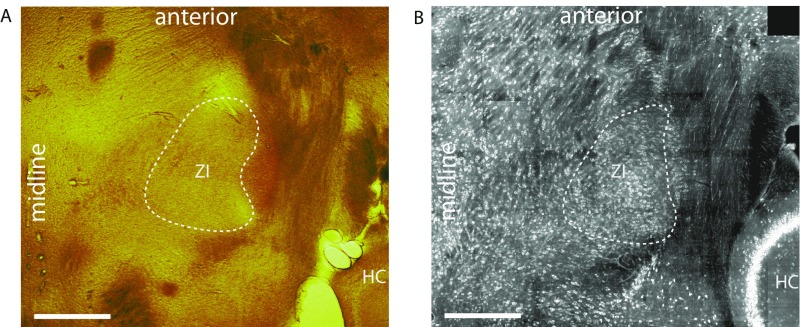
Examples of horizontal slices of the ventral thalamus. (A) Ventral thalamus stained with cytochrome c oxidase. (B) Ventral thalamus stained with fluorescent Nissl stain (NeuroTrace). (Scale bars: 500 µm.) HC, hippocampus (for orientation); ZI, zona incerta.
Target Areas of L5B Neurons.
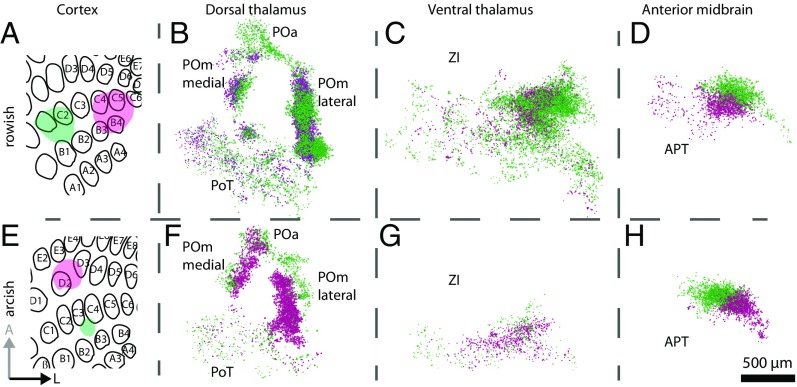
Dual viral deposits in the BC (Fig. 3 A and E) labeled separate L5B bouton clouds in the thalamus and the anterior midbrain (Figs. 1 D–E and 3 B–D and F–H and Movie S1) as well as in the superior colliculus, pontine nuclei, and trigeminal nuclei. Using cytochrome c oxidase and NeuroTrace labeling (Figs. 1 D and E and 2A) allowed us to register the bouton clouds to the coordinates of the mouse brain atlas (12). We identified the following L5B target areas in the thalamus and the anterior midbrain: four spatially segregated clouds in the PO (Fig. 3 B and F), one in the ZI (Fig. 3 C and G), and another in the APT (Fig. 3 D and H). Table 1 lists the centroids of the bouton clouds for each of the reported nuclei in coronal mouse brain atlas-equivalent coordinates (12). We found that the four bouton clouds in the PO were arranged in the horizontal plane and together formed an ellipsoid (Fig. 3 B and F). Based on the cytoarchitecture corresponding to these clouds, we suggest that the PO can be subdivided into four subnuclei (Figs. 1 D and E and 2 A, D, and E). In accordance with established naming conventions, we refer to these four PO subnuclei as anterior PO (POa), POmlateral, POmmedial, and PO, triangular part (PoT).
Fig. 3.
Topology of cortico–subcortical projections. Two experiments with dual-color labeling (GFP, green, and mOrange, magenta) in the rowish (A–D) and arcish (E–H) direction resulted in different relative subcortical positions of bouton clouds. B–D and F–H are in horizontal orientation. (A) Rowish dual-color labeling in the BC approximately along the C row (green and magenta areas). (B–D) Reconstruction of bouton clouds (see the 3D illustration of subcortical bouton clouds in Fig. 2G) in the dorsal thalamus (PO; GFP-labeled boutons are located dorsally to mOrange-labeled boutons) (B), ZI (C), and APT (D). (E) As in A, but for an experiment with arcish dual-color labeling approximately along arcs 2–3 of the BC. (F–H) As B–D resulting from the dual-color labeling shown in E. (Scale bar: 500 µm.)
Table 1.
Projection parameters for each target area
| Nucleus | Coordinates in mm from bregma | Interquartile summary statistics | Bouton diameter, µm | Boutons per L5B neuron | Boutons per column | Volume per L5B neuron, 10−4 mm3 | Volume per column, 10−4 mm3 | Bouton density, 10−4/mm3 | Soma density, 10−4/mm3 | Boutons per soma | Overlap, % | Map orientation (L/A/V) | |||||
| L | P | V | GFP | mO | Rows (A–E) | Arcs (1–6) | |||||||||||
| POa | 1.0 | 1.3 | 3.2 | Median | 2.58 | 2.86 | 5.8 | 263 | 0.6 | 24.4 | 7.0 | 3.26 | 2.2 | 60.3 | L | −0.23 | −0.16 |
| Q1 | 2.33 | 2.56 | 3.4 | 120 | 0.4 | 18.0 | 6.0 | 2.54 | 1.9 | 26.7 | A | −0.59 | -0.99 | ||||
| Q3 | 2.95 | 3.15 | 16.0 | 384 | 1.3 | 47.1 | 12.3 | 4.69 | 3.8 | 63.6 | V | 0.70 | 0.02 | ||||
| POmlateral | 1.4 | 2.0 | 3.3 | Median | 2.88 | 3.20 | 24.4 | 1,027 | 1.1 | 32.0 | 36.5 | 4.50 | 8.1 | 18.7 | L | −0.21 | −0.82 |
| Q1 | 2.56 | 2.86 | 16.7 | 707 | 0.6 | 25.3 | 18.4 | 3.90 | 4.1 | 13.2 | A | 0.38 | 0.55 | ||||
| Q3 | 3.40 | 3.65 | 53.3 | 1,551 | 1.6 | 47.2 | 47.0 | 4.86 | 10.4 | 23.0 | V | 0.90 | −0.14 | ||||
| POmmed | 0.8 | 1.7 | 3.2 | Median | 2.64 | 2.88 | 6.0 | 223 | 0.5 | 15.4 | 14.9 | 4.50 | 3.3 | 21.0 | L | −0.45 | 0.94 |
| Q1 | 2.33 | 2.58 | 3.3 | 140 | 0.2 | 10.9 | 12.2 | 3.58 | 2.7 | 17.8 | A | 0.26 | 0.30 | ||||
| Q3 | 3.04 | 3.26 | 9.1 | 265 | 0.7 | 29.3 | 24.5 | 5.30 | 5.4 | 26.5 | V | 0.86 | 0.15 | ||||
| PoT | 0.9 | 2.3 | 3.3 | Median | 2.56 | 2.73 | 9.3 | 319 | 1.7 | 63.9 | 3.5 | 4.89 | 0.7 | 43.9 | L | −0.20 | 0.63 |
| Q1 | 2.24 | 2.44 | 2.9 | 95 | 0.6 | 26.9 | 2.3 | 3.53 | 0.5 | 32.9 | A | 0.58 | 0.73 | ||||
| Q3 | 2.88 | 3.15 | 13.8 | 399 | 3.7 | 118.9 | 6.9 | 5.56 | 1.4 | 64.9 | V | 0.79 | 0.27 | ||||
| ZI | 1.3 | 2.4 | 4.3 | Median | 2.31 | 2.58 | 17.9 | 483 | 5.0 | 161.0 | 2.6 | 2.23 | 1.2 | 58.3 | L | −0.93 | −0.34 |
| Q1 | 2.05 | 2.31 | 4.6 | 223 | 3.0 | 109.1 | 1.6 | 1.33 | 0.7 | 47.0 | A | 0.02 | 0.43 | ||||
| Q3 | 2.58 | 2.86 | 28.3 | 557 | 13.7 | 263.8 | 3.6 | 2.65 | 1.6 | 75.0 | V | 0.36 | 0.83 | ||||
| APT | 0.8 | 2.7 | 3.1 | Median | 2.44 | 2.64 | 29.5 | 1,003 | 2.2 | 67.7 | 9.2 | 4.31 | 2.1 | 29.8 | L | −0.44 | 0.94 |
| Q1 | 2.24 | 2.44 | 10.7 | 415 | 0.7 | 30.3 | 7.9 | 1.85 | 1.8 | 25.2 | A | −0.74 | −0.21 | ||||
| Q3 | 2.73 | 2.95 | 43.5 | 1,551 | 3.7 | 131.0 | 19.8 | 6.02 | 4.6 | 34.2 | V | 0.50 | 0.28 | ||||
Summary of parameters of L5B projections to the six target nuclei in thalamus and anterior midbrain with medians (bold) and first (Q1) and third (Q3) quartiles, where applicable. Coordinates are equivalent to the mouse brain atlas (12). Diameters are affected by the fluorophore [GFP or mOrange (mO)]. Map orientations are given as unit vectors in the cardinal directions: lateral (L), anterior/posterior (A/P), and ventral (V). Procedures of calculations are given in SI Materials and Methods.
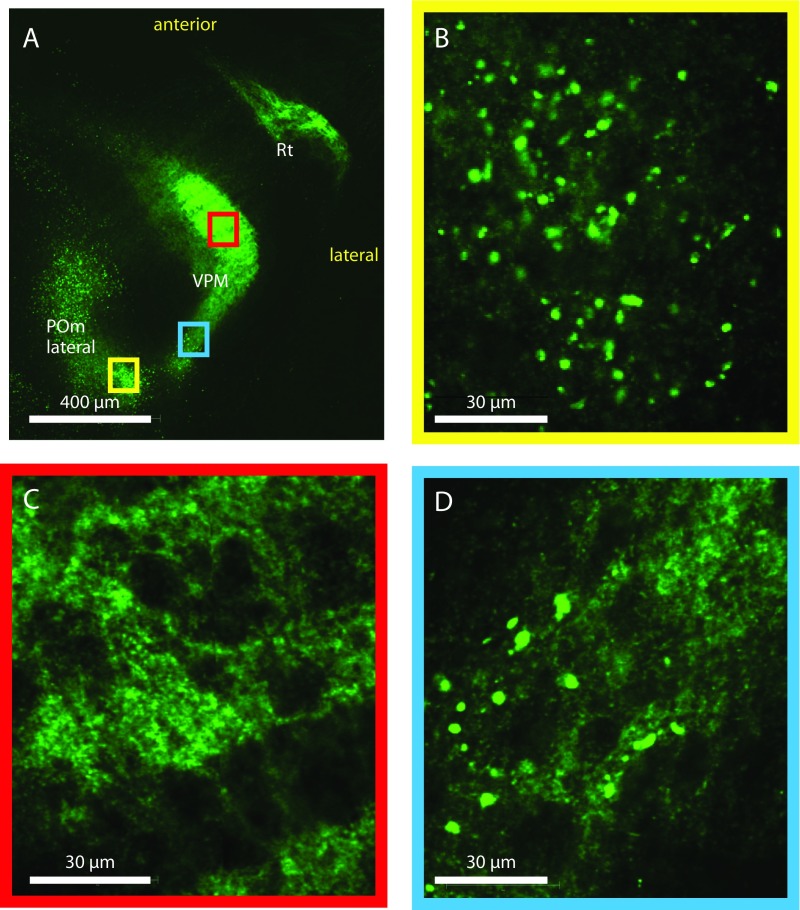
In contrast to earlier reports (13, 14), we found only weak or no labeling in the ventral posterior lateral nucleus (VPL). Furthermore, amid numerous small boutons (Fig. S3C) from L6 (4), we detected few large boutons in a posterior area of the ventral posterior medial thalamic nucleus (VPM) (Fig. S3D), as reported previously (15). However, the low numbers of large boutons (fewer than three boutons per labeled L5B neuron on average) in the VPM and VPL prevented detailed analyses.
Fig. S3.
Comparison of small L6 and large L5B boutons in thalamus. Micrographs show boutons of different sizes in the VPM and POmlateral. (A) Horizontal overview of a maximal intensity projection over eight slices showing the POmlateral, VPM, and Rt. (B) A single z-section image of the POmlateral from the yellow boxed region in A, showing many large boutons of L5B origin. The POmlateral contains both large L5B and small L6 boutons. (C) A single z-section image of the VPM core area from the red boxed region in A showing a meshwork of small boutons of L6 origin. (D) A single z-section image of the posterior VPM from the blue boxed region in A showing some large boutons of L5B origin amid a meshwork of small L6 boutons. The VPM contains mostly small and dense L6 boutons (C) but also contains some large L5B boutons at the posterior end (D); in the Rt there are only small L6 boutons.
Bouton Cloud Quantifications.
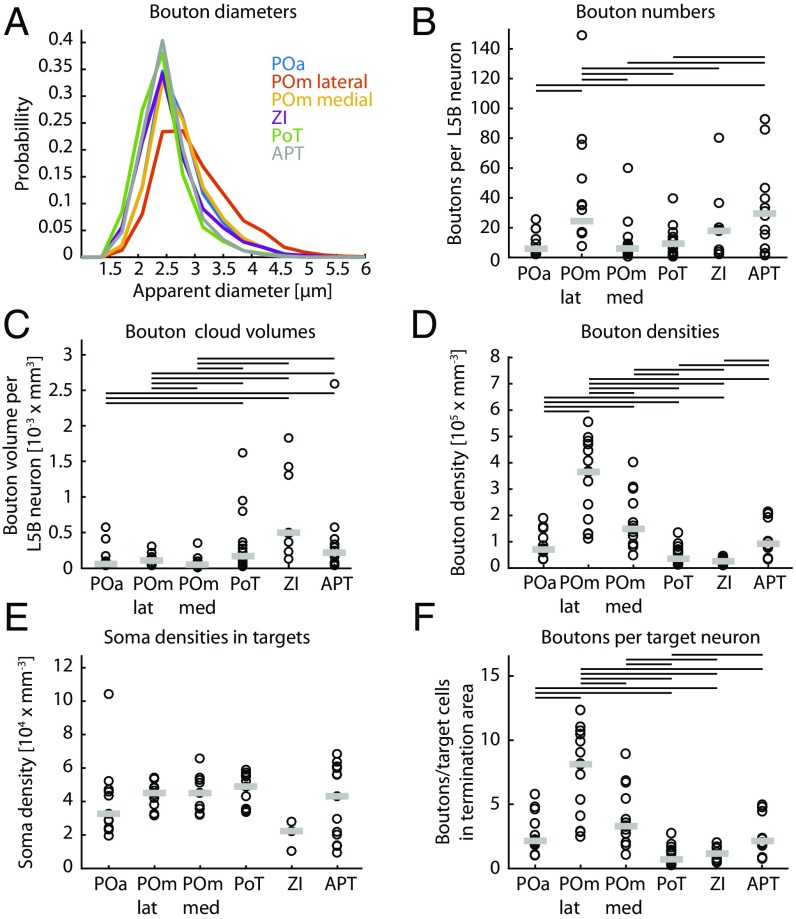
We quantified bouton sizes and numbers, as well as volumes and densities of bouton clouds, in six target nuclei in the thalamus (four of which were within the PO) and anterior midbrain. L5B bouton median diameters were 2.6 µm when labeled with GFP and 2.9 µm when labeled with mOrange (no deconvolution was applied). Bouton diameters in the different target areas were comparable, and medians ranged between 2.3 and 2.9 µm with GFP labeling and between 2.6 and 3.2 µm with mOrange labeling (Fig. 4A and see Table 1 for quartiles).
Fig. 4.
Quantification of projection parameters. Parameter estimates of L5B subcortical projections for each target nucleus. (A) Probability histogram of bouton diameters (only GFP-labeled) in the different nuclei as indicated by different colors. (B–F) The value for each experiment (both GFP and mOrange) is represented by black circles, and the median of all experiments is represented by gray lines. Black lines at the top of the panel indicate which nuclei are significantly different from each other (Wilcoxon signed rank test, P < 0.05). (B) The number of boutons in different nuclei, normalized by the number of labeled L5B neurons (median = 91 L5B neurons; Q1: 50, Q3: 141). (C) Bouton cloud volumes in different nuclei normalized by the number of labeled L5B neurons (median = 91 L5B neurons; Q1: 50, Q3: 141). (D) Bouton cloud densities (the ratio of bouton number to cloud volume). (E) Soma densities from NeuroTrace staining measured in a subsample of sections in two experiments. (F) The number of boutons per target cell (ratio of bouton densities to neuron densities).
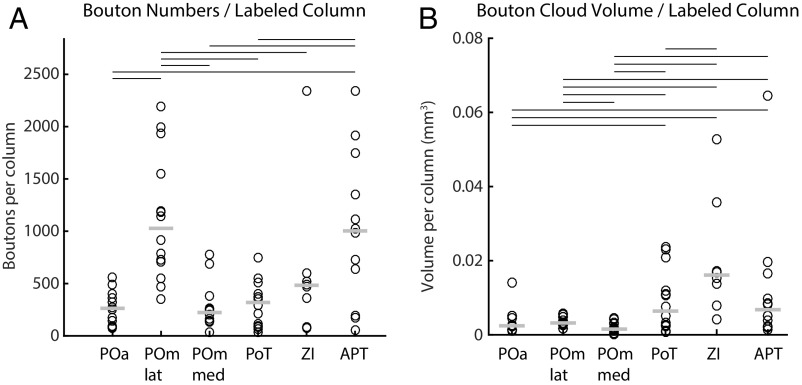
We next estimated the average number of boutons supplied per labeled L5B neuron by normalizing bouton counts in the different nuclei by the number of fluorescently labeled somata in L5B for each experiment. Because not all neurons in L5B are projection neurons, the reported numbers of boutons are lower-bound estimates. The median number of giant boutons supplied by single labeled L5B neurons was highly variable across target areas and ranged between 5.8 and 29.5. According to these estimates, a single labeled L5B neuron supplies most boutons to the POmlateral and APT (median >24 boutons), whereas the ZI receives ≈18 boutons, and the POa, POmmedial, and PoT receive fewer than 10 giant boutons (Fig. 4B and Table 1 for details). Normalizing bouton numbers by the ratio of the labeled column volume to the average column volume, we estimate that one column supplies ≈1,000 giant boutons to the POmlateral and APT and between 220 and 480 giant boutons to the other target nuclei (Table 1 and Fig. S4).
Fig. S4.
Bouton and cloud quantifications. Bouton numbers (A) and cloud volumes (B) when the deposit size is normalized to an average column. The value for each experiment (both GFP and mOrange) is represented by black circles, and the median of all experiments is represented by gray lines. Black lines above the panels indicate which nuclei are significantly different from each other (Wilcoxon signed rank test, P < 0.05).
When approximating bouton cloud volumes per labeled L5B neuron in the respective nuclei, PO subnuclei (excluding the PoT) had the smallest cloud volumes, with fewer than 1.1e4 mm3 per labeled L5B neuron, whereas in the PoT, APT, and ZI boutons were spread over significantly larger volumes (Fig. 4C and Table 1). As a measure of innervation density, we calculated bouton cloud densities in the respective targets. We found the highest bouton densities in the POmlateral, with a median of 3.7e5/mm3, significantly higher than in all other nuclei (Fig. 4D and Table 1). POmmedial bouton densities were intermediate (1.5e5/mm3), whereas POa, PoT, and APT densities were below 1e5/mm3 (Fig. 4D and Table 1). We further estimated soma densities based on a subset of experiments with NeuroTrace colabeling. We found comparable soma densities of ≈4.5e4/mm3 in the PO and APT, similar to previous reports in the rat (16). In the ZI we estimated a lower density (2.2e4/mm3) (Fig. 4E and Table 1).
The ratio between bouton density and soma density in the target area yielded an estimated average of available giant boutons per target neuron in the different nuclei (Fig. 4F and Table 1). In all subcortical target areas, individual neurons are estimated to receive few (<10) giant boutons. Neurons in the POmlateral were estimated to be targeted by approximately eight boutons, whereas neurons in all other analyzed areas receive significantly fewer boutons (fewer than four). In summary, L5B neurons innervate subcortical target nuclei sparsely with the strongest innervation in the POmlateral.
Somatotopic Segregation.
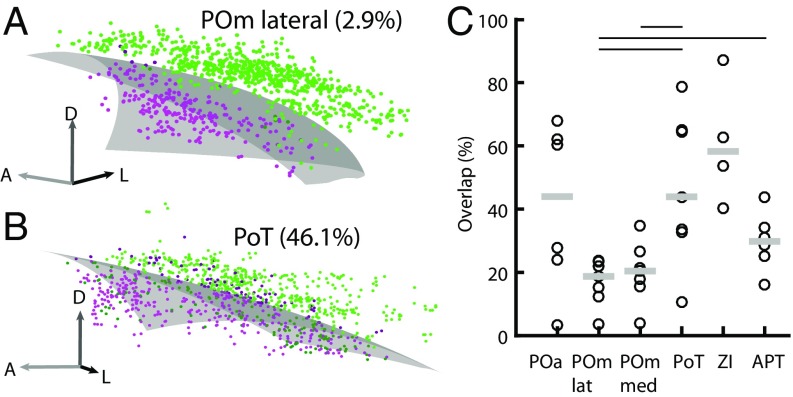
The reconstructed bouton clouds from the dual injections in the BC showed little overlap in the subcortical nuclei (e.g., Fig. 3D), suggesting somatotopic organization of the L5B cortico–subcortical projections. As a measure of somatotopic segregation, we estimated the degree of overlap between clouds with a generalized linear model (GLM) approach (17), which identifies and quantifies boutons in mixed-color areas (Fig. S5). In Fig. 5 A and B the GLMs are illustrated as the border surfaces between GFP- and mOrange-labeled bouton clouds. The advantage of the GLM approach compared with alternative volume and binning methods for measuring overlap is that the GLM approach is much less dependent on cloud shape, bouton density, or bin size. We found that bouton clouds overlapped to different degrees depending on the target nucleus. The POm (medial and lateral) and APT had median overlaps of 19–30%, whereas the POa, PoT, and ZI had overlaps of more than 40% (Fig. 5C and Table 1). The negative correlation between the border distance of the two deposits in the BC and the resulting subcortical overlap was significant in the POmlateral and APT (P < 0.05, Pearson correlation).
Fig. S5.
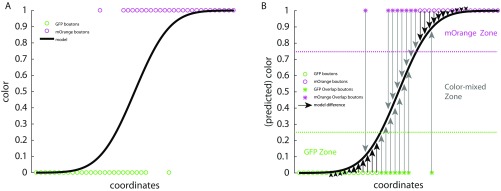
A 1D illustration of model-based calculation of overlap. (A) Scatter plot of examples of boutons (green and magenta circles) in color over coordinate space. The black line illustrates the color gradient as predicted by the binomial model. (B) Boutons are illustrated as in A. Arrow lengths indicate the absolute difference between bouton color and the predicted color value. Black arrows indicate a difference <0.25; gray arrows indicate a difference >0.25. Boutons with absolute differences larger than 0.25 are defined as overlap boutons and are indicated by asterisks. In this example 8 of 26 boutons are overlap boutons, resulting in 30.8% overlap.
Fig. 5.
Overlap between GFP- and mOrange-labeled bouton clouds calculated with GLMs. (A) A low-overlap example from the POmlateral showing a randomly selected subset of 1,000 boutons for clarity. The transparent gray surface illustrates the GLM-modeled surface that gives the best separation of bouton clouds (green and magenta dots). Overlap boutons are plotted in a dark shade of green and magenta, respectively. The percentage of boutons in the overlap volume is proportional to cloud overlap. (B) As in A but showing a high-overlap example from the PoT. (C) Estimated overlaps for all target nuclei. Each circle represents one experiment; gray bars show the median. Lines above the panel indicate which target nuclei are significantly different from each other (Wilcoxon signed rank test, P < 0.05).
In summary, L5B projections from neighboring areas in the BC to subcortical target nuclei are largely segregated with a varying degree of overlap depending on the subcortical target nucleus, indicating L5B cortico–subcortical somatotopic organization.
Whisker Projection Maps.
Rowish (Fig. 3 A–D) and arcish (Fig. 3 E–H) dual virus deposits in the BC yielded different relative bouton cloud positions in the target nuclei, raising the possibility that the BC whisker map is projected to subcortical target nuclei via L5B projections. Therefore we tested if bouton cloud positions can be predicted from the relative positions of deposit sites in the BC. We fitted and evaluated linear regression models to the data, using the relative deposit locations in the barrel field as input and relative bouton cloud centroid locations in each target nucleus as output. POmlateral and APT bouton clouds could be predicted accurately (prediction SEM 2° for the POmlateral and 3° for the APT), and the prediction errors for the other nuclei were only slightly larger (6° for the Poa, 7° for the POmmedial, 9° for the PoT, and 5° for the ZI), indicating projection maps of L5B origin in the target nuclei.
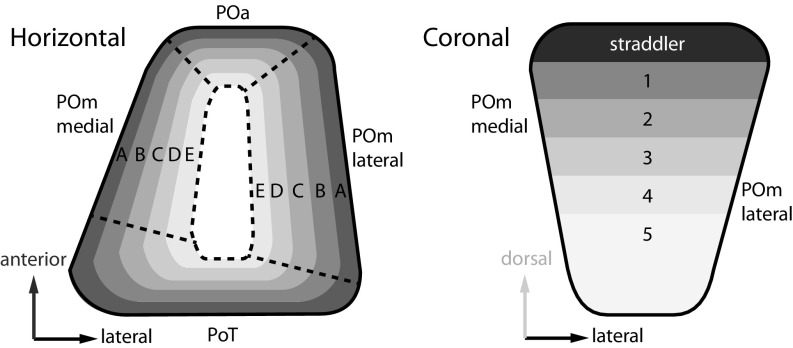
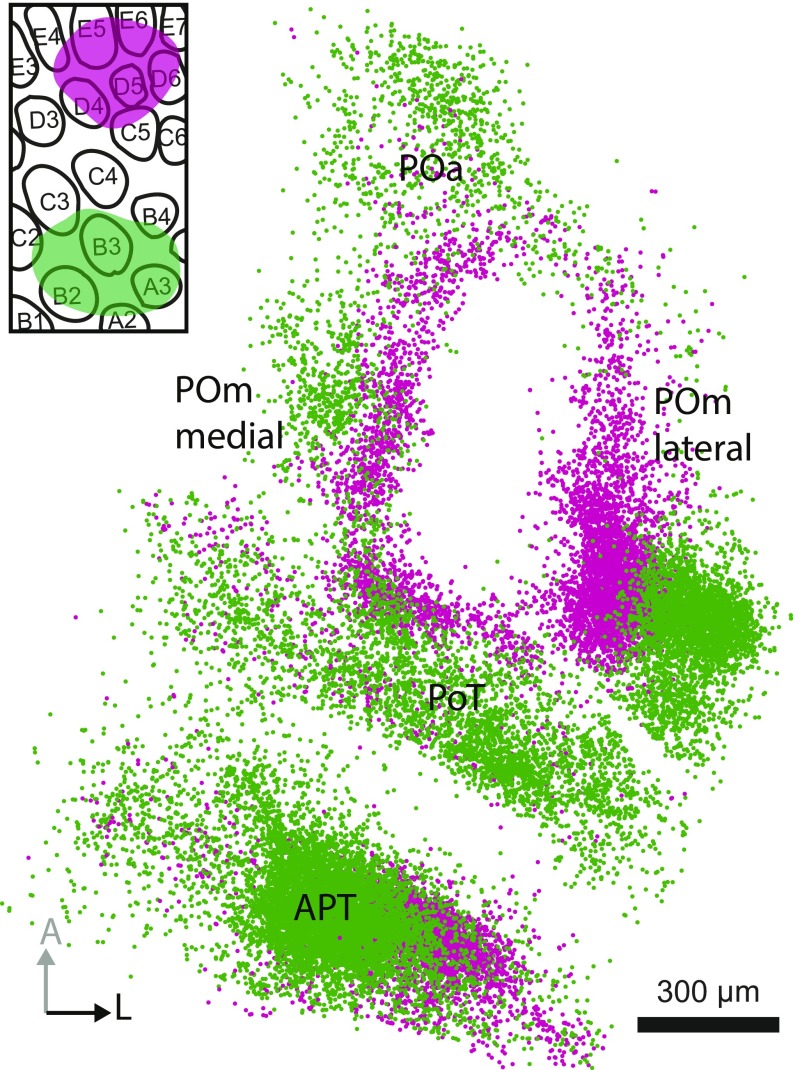
Furthermore, using the fitted models to predict virtual purely rowish and arcish deposits, we estimated the individual barrel field projection map orientations in the thalamus and anterior midbrain (Table 1). In the four PO subnuclei, whisker arcs 1–7 are arranged from dorsal to ventral. In contrast, whisker rows A–E are organized concentrically from the outside to the center of the PO, e.g., in an anterior–posterior direction for the POa and in a lateral–medial orientation for the POmlateral (see the schematic in Fig. 6 and unit vector directions in Table 1). Notably, the center of the PO was always devoid of cortical giant boutons (Fig. S6), even when deposits included E row cortical columns that project to the innermost part of the PO. Finally, in the APT, projection rows A–E point posterolaterally, and arcs 1–7 point ventroposteromedially, whereas in the ZI the projection rows point anteroventrally, and arcs are oriented medially.
Fig. 6.
PO whisker projection maps. Schematic drawings of L5B-derived whisker maps in the PO in horizontal (Left) and coronal (Right) views showing the outside–in organization of whisker rows and the dorsoventral orientation of whisker arcs. Rows and arcs are shown in shades of gray.
Fig. S6.
Central gap in the PO. A horizontal view of subcortical boutons from dual deposits (Inset). Magenta-colored row E projections are located toward the middle of the PO but still leave a gap in the center. A, anterior; L, lateral.
In summary, L5B inputs endow each target nucleus with an individually oriented somatotopic whisker map. In combination, the four whisker maps in the PO form a circular row structure from outside to inside and a homogeneous arc orientation in the dorsal-to-ventral direction.
Discussion
On anatomical grounds the POm is part of the whisker system, and POm cells are responsive to whisker deflections (2, 8, 18), but the function of the POm in whisker processing is still unclear (19, 20). The main synaptic drive of the POm originates in the BC in L5B (6, 7, 18). Anatomical and physiological properties point to the possibility of substructures in the PO, albeit not conclusively (21, 22). Here, using quantitative neuronal projection tracing, we found that L5B giant boutons cluster in four spatially segregated regions of the PO. Additionally, the ZI and APT—two regions that were shown to inhibit POm (23, 24)—receive substantial input from L5B. Two-color labeling of L5B boutons revealed that in each target area bouton clouds repeat the relative spatial arrangement of the whiskers on the animal’s snout. Thus, descending L5B projections are somatotopically arranged into whisker maps with target-specific orientation.
Methodological Considerations.
We labeled the cortico–subcortical pathways from L5 and L6 in the mouse BC with Synaptophysin–fluorophore fusion proteins (25). Compared with L5 projections, L6 innervates the thalamus densely with small boutons (Fig. S3) (4). Here, we investigated the cortico–subcortical pathway from L5B by focusing on boutons with diameters >1.5 µm, thus ignoring L6 boutons. To do so, we optimized the imaging parameters for large boutons. The sparseness and size of L5B boutons allowed us to sample coarsely in the z-direction (optical sections spaced by 10 µm) and thereby image the whole brain. To counteract signal loss through z-undersampling, we increased the size of the pinhole. With this low-resolution imaging approach, individual L6 boutons either were not resolved and appeared as regions with high background because of their high density and small size (Fig. S3) (4) or were excluded from the analyses because of their small diameter (<1.5 µm).
Subdomains in the PO.
Bouton cloud reconstructions revealed four distinct L5B input areas in the dorsal thalamus, which together form an ellipsoid in the horizontal plane. The POmlateral, POmmedial, and posterior (PoT) (12, 22) target areas are clearly within the PO. Based on Paxinos and Franklin’s mouse brain atlas (12) the anterior bouton cloud is located in the ventral lateral nucleus (14). However, we could not find a cytoarchitectural border between the anterior cloud area and the PO (Figs. 1 D and E and 2A). Furthermore, according to the Allen Mouse Brain Reference Atlas (13), this anterior target area is part of the PO. We therefore suggest that the anterior bouton cloud is within the PO and refer to it as the “anterior PO” (POa). Thus, L5B in the BC targets four areas in the dorsal thalamus: the POa, POmmedial, POmlateral, and PoT.
Each PO subnucleus had a characteristic 3D organization of L5B boutons. First, the POmlateral had the highest bouton densities; bouton densities in the PoT and POa were significantly lower (Fig. 4D). Second, the precision and orientation of the corticothalamic maps were specific for each PO subnucleus (Fig. 5C). As a consequence, the PO contains four differently oriented whisker maps (Fig. 6). It remains unclear if the cortical projections into the four PO subnuclei are paralleled by inputs from other sources. For example, the spinal trigeminal nucleus interpolaris innervates only approximately one third of the PO, but whether this pathway targets specific PO subnuclei cannot be derived from the dataset (21). Previous physiological studies also hint at functionally different populations in the PO (21, 22).
L5B Projection Organization.
We used the relative locations of viral deposits in the BC and respective relative bouton cloud locations to estimate the organization and precision of whisker maps in the target areas.
In the PO subnuclei, projection arcs were oriented in approximately the ventral direction (i.e., C3 projections were located ventrally of C2 projections). Projection rows, in contrast, always pointed in the direction of the PO center (e.g., the A-row projections surround those from row B) (Fig. 6). However, the very center of the PO did not receive boutons from the BC (Fig. S6). In accordance with receptive field mapping (8), we hypothesize that the PO center region receives cortical input from somatosensory cortex corresponding to the rest of the body. We found target specificity not only for map orientation but also for somatotopic precision. Although dual virus deposits in the BC were nonoverlapping, subcortical bouton clouds overlapped to a certain degree. Comparing all four PO subnuclei, we found that the POa and PoT had the highest projection overlaps and therefore received less precise somatotopic L5B input. The POmlateral and POmmedial had the lowest percentage of overlaps (∼20%) and thus had the highest projection precision. This result is in accordance with previously reported corticothalamic projection map specificity (including L6) to the POmlateral that was suggested to be similar to that of the VPM (26). Another study, in which adjacent barrel columns were labeled (11), indicated no discernable somatotopy from the BC to the POmlateral. These different results suggest that viral deposits at various distances within the BC together with 3D reconstructions of giant bouton clouds are necessary to reveal the somatotopic organization.
In addition to the PO, L5B also projects substantially to the GABAergic nuclei ZI and APT (2). Although both nuclei received similar numbers of boutons per L5B neuron, the APT received denser bouton clouds, with a clear somatotopic projection map in the horizontal plane. In the dorsal ZI, the L5B bouton clouds were distributed in large volumes with low density and low somatotopic precision. Both nuclei send GABAergic projections to many brain areas, including the PO, allowing complex cortico–subcortical interactions (2, 23, 24).
In summary, in all target nuclei investigated we found largely segregated L5B bouton clouds and projection maps that were predictable from the relative locations of virus deposits in the BC, together demonstrating somatotopic organization of L5B subcortical pathways. Consequently, L5B transfers multiple symmetry- and rotation-modified whisker maps from the BC to the thalamus and the anterior midbrain. The partial overlap of projections indicates some intermixing of the parallel pathways. However, whether individual postsynaptic neurons sample all available boutons from a few barrel columns or instead have a selection bias to specific origins awaits confirmation on the ultrastructural level. Thus, the L5B projection mapping points to a labeled lines organization, but the exact specificity of these labels, i.e., the exact set of encoded whiskers, depends on the innervation model, which here is assumed to be random. On anatomical grounds, a labeled lines organization aligns with previous functional studies, which revealed that POmlateral neurons respond to a specific set of two to four whiskers (8) resulting from cortical L5B giant bouton input (7, 18).
Corticothalamic Convergence and Divergence.
We estimate that one L5B neuron supplies on average 24.4 boutons to the POmlateral, comparable to previously published single-neuron tracing estimates in the rat (5). However, L5B projection neurons are probably an inhomogeneous population in terms of target specificity (5). The fractions of L5B neurons projecting to particular target areas and not to others influence our quantitative estimates of the number of boutons per L5B neuron. As a first approximation, we report values under the assumption that all labeled L5B neurons project to all targets.
The number of cortical neurons converging onto a single subcortical target neuron (convergence) and the number of subcortical target neurons innervated by one cortical neuron (divergence) are hitherto untested. In the POmlateral, on average 8.1 L5B boutons are supplied to each target neuron, based on the ratio between labeled bouton and soma densities. Because of the overlap of corticothalamic projections, however, it can be assumed that additional unlabeled boutons are also present; thus 8.1 boutons is a lower-bound estimate. Because several boutons of the same L5B axon can innervate a POmlateral dendrite, it is likely that single L5B neurons connect to POmlateral neurons with more than one bouton. Recent functional convergence estimates of the pathway suggested on average ≈2.5 independent L5B inputs (7). Because multiple contacts of the same L5B neuron with a POm neuron appear as a single functional input in physiological experiments, the results can be combined to the following convergence estimate: on average, 2.5 L5B neurons (7) provide a minimum of 8.1 giant boutons contacting the postsynaptic POm neuron, resulting in at least 3.2 (8.1/2.5) giant boutons between individual L5B and POmlateral neurons.
Setting those 3.2 giant boutons between individual neurons in relation with 24.4 boutons per labeled L5B neuron in the POmlateral, an average L5B neuron is estimated to innervate at most 7.5 (24.4/3.2) neurons in the POmlateral. These estimates suggest very low divergence and convergence, indicating that the L5B-to-POm pathway is sparse and highly parallelized.
The data presented here suggest that L5B neurons of the BC are the origin of a subcortical signal pathway organized by “labeled lines” with mostly parallel and topographic projections but some mixing. In concert with a dense quadruple innervation field of the higher-order nucleus PO, the spike output from L5B in the BC is broadcast with high functional efficacy and anatomical precision via PO’s widespread cortical projections (2, 27) to other cortical and subcortical areas.
Materials and Methods
All experiments were done according to the guidelines of German animal welfare and were approved by the ethical committees of the Technical University of Munich. Small deposits of two different AAVs (encoding Synaptophysin fused to GFP or mOrange) were targeted to L5B in the BC of seven mice. Next, we obtained slices of the thalamus and anterior midbrain, which were imaged by mosaic confocal microscopy. We reconstructed the location of labeled giant L5B boutons in the target areas to quantify the organization of cortico–subcortical L5B innervation. Values are provided as the median and first and third quartiles if not specified otherwise. Details about materials, surgery, microscopy and analysis are presented in SI Text.
SI Materials and Methods
Viral Tracers.
AAV serotype 1/2 was obtained from GeneDetect. The constructs Synaptophysin–GFP and Synaptophysin–mOrange were a kind gift from Thomas Kuner, Department of Anatomy, University of Heidelberg, Heidelberg, Germany (25). Synaptophysin is targeted to synaptic vesicles and thereby labels presynaptic endings with GFP or mOrange.
Virus Deposits.
We achieved focal transfection of infragranual neurons in two separate areas of the BC with constructs that lead to fluorescent labeling enriched specifically in synaptic boutons. Seven C57/BL6 mice of both sexes, 5–7 wk old at the time of injection, were used. One additional C57/BL6 mouse was used for horizontal cytochrome c oxidase labeling only. Anesthesia was induced by exposing the animal to 1 vol% isoflurane (Isofluran CP; CP-Pharma) in O2, using an inhalator (Drägerwerk AG). Body temperature was kept at 37 °C using a heating pad, and depth of anesthesia was monitored by visual inspection of the breathing rate and lack of a foot-pinch reflex throughout the operation. After deep anesthesia was achieved, eyes were covered with Bepanthen eye and nose ointment (Bayer) to avoid drying, and ∼100 µL of lidocaine (1%, LICAIN; DeltaSelect) was injected s.c. under the scalp. The mouse then was moved to a stereotaxic frame (Anilam and Cartesian Research) and fixed with earbars. A small longitudinal cut exposed bregma and lambda, which was used to align the head stereotaxically. After a small craniotomy was made at the coordinates of the BC (2.8–3.35 mm right, 0.85–1.7 mm posterior relative to bregma), the head was tilted 20° to the left to allow penetration of the injection pipette perpendicular to the pia. The viral particle solution was front-loaded into pulled micropipettes (Blaubrand; intraMARK) and was lowered to a depth of ∼0.7–0.8 mm below the pia. Approximately 50 nL of the virus solution was injected slowly by applying air pressure. After the injection, the pipette was left in place for 10 min to allow diffusion and then was retracted slowly. The injection procedure was repeated for the second injection with the other virus solution. Coordinates of virus deposits ranged between 2.8–3.35 mm lateral and 0.85–1.7 mm posterior to bregma, approximately at the depth of L5 (0.7–0.8 mm below the pia). Injection coordinates for dual labeling were ≈0.6 mm apart. After the procedure was completed, the skin above the skull was sutured with silk suture material (Perma-Hand, 6–0; Ethicon). The animal then was transferred to its home cage. After a 14- to 16-d incubation period, the mouse was exposed to a lethal dose of isoflurane and was transcardially perfused with 4% paraformaldehyde (PFA) in PBS. The brain was removed and postfixed for 12 h in 4% PFA at 4 °C.
Slicing and Histology.
Brains were embedded in 2% agarose and then were cut using a vibratome (VT1000S; Leica), at a 100-µm thickness. First, the BC was cut tangentially (tilted ∼22° to the left and ∼8° upward); then the thalamus was sliced either coronally (one experiment), sagittally (two experiments), or horizontally (four experiments).
Barrel visualization.
We found that Streptavidin–Alexa-647 (Thermo Fisher Scientific), typically used to visualize biocytin-filled neurons fluorescently, also clearly labels barrels. In short, we used the following protocol: two 10-min washings in phosphate buffer (PB); 1 h permeabilization in 1% Triton-X (Sigma)/PB; 2 h incubation with 1 µg/mL Streptavidin–Alexa-647 (Invitrogen/Thermo Fisher Scientific) in 0.5% Triton-X/PB; four 10-min washings in PB; and overnight washing in PB at 4 °C.
Somata visualization.
In a subset of experiments thalamic slices were stained for somata using NeuroTrace 435/455 (Thermo Fisher Scientific) for slice alignment, nucleus border detection, and soma counting. In short, a 10-min washing in PB was followed by 10 min in 0.1% Triton-X/PB, 20 min in 200× diluted NeuroTrace solution, two 10-min washings in 0.1% Triton-X/PB, and two 10-min washings in PB. Cytochrome c oxidase staining was achieved as described previously (21).
Embedding.
Following the histological procedures, slices were embedded in SlowFade Gold or SlowFade Diamond (Thermo Fisher Scientific), and the coverslip was glued to the slide by nail polish.
Microscopy.
Slices were imaged with an Olympus FV1000 confocal microscope outfitted with an automated stage for mosaic imaging (Prior Scientific). We used the following objectives: For overview images of the cortical barrel field or the thalamus: UPlan FL N 4× NA 0.13, air; for bouton imaging: UPlanSApo 20× NA 0.85, oil. Different laser lines were used to excite the following fluorophores: NeuroTrace–Alexa-435: 405 nm; Synaptophysin–GFP: 488 nm; Synaptophysin–mOrange: 559 nm; and Streptavidin–Alexa-647: 630 nm. Slices were scanned in sequential mode, zoom: 1.5, resolution of individual tiles: 1,024 × 1,024 pixels; laser power and photo multiplier gain were adjusted so that the brightest pixels were not saturated. Optical sections (z-stepping) for imaging boutons were set to 10 µm to allow scanning of the entire slice with high x/y resolution at reasonable time and data-storage demands. The resulting voxel size was 0.414 × 0.414 × 10 µm (x × y × z). Potential signal loss resulting from the coarse 10-µm step size was prevented by increasing the pinhole width to 300 µm. Signal loss was evaluated by comparing 10-µm z-stepping with 1-µm z-stepping in the same imaging volume and resulted in a bouton loss of less than 1.5%. Less than 4% of boutons were double counted at 10-µm z-stepping (one bouton, visible in multiple z-sections, falsely split into two during detection). Not all L5B-target nuclei could be scanned completely for each experiment because of occasional tissue damage during slicing. Thus the number of reconstructed nuclei varies across experiments.
Quantification of Virus Deposits.
The centers of the dual injections into the barrel field were measured in post hoc-reconstructed tangential slices. In the range between 100 and 300 µm below the lower border of barrels (28), corresponding to L5B, we counted 91 (median; Q1: 50; Q3: 141) fluorescent somata in a volume of 8e-3 mm3 (Q1: 4e-3 mm3; Q3: 14e-3 mm3) corresponding to three columns (Q1: two columns; Q3: four columns). The borders of dual injections were 260 µm (Q1: 221 µm; Q3: 355 µm; equivalent to approximately two barrel diameters) apart.
Bouton Extraction Procedure.
Mosaic tile images were stitched using Olympus built-in algorithms without edge smoothing. Stitched stacks then were loaded into Amira 6 (FEI) and were aligned to each other (rigid alignment). Stacks were loaded into MATLAB 2015b (MathWorks), and bouton locations and respective diameters were extracted. Giant boutons were readily discernible visually (Fig. 2F and Fig. S3), so we determined bouton coordinates in a number of representative initial datasets manually and adjusted automatic detection parameters to fit these datasets, achieving nearly identical results. The imaging data then were processed in a multistep approach: (i) automatic isolation of giant boutons and (ii) manual removal of false positives (mainly axonal transport vesicles).
The automatic detection procedure was optimized to detect salient L5B giant boutons and to exclude L6 boutons, which were mostly optically unresolved (Fig. S4 for a comparison) and autofluorescence. To achieve this optimization, we normalized pixel intensity values for each z-section to zero ± 1 (mean and SD; z-scoring) and then set negative values to zero. To remove fine-grained noise, each z-section was subsequently 2D Gaussian filtered (σ = 0.4 pixels). These steps were necessary because the overall signal and background brightness varied, depending on experiment, fluorophore, and imaging depth in the tissue.
Next, intensity peaks were isolated by finding voxels with intensities higher than all their 26 neighbors (3D image dilation with center zero) and a minimal intensity of 2.5 (in SDs resulting from z-scoring). These peak voxels mark, in addition to L5 giant boutons, a fraction of structures that do not belong to giant boutons but rather to mostly unresolved L6 bouton densities and tissue autofluorescence. L5 giant boutons were distinguished from these structures by isolating peak voxels for which the surrounding intensity level drops steeply to background level with distance from intensity peak. Background brightness, however, was locally variable, dependent on the presence of unresolved L6 bouton densities. Local background was defined as the 10th percentile of 7 × 7 µm image snippets (encompassing even the largest giant boutons) around the previously isolated intensity peaks. We determined that visually discernible boutons had intensities of at least 2.5 after local background subtraction. The remaining peaks below this threshold belong to unresolved L6 densities and were removed.
The remaining bouton candidates included a small fraction of resolved small L6 boutons and potentially axonal signals from transport vesicles containing Synaptophysin–fluorophore complexes. These small structures were removed on the basis of the following diameter measurements. First, to increase the precision of diameter estimation, the local background-corrected image snippets around bouton candidates were interpolated by an up-sampling factor of 5. Because the intensity profile of boutons is roughly bell-shaped and boutons sometimes merge into one another, we defined the diameter as twice the shortest distance between peak intensity and half-peak intensity. Diameters should be considered as apparent diameter estimations and deviate from real diameters because of the influence of multiple factors: shape, point spread in confocal microscopy (no deconvolution was applied), and wavelength. The resulting diameter histogram showed two distinct populations: a large population with a peak distribution around 2.5 µm (Fig. 4A) and a much smaller population with a peak distribution around 0.75 µm (not shown). Using a diameter threshold of <1.5 µm excluded the small population of boutons originating from L6 neurons in the BC (29).
As a last manual clean-up step, resulting bouton candidates were exported to Amira, where remaining artifacts (mostly axonal signals) were removed manually. These artifacts were identified by their pearl-necklace appearance, i.e., interconnected bright, small structures arranged in rows.
Finally, boutons of different tissue slices of one experiment were aligned in Amira and then were merged and manually split into the respective target areas (based on clustering).
Soma Density Calculation.
Fluorophore-expressing somata and NeuroTrace-labeled somata in the thalamus were counted in Amira, using a sequence of filtering and opening–closing steps to smooth out darker cell nuclei, and then were counted by local maxima and connected component analyses. Density calculations were performed on a subsample of image stacks of two experiments. Soma densities were independently verified using NeuN antibody staining (rabbit, ab177487; Abcam).
Cloud Volume Calculation.
After outliers were removed, bouton cloud volumes were estimated using a MATLAB built-in alpha shape algorithm (30) in the MATLAB basic package. In many cases dense core areas of bouton clouds were surrounded by a few more distant boutons. The number of these stray boutons was highly variable and strongly influenced the estimated volume; therefore we excluded them from the calculation of cloud volumes. Outliers were defined as boutons for which the mean distance to their next 20 neighboring boutons was larger than 2 SDs of all mean distances. Although the curve of volume vs. outlier definition was approximately flat around the inclusion of mean distances smaller than 2 SDs, the resulting volume would increase rapidly if more distant boutons were included in the analysis. The shrinkage of the alpha shape (i.e., how well the shape follows concave sections) is mathematically defined as the alpha shape radius. Because the radius matching the cloud shape is further influenced by the bouton density, which varies strongly between nuclei, we calculated an unbiased alpha shape radius as follows: We first calculated the smallest alpha radius that results in a single shape with all boutons included and then further reduced this critical radius by a factor of 0.85 to account better for curved cloud shapes.
Cloud Overlap Calculations.
To quantify the convergence of L5B projections in subcortical targets, we estimated the degree of overlap of bouton clouds originating from the two different deposit locations in the BC. The degree of overlap can be estimated as the percentage of boutons in the transition zone between channels, i.e., the mixed-color zone between the green and magenta clouds. To measure the percentage of boutons in the transition zone, we (i) fit a GLM (a flexible generalization of linear regression) (17) to the 3D locations and respective color labels (green or magenta) of boutons, (ii) used this model to count overlap boutons in the transition zone, and (iii) corrected overlap estimates for unequal bouton numbers between clouds. All calculations were performed in MATLAB. Data were analyzed separately for each target area and for each experiment.
-
i)
To find the transition zone between the two bouton clouds, we fit a GLM (17) to the data using the boutons’ 3D coordinates (i.e., location) as independent (predictor) variables and bouton color channel (parameterized as binary 0 or 1, for GFP and mOrange labels, respectively) as the dependent (response) variable. A binomial model was chosen to account for the binary color labels. To match the curved, banana-like shape of the bouton clouds, we used a quadratic polynomial form for the regression model. The algorithm uses the least squares method for the quadratic regression optimization and a probit (Fig. S3A) link function. The specific MATLAB function call (Statistics Toolbox) was
This predictive model yields a 3D, nonlinear gradient between values 0 (GFP) and 1 (mOrange) in the coordinate space (Fig. S5 illustrates a cross-section of the modeled 3D gradient) and allows the prediction of bouton labeling color (values between 0 and 1) as a function of bouton location. The surface at predicted value 0.5 is the best separating surface between the two bouton clouds, as shown for illustration purposes in Fig. 5 A and B).
-
ii)
To quantify cloud overlap, each bouton was tested for its predicted color value by using MATLAB’s “predict” function (Statistics Toolbox):
We found the absolute difference (color_error) between the real experimental bouton colors (bouton_colors) and the colors predicted by the GLM (predicted_bouton_colors):
Boutons for which this difference was greater than a threshold of 0.25 (color_error > 0.25) were defined as overlap boutons (Fig. S5B, gray arrows). For example, a GFP bouton (bouton_color = 0) far on the GFP side of the GFP zone would have a color_error close to zero and thus would be assigned to the GFP zone. In contrast, a GFP bouton in the transition zone or in the mOrange zone would have a color_error larger than 0.25 and thus would be defined as an overlap bouton.
Definition of color_error threshold: the predicted values of predicted_bouton_colors asymptotically approach 0 and 1 with distance from the mixed-color zone (Fig. S5). The model thus gives four domains: green (<0.25), dominant green but intermixed (>0.25 and <0.5), dominant magenta but intermixed (>0.5 and <0.75), and magenta (>0.75). Thus, we define 0.25–0.75 as the transition zone (Fig. S5), i.e., overlap boutons are those for which the predicted bouton color deviates from the actual color (color_error) by more than 0.25.
The percentage of boutons in the transition zone between green and mOrange is an estimation of the overlap. We calculated the percentage of overlap boutons for each channel and report the overlap values of the less-populated channel (only the less-populated channel overlap is proportional to the overlap of both clouds).
-
iii)
To make the overlap calculation independent of different numbers of boutons in the two color channels, we used a bootstrap resampling approach (31). For each separate experiment and target area, we randomly selected a set of n boutons (n = half of the number of boutons in the channel with fewer boutons) from each channel and fit the model using the fitglm procedure as described above. The overlap then was estimated by using all boutons in the experiment and target area using the predict function as described above (similar results were obtained using either all boutons or the random subset of boutons used for model generation). We repeated these calculations 400 times with new random samples. The results we report here are averages of the resulting 400 overlap values.
The MATLAB algorithm was tested with artificial data and was found to be robust between and including the extreme scenarios of complete separation and nearly complete overlap. The GLM fit is not defined if the clouds were perfectly overlapping or identical or if they have shapes more complex than convex or curved. The experimental data met these criteria in all cases.
Calculation of Map Orientations.
The barrel map orientation for each nucleus was calculated by first normalizing the vectors between both injection positions (in row/arc space) and the vectors between the median of both bouton clouds in each experiment and nucleus. The resulting relative directions of injection and cloud locations then were used to fit a linear model for each of the bouton space components. The set of linear models then was used to predict the relative direction of a vector between (virtual) bouton cloud locations for purely rowish and purely arcish injections. The SEM angle between measured and predicted directions in each experiment gives an estimate of the predictability of the row and arc directions for each nucleus, with low values indicating high predictability. Table 1 lists the direction of the main map unit vectors in each target area. For example, the medians of boutons from injections in the same arc and rows A–E are ordered along the vector −0.21/0.38/0.9 (lateral/anterior/ventral) and therefore mainly along the dorsal-to-ventral axis, tilted slightly anteromedially in POmlateral.
The target area’s stereotaxic coordinates (Table 1) were estimated by setting the median of the POmlateral boutons to the coronal Paxinos and Franklin’s mouse brain atlas (12) stereotaxic coordinates of the POmlateral (defined as 1.35 mm lateral and 2 mm posterior of bregma and 3.25 mm ventral of pia). The difference between the medians of the boutons in each area and that of the POmlateral, added to the atlas coordinates of the POmlateral gives an approximation of the area’s location in atlas coordinates.
Supplementary Material
Acknowledgments
We thank Arthur Konnerth for providing laboratory space and infrastructure and Thomas Misgeld for providing access to his confocal microscope setup. This work was funded by Boehringer Ingelheim Fonds (A.S.), the Max Planck Society, and DFG Collaborative Research Center 1158, as well as DFG Grants 3757/3-1 and 3757/2-1 (to A.G.).
Footnotes
The authors declare no conflict of interest.
This article contains supporting information online at www.pnas.org/lookup/suppl/doi:10.1073/pnas.1704302114/-/DCSupplemental.
References
- 1.Woolsey TA, Van der Loos H. The structural organization of layer IV in the somatosensory region (SI) of mouse cerebral cortex. The description of a cortical field composed of discrete cytoarchitectonic units. Brain Res. 1970;17:205–242. doi: 10.1016/0006-8993(70)90079-x. [DOI] [PubMed] [Google Scholar]
- 2.Bosman LWJ, et al. Anatomical pathways involved in generating and sensing rhythmic whisker movements. Front Integr Nuerosci. 2011;5:53. doi: 10.3389/fnint.2011.00053. [DOI] [PMC free article] [PubMed] [Google Scholar]
- 3.Sherman SM. Thalamus plays a central role in ongoing cortical functioning. Nat Neurosci. 2016;19:533–541. doi: 10.1038/nn.4269. [DOI] [PubMed] [Google Scholar]
- 4.Bourassa J, Pinault D, Deschênes M. Corticothalamic projections from the cortical barrel field to the somatosensory thalamus in rats: A single-fibre study using biocytin as an anterograde tracer. Eur J Neurosci. 1995;7:19–30. doi: 10.1111/j.1460-9568.1995.tb01016.x. [DOI] [PubMed] [Google Scholar]
- 5.Veinante P, Lavallée P, Deschênes M. Corticothalamic projections from layer 5 of the vibrissal barrel cortex in the rat. J Comp Neurol. 2000;424:197–204. doi: 10.1002/1096-9861(20000821)424:2<197::aid-cne1>3.0.co;2-6. [DOI] [PubMed] [Google Scholar]
- 6.Groh A, de Kock CPJ, Wimmer VC, Sakmann B, Kuner T. Driver or coincidence detector: Modal switch of a corticothalamic giant synapse controlled by spontaneous activity and short-term depression. J Neurosci. 2008;28:9652–9663. doi: 10.1523/JNEUROSCI.1554-08.2008. [DOI] [PMC free article] [PubMed] [Google Scholar]
- 7.Mease RA, Sumser A, Sakmann B, Groh A. Corticothalamic spike transfer via the L5B-POm pathway in vivo. Cereb Cortex. 2016;26:3461–3475. doi: 10.1093/cercor/bhw123. [DOI] [PMC free article] [PubMed] [Google Scholar]
- 8.Diamond ME, Armstrong-James M, Ebner FF. Somatic sensory responses in the rostral sector of the posterior group (POm) and in the ventral posterior medial nucleus (VPM) of the rat thalamus. J Comp Neurol. 1992;318:462–476. doi: 10.1002/cne.903180410. [DOI] [PubMed] [Google Scholar]
- 9.Meyer HS, et al. Cell type-specific thalamic innervation in a column of rat vibrissal cortex. Cereb Cortex. 2010;20:2287–2303. doi: 10.1093/cercor/bhq069. [DOI] [PMC free article] [PubMed] [Google Scholar]
- 10.Woolsey TA, Welker C, Schwartz RH. Comparative anatomical studies of the SmL face cortex with special reference to the occurrence of “barrels” in layer IV. J Comp Neurol. 1975;164:79–94. doi: 10.1002/cne.901640107. [DOI] [PubMed] [Google Scholar]
- 11.Wright AK, Norrie L, Arbuthnott GW. Corticofugal axons from adjacent “barrel” columns of rat somatosensory cortex: Cortical and thalamic terminal patterns. J Anat. 2000;196:379–390. doi: 10.1046/j.1469-7580.2000.19630379.x. [DOI] [PMC free article] [PubMed] [Google Scholar]
- 12.Franklin KBJ, Paxinos G. Paxinos and Franklin’s The Mouse Brain in Stereotaxic Coordinates. Academic; New York: 2012. [Google Scholar]
- 13.Oh SW, et al. A mesoscale connectome of the mouse brain. Nature. 2014;508:207–214. doi: 10.1038/nature13186. [DOI] [PMC free article] [PubMed] [Google Scholar]
- 14.Zakiewicz IM, Bjaalie JG, Leergaard TB. Brain-wide map of efferent projections from rat barrel cortex. Front Neuroinform. 2014;8:5. doi: 10.3389/fninf.2014.00005. [DOI] [PMC free article] [PubMed] [Google Scholar]
- 15.Liao CC, Chen RF, Lai WS, Lin RCS, Yen CT. Distribution of large terminal inputs from the primary and secondary somatosensory cortices to the dorsal thalamus in the rodent. J Comp Neurol. 2010;518:2592–2611. doi: 10.1002/cne.22354. [DOI] [PubMed] [Google Scholar]
- 16.Meyer HS, et al. Cellular organization of cortical barrel columns is whisker-specific. Proc Natl Acad Sci USA. 2013;110:19113–19118. doi: 10.1073/pnas.1312691110. [DOI] [PMC free article] [PubMed] [Google Scholar]
- 17.Nelder JA, Wedderburn RWM. Generalized linear models. J R Stat Soc Ser A. 1972;135:370–384. [Google Scholar]
- 18.Mease RA, Sumser A, Sakmann B, Groh A. Cortical dependence of whisker responses in posterior medial thalamus in vivo. Cereb Cortex. 2016;26:3534–3543. doi: 10.1093/cercor/bhw144. [DOI] [PMC free article] [PubMed] [Google Scholar]
- 19.Yu C, Derdikman D, Haidarliu S, Ahissar E. Parallel thalamic pathways for whisking and touch signals in the rat. PLoS Biol. 2006;4:e124. doi: 10.1371/journal.pbio.0040124. [DOI] [PMC free article] [PubMed] [Google Scholar]
- 20.Moore JD, Mercer Lindsay N, Deschênes M, Kleinfeld D. Vibrissa self-motion and touch are reliably encoded along the same somatosensory pathway from brainstem through thalamus. PLoS Biol. 2015;13:e1002253. doi: 10.1371/journal.pbio.1002253. [DOI] [PMC free article] [PubMed] [Google Scholar]
- 21.Groh A, et al. Convergence of cortical and sensory driver inputs on single thalamocortical cells. Cereb Cortex. 2014;24:3167–3179. doi: 10.1093/cercor/bht173. [DOI] [PMC free article] [PubMed] [Google Scholar]
- 22.Gauriau C, Bernard JF. Posterior triangular thalamic neurons convey nociceptive messages to the secondary somatosensory and insular cortices in the rat. J Neurosci. 2004;24:752–761. doi: 10.1523/JNEUROSCI.3272-03.2004. [DOI] [PMC free article] [PubMed] [Google Scholar]
- 23.Urbain N, Deschênes M. Motor cortex gates vibrissal responses in a thalamocortical projection pathway. Neuron. 2007;56:714–725. doi: 10.1016/j.neuron.2007.10.023. [DOI] [PubMed] [Google Scholar]
- 24.Giber K, et al. Heterogeneous output pathways link the anterior pretectal nucleus with the zona incerta and the thalamus in rat. J Comp Neurol. 2008;506:122–140. doi: 10.1002/cne.21545. [DOI] [PMC free article] [PubMed] [Google Scholar]
- 25.Wimmer VC, Bruno RM, de Kock CPJ, Kuner T, Sakmann B. Dimensions of a projection column and architecture of VPM and POm axons in rat vibrissal cortex. Cereb Cortex. 2010;20:2265–2276. doi: 10.1093/cercor/bhq068. [DOI] [PMC free article] [PubMed] [Google Scholar]
- 26.Alloway KD, Hoffer ZS, Hoover JE. Quantitative comparisons of corticothalamic topography within the ventrobasal complex and the posterior nucleus of the rodent thalamus. Brain Res. 2003;968:54–68. doi: 10.1016/s0006-8993(02)04265-8. [DOI] [PubMed] [Google Scholar]
- 27.Mease RA, Metz M, Groh A. Cortical sensory responses are enhanced by the higher-order thalamus. Cell Reports. 2016;14:208–215. doi: 10.1016/j.celrep.2015.12.026. [DOI] [PubMed] [Google Scholar]
- 28.Groh A, et al. Cell-type specific properties of pyramidal neurons in neocortex underlying a layout that is modifiable depending on the cortical area. Cereb Cortex. 2010;20:826–836. doi: 10.1093/cercor/bhp152. [DOI] [PubMed] [Google Scholar]
- 29.Mease RA, Krieger P, Groh A. Cortical control of adaptation and sensory relay mode in the thalamus. Proc Natl Acad Sci USA. 2014;111:6798–6803. doi: 10.1073/pnas.1318665111. [DOI] [PMC free article] [PubMed] [Google Scholar]
- 30.Edelsbrunner H, Kirkpatrick D, Seidel R. On the shape of a set of points in the plane. IEEE Trans Inf Theory. 1983;29:551–559. [Google Scholar]
- 31.Efron B. Bootstrap methods: Another look at the jackknife. Ann Stat. 1979;7:1–26. [Google Scholar]
Associated Data
This section collects any data citations, data availability statements, or supplementary materials included in this article.


