Significance
The balance between light harvesting and photoprotection is a critical component of photosynthetic efficiency and must be maintained in fluctuating light conditions. Two xanthophylls play key roles in the vascular plant response to changes in light intensity: zeaxanthin and lutein. Chlorophyll fluorescence decay studies of Arabidopsis thaliana mutants enabling the isolation of individual contributions of zeaxanthin and lutein to the response and a kinetic model of quenching make it possible to model the mutant data and predict the combined influence of zeaxanthin and lutein on nonphotochemical quenching in WT A. thaliana with the use of a single scaling factor. The model informs efforts to improve the response of plants to fluctuating light in natural environments and increase crop yields.
Keywords: nonphotochemical quenching, photoprotection, xanthophyll cycle, lutein epoxide cycle, kinetic model
Abstract
Photosynthetic organisms use various photoprotective mechanisms to dissipate excess photoexcitation as heat in a process called nonphotochemical quenching (NPQ). Regulation of NPQ allows for a rapid response to changes in light intensity and in vascular plants, is primarily triggered by a pH gradient across the thylakoid membrane (∆pH). The response is mediated by the PsbS protein and various xanthophylls. Time-correlated single-photon counting (TCSPC) measurements were performed on Arabidopsis thaliana to quantify the dependence of the response of NPQ to changes in light intensity on the presence and accumulation of zeaxanthin and lutein. Measurements were performed on WT and mutant plants deficient in one or both of the xanthophylls as well as a transgenic line that accumulates lutein via an engineered lutein epoxide cycle. Changes in the response of NPQ to light acclimation in WT and mutant plants were observed between two successive light acclimation cycles, suggesting that the character of the rapid and reversible response of NPQ in fully dark-acclimated plants is substantially different from in conditions plants are likely to experience caused by changes in light intensity during daylight. Mathematical models of the response of zeaxanthin- and lutein-dependent reversible NPQ were constructed that accurately describe the observed differences between the light acclimation periods. Finally, the WT response of NPQ was reconstructed from isolated components present in mutant plants with a single common scaling factor, which enabled deconvolution of the relative contributions of zeaxanthin- and lutein-dependent NPQ.
Photosynthesis begins with solar-driven electron transfer in reaction centers (1), but often, the energy available from sunlight outpaces the capacity for productive photochemistry in photosynthetic organisms. This mismatch can cause serious damage to the proteins that make up the photosynthetic apparatus. The fluctuations in light intensity experienced by higher plants necessitate both the rapid induction of photoprotective processes in response to high light conditions to prevent photodamage and subsequent relaxation of quenching to ensure optimal photosynthetic activity on return to low light conditions (2, 3). Although both of the photosynthetic reaction center complexes of higher plants, photosystem I (PSI) and photosystem II (PSII), experience photodamage and have photoprotective mechanisms, they are spectroscopically distinct, primarily because of the shallow nature of the PSII reaction center trap and the reversibility of primary charge separation in the PSII reaction center (P680+) relative to PSI. These features lead to longer-lived excitation in the PSII reaction center and therefore, a higher probability of damage when reaction centers are closed. Moreover, the shallow trap and reversibility of charge transfer in PSII reaction centers contribute to variability in fluorescence from PSII, which allows for the study of nonphotochemical quenching (NPQ) via fluorescence yield and lifetime measurements (4). The fluorescence from PSI is far less variable at room temperature.
Here, we discuss photoprotective mechanisms of PSII as observed via fluorescence lifetime measurements. The suite of photoprotective mechanisms that protect PSII collectively results in and is referred to as NPQ: the reduction in chlorophyll a (Chla) fluorescence yield caused by the dissipation of excess excitation by mechanisms other than photochemistry (5–7). Although NPQ’s various mechanisms allow for rapid response to excess light conditions, the overall response is slow to recover, leading to a period of potentially suboptimal photosynthetic efficiency (8). Understanding the multiple processes underlying NPQ could inform engineering of photoprotective systems to increase crop yields (3) or systems to protect bioinspired energy devices (9).
NPQ is a broad term encompassing several constituent components historically categorized by rate of induction and relaxation. For the quenching response of PSII in vascular plants, the components are often separated into the rapidly reversible, energy-dependent quenching component (qE) and the slowly reversible component associated with PSII photoinhibition (qI) (10, 11). Although important in many photosynthetic systems, a component of NPQ associated with excitation balance between PSI and PSII by altering the relative antenna size does not contribute significantly in vascular plants exposed to high light (5). The historic decoupling of rapidly reversible mechanisms from slower ones may not be as feasible as previously understood: subsequent work has indicated the complicated nature of the slow component called qI (12–16) and the roles of zeaxanthin in both a rapidly reversible and pH-dependent component called qE (17–22) and another component that depends on zeaxanthin but not pH termed qZ (23), making the distinction less clear and at times, arbitrary (7).
As of yet, there is little consensus surrounding the molecular mechanisms underlying the quenching pathways intrinsic to NPQ in PSII. However, several important players impacting the regulation of PSII photoprotection are widely agreed on. qE in higher plants is triggered by a high pH gradient (∆pH) formed across the thylakoid membrane, because productive photochemistry resulting in charge separation outpaces the activity of ATP synthase and other downstream processes (24). PsbS, which contains exposed protonatable residues, has been shown to be a sensor of ∆pH (25) and is necessary for qE in vivo (26). Finally, on the formation of ∆pH, violaxanthin deepoxidase (VDE) is activated, converting violaxanthin to antheraxanthin and zeaxanthin (27) in a cycle referred to by the abbreviation VAZ cycle. Some evidence suggests that zeaxanthin plays a direct role in quenching (19, 20), whereas other evidence suggests that zeaxanthin simply regulates lutein-dependent quenching allosterically (28, 29). So far, the direct roles of zeaxanthin and lutein in NPQ as participants in either the molecular mechanism of quenching or the molecular regulation of quenching remain unclear.
Although the accumulation of zeaxanthin from violaxanthin under high light conditions is ubiquitous among higher plants and has been studied extensively, an analogous cycle reflecting the accumulation of lutein from lutein epoxide (the LxL cycle), found in about 60% of plant species studied thus far, has recently become of interest (30–33). Because this LxL cycle regulates lutein levels in response to light intensity changes in a similar way to the regulation of zeaxanthin in the VAZ cycle, the LxL cycle is of interest to help determine the impact of different xanthophyll cycles on the activation and recovery of NPQ in PSII. Recently, transgenic lines of Arabidopsis thaliana modified to express zeaxanthin epoxidase from the alga Nannochloropsis oceanica have been produced (34), allowing the study of the isolated LxL cycle in a well-characterized model system. In this paper, we present spectroscopic studies of these lines and other xanthophyll mutants, and we examine the contribution of zeaxanthin- and lutein-dependent activation of NPQ in PSII to the full WT response.
Results and Discussion
To distinguish lutein-dependent quenching from zeaxanthin-dependent quenching, chlorophyll fluorescence lifetime snapshot measurements of whole leaves of A. thaliana sensitive to changes in Chla fluorescence in PSII were collected via time-correlated single-photon counting (TCSPC). The genetic lines studied include WT (wt; Columbia-0 ecotype), the szl1 mutant that lacks VAZ cycle xanthophylls and accumulates high levels of lutein (35), the double mutant szl1npq1 that is also defective in VDE activity (35), the lutein-deficient mutant lut2 (36), the novel lutein epoxide cycle transgenic mutant szl1+NoZEP1 (34), and lastly, the transgenic mutant szl1npq1+NoZEP1, which constitutively accumulates lutein epoxide and lacks zeaxanthin and therefore, cannot induce any rapidly reversible qE (34). The mutants studied and their properties are supplied in Table S1.
Table S1.
Lines of A. thaliana studied with explanation of mutations and effect on xanthophyll content and dynamics
| Name | Mutation | Effect |
| Col-0 (wt) | None | WT phenotype |
| lut2 | Mutated LCYE | Mutated LCYE inhibits formation of α-carotene and lutein |
| szl1 | Mutated LCYB | Mutated LCYB partially inhibits β-carotene formation and severely restricts accumulation of zeaxanthin, antheraxanthin, and violaxanthin |
| szl1npq1 | Mutated LCYB and mutated VDE | Mutated LCYB partially inhibits β-carotene formation and severely restricts accumulation of zeaxanthin, antheraxanthin, and violaxanthin; mutated VDE inhibits formation of zeaxanthin from antheraxanthin and violaxanthin |
| szl1+NoZEP1 | Mutated LCYB, addition of NoZEP1 | Mutated LCYB partially inhibits β-carotene formation and severely restricts accumulation of zeaxanthin, antheraxanthin, and violaxanthin; lutein is converted to lutein epoxide in dark conditions by NoZEP1, and lutein epoxide is converted to lutein in high light conditions by VDE, forming the LxL cycle |
| szl1npq1+NoZEP1 | Mutated LCYB and mutated VDE, addition of NoZEP1 | Mutated LCYB partially inhibits β-carotene formation and severely restricts accumulation of zeaxanthin, antheraxanthin, and violaxanthin; mutated VDE inhibits formation of zeaxanthin from antheraxanthin and violaxanthin and lutein from lutein epoxide in high light conditions |
| Lutein is converted to lutein epoxide in dark conditions by NoZEP1 |
LCYB, lycopene β-cyclase; LCYE, lycopene ε-cyclase; NoZEP1, zeaxanthin epoxidase from Nannochloropsis oceanica.
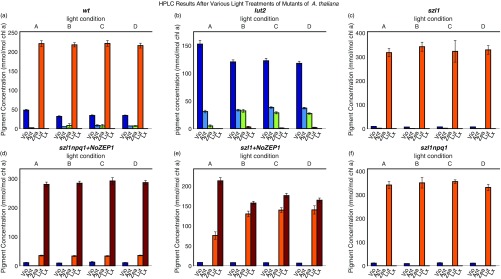
After 30 min of initial dark acclimation, TCSPC snapshots were collected during two periods of high light, each followed by a period of dark relaxation. The first cycle consisted of 20 min of high light, which is long enough to achieve quasisteady-state quenching lifetimes, followed by 10 min of darkness, chosen to be long enough to allow a return to steady-state unquenched lifetimes but short enough to maintain high levels of deepoxidized xanthophylls in plants with appropriate epoxidase and deepoxidase enzymatic cycles. The second cycle, which immediately followed the first, consisted of 7 min of high light followed by 3 min of darkness and served to show the response of the fluorescence lifetimes when the deepoxidized carotenoids are present at the onset of the induction of rapidly reversible qE. Additionally, the pigments present in leaf samples exposed to the same light cycles were quantified via high-performance liquid chromatography (HPLC). Fig. S1 summarizes these data.
Fig. S1.
HPLC results for mutants of Arabidopsis thaliana after light treatment corresponding to TCSPC snapshot measurements. (A–F) Light conditions for sets A–D consist of initial dark acclimation (set A) followed by a scheme corresponding to the light acclimation scheme used for TCPSC measurement (in the text). Set B corresponds to samples after the first 20 min of light acclimation of the scheme. Set C corresponds to samples after the next 10 min of dark acclimation. Set D corresponds to samples acclimated to the subsequent light–dark cycle of 7 min of high light followed by 5 min of dark.
Amplitude-Weighted Average Lifetimes via TCSPC.
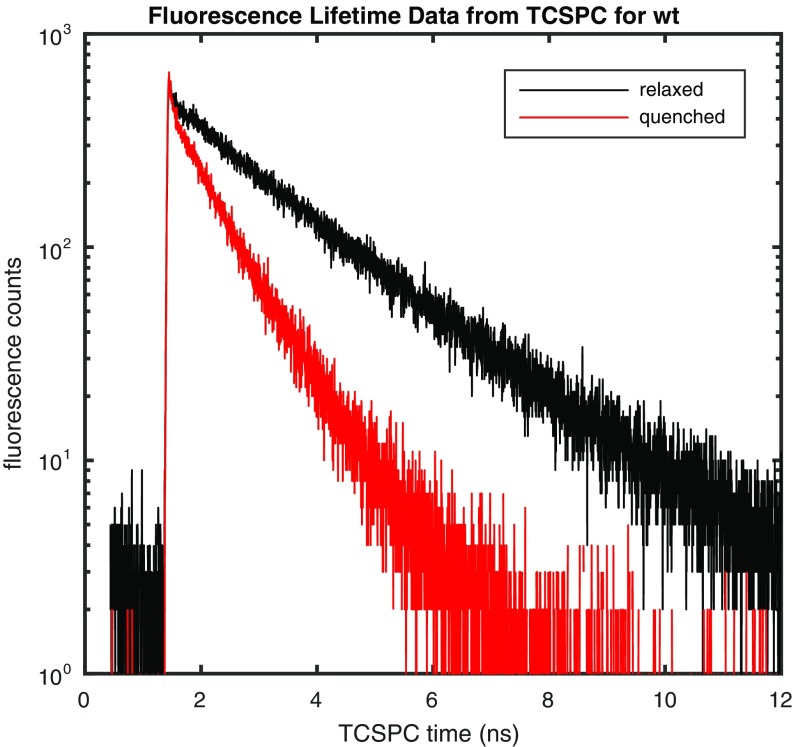
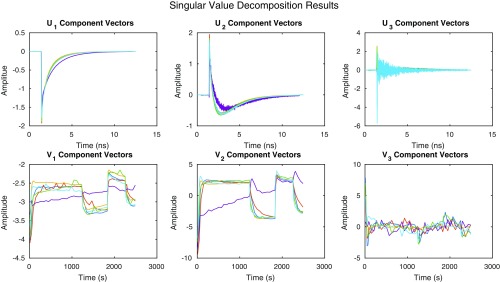
Representative fluorescence decays measured via TCSPC in the quenched and relaxed states of wt leaves are provided in Fig. 1. For the two decays shown, the dark-acclimated or relaxed average lifetime was 1.42 ns, and the quenched average lifetime obtained after 270 s of 745 μmol photons m−2 s−1 actinic light acclimation was 0.52 ns. The average lifetimes were obtained from an amplitude-weighted average of the fit of data to two lifetime components. The decision to fit the data to two lifetime components was made on analysis of a singular value decomposition (SVD) of the dataset (Fig. S2) that resulted in two singular vectors containing structure and remaining singular vectors displaying noise. The SVD result indicates that fitting more than two components does not extract additional meaningful information, reflecting the tradeoff between limited data collection time of snapshot measurements and the dynamic range of the fluorescence decay curves.
Fig. 1.
Representative fluorescence lifetime decays for dark-acclimated (relaxed) and light-acclimated (quenched) WT A. thaliana leaves. The average lifetime obtained for the sample shown was 1.42 ns for the relaxed state and 0.52 ns for the quenched state after 270 s of exposure to 745 μmol photons m−2 s−1 actinic light.
Fig. S2.
Singular value decomposition (SVD) results for the whole dataset. The average U and V vectors corresponding to the largest three singular values are shown for wt (blue), lut2 (red), szl1 (yellow), szl1npq1+NoZEP1 (purple), szl1+NoZEP1 (green), and szl1npq1 (cyan). Using the standard definition of the SVD, X = USV*, the decompositions were performed on matrices, X, composed of the vectors of raw fluorescence lifetime data corresponding to the actinic time points observed for a sample. The resulting decompositions were averaged over 20 samples for each line. In this construction, U is composed of the ultrafast dynamics basis vectors, V is composed of the actinic light acclimation time basis vectors, and S holds the singular values. The first two basis vectors of the ultrafast dynamics basis set clearly exhibit structure; the third exhibits far less structure. The actinic light acclimation basis set vectors exhibit two components with structure; the third exhibits noise. The singular values corresponding to the sets {U1, V1}, {U2, V2}, and {U3, V3} drop by an order of magnitude between each set. Collectively, the result indicates that fitting more than two components does not extract additional meaningful information, reflecting the tradeoff between limited data collection time of snapshot measurements and the dynamic range of the fluorescence decay curves.
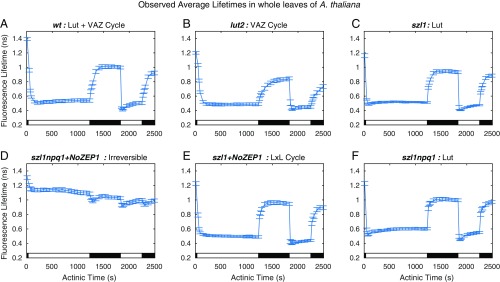
Fluorescence decays were collected from 20 samples per mutant over the course of the light acclimation scheme and fitted to determine the amplitude-weighted average lifetimes. The traces of average lifetimes for the different mutants over the course of acclimation are shown in Fig. 2. Mutants containing only a constant high level of lutein (szl1 and szl1npq1) (Fig. 2 C and F) display a rapid overshoot and relaxation to the steady-state quenching level in response to both light acclimation periods. Mutants containing a xanthophyll cycle (lut2, which accumulates zeaxanthin via the VAZ cycle, and szl1+NoZEP1, which accumulates lutein via the LxL cycle) (Fig. 2 B and E) do not display this overshoot in the first light acclimation period. The szl1npq1+NoZEP1 strain (Fig. 2D) containing neither xanthophyll cycle does not show any reversible quenching; wt plants (Fig. 2A) acclimate faster than lut2 mutants containing only the VAZ cycle but do not show the initial overshoot of szl1.
Fig. 2.
Average fluorescence lifetime traces over a two-cycle light acclimation scheme shown by the light and dark bars superimposed on the bottom of each plot for six A. thaliana strains. Error bars denote SD for n = 20. (A) The wt contains lutein and a VAZ cycle to form zeaxanthin in high light conditions. (B) The lut2 lacks lutein and has an active VAZ cycle. (C) The szl1 lacks zeaxanthin because of a partially blocked β-carotene biosynthesis pathway and contains more lutein than wt. (D) The szl1npq1+NoZEP1 strain does not have either xanthophyll cycle. (E) The szl1+NoZEP1 lacks zeaxanthin and contains a nonnative zeaxanthin epoxidase that functions on lutein, converting lutein to lutein epoxide that can be converted back to lutein by native VDE in high light. (F) The szl1npq1 contains lutein but lacks zeaxanthin because of blocking of the β-carotene biosynthesis pathway and inhibition of VDE.
Modeling.
To model the quenching processes observed in the data, a quenching parameter, , is calculated from the normalized average lifetimes, , allowing for direct comparison of the quenching behavior between different plant lines. The amplitude-weighted average lifetimes are proportional to fluorescence yield, , which is given by the ratio of the rate of fluorescence to the sum of the rates of all relaxation processes, including fluorescence, quenching, and other processes, such as energy transfer and intersystem crossing. The expression relating the average lifetimes to the quenching parameter is given in Eq. 1. The rates used for the various processes were obtained from Zaks et al. (37):
| [1] |
The parameter is a dimensionless modifier of the effective quenching rate and a function of activated PsbS, lutein, zeaxanthin, and other variables. The product of kquenching and produces an effective rate of quenching that results in the observed lifetimes. Although previous work has attributed to a fraction of activated quenching sites (37), this type of analysis is also valid for more complicated underlying mechanistic details of energy dissipation, such as the alterations to the rate of quenching at an individual site, the density of quenching sites, or multiple types of quenching sites. For simplicity, a single constant rate of quenching at each site, , is assumed, and can be considered an effective fraction within these caveats. The particular choice of the value of does not severely impact the observed behavior of the quenching dynamics but linearly scales the numerical values of obtained from the average lifetime and the numerical values of parameters that describe the dynamical behavior. is similar to the usual NPQ parameter (1) calculated from, for example, PAM fluorescence traces but is scaled to reflect estimates of the physical processes involved and emphasizes the competition in the experiment between quenching and fluorescence or productive photochemical pathways.
Because the denominator of Eq. 1 is the sum of rates of various processes, using the parameter allows for the direct addition and subtraction of various quenching processes within and across mutant strains. In this work, is partitioned into a reversible component and an irreversible component based on the observed behavior per Eq. 2:
| [2] |
The szl1npq1+NoZEP1 strain contains no lutein or zeaxanthin and displays nearly monotonically increasing quenching over the course of the experiment. The values calculated from szl1npq1+NoZEP1 lifetimes via Eq. 1 are identified solely as irreversible quenching, . These values can be subtracted from the values of calculated from other strains to isolate the values of reversible quenching, .
Reversible quenching was modeled using differential equations describing a pair of two-state systems. The systems individually represent lutein- and zeaxanthin-dependent quenching, and each system contains “active” and “inactive” quenching states. The solution to the differential equation for the active quenching states, , gives predicted values of caused by either lutein or zeaxanthin for comparison with experimental results. The differential equations are simple kinetic rate equations with activation rates given by functions of the variables ∆pH across the membrane, the concentration of activated PsbS, and the concentration of the appropriate xanthophyll(s).
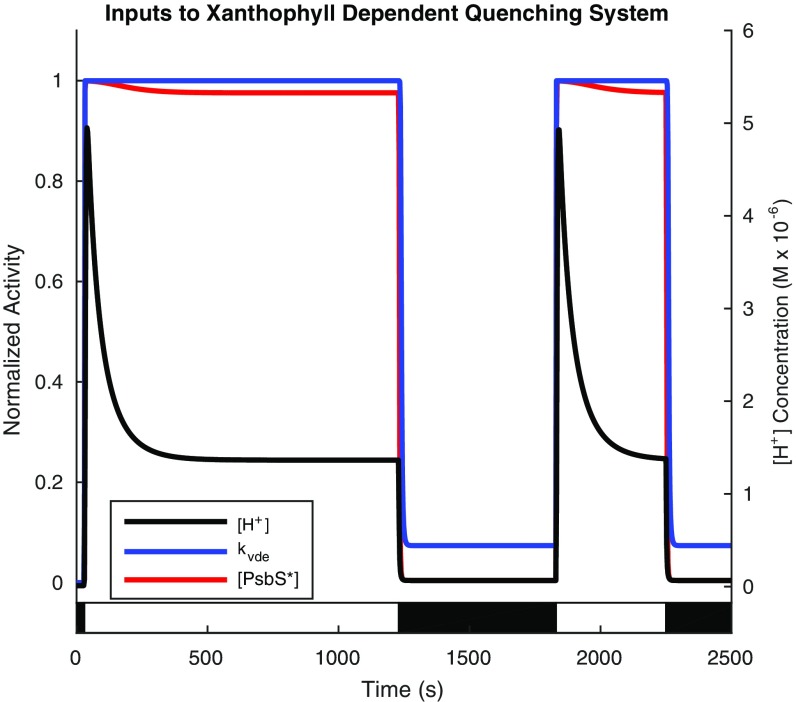
The dynamics of ∆pH and the activation of PsbS and VDE in response to ∆pH were obtained from the model described by Zaks et al. (37). Their work concluded that the temporal behavior of ∆pH across the thylakoid membrane was insensitive to the detailed parameters of the model of quenching. Therefore, ∆pH is a function solely of time for a given light acclimation scheme and does not depend on the differential equations. Qualitatively, ∆pH has a fast initial rise on the timescale of seconds on exposure to high light, which then peaks and decays to a steady-state level on the timescale of a few minutes. On initiation of dark relaxation, ∆pH decays from the high-light steady-state level to a dark-adapted steady-state level on the timescale of seconds. The plot of ∆pH in terms of the [H+] concentration gradient and normalized activity of PsbS and VDE is shown in Fig. S3.
Fig. S3.
Dynamics of thylakoid membrane ∆pH in terms of [H+] concentration gradient and activation of PsbS and VDE. The black line shows the [H+] concentration for the light acclimation scheme shown in the light and dark bars superimposed on the plot. It displays a rapid spike on high light exposure followed by a decay to a steady-state value; on dark acclimation, [H+] concentration rapidly recovers to a dark-adapted quasisteady-state value. The blue line shows the normalized activity of VDE, which is activated on the formation of the ∆pH. The red line shows the normalized activation of PsbS on the formation of the ∆pH. All values were obtained from the model provided in the work by Zaks et al. (37).
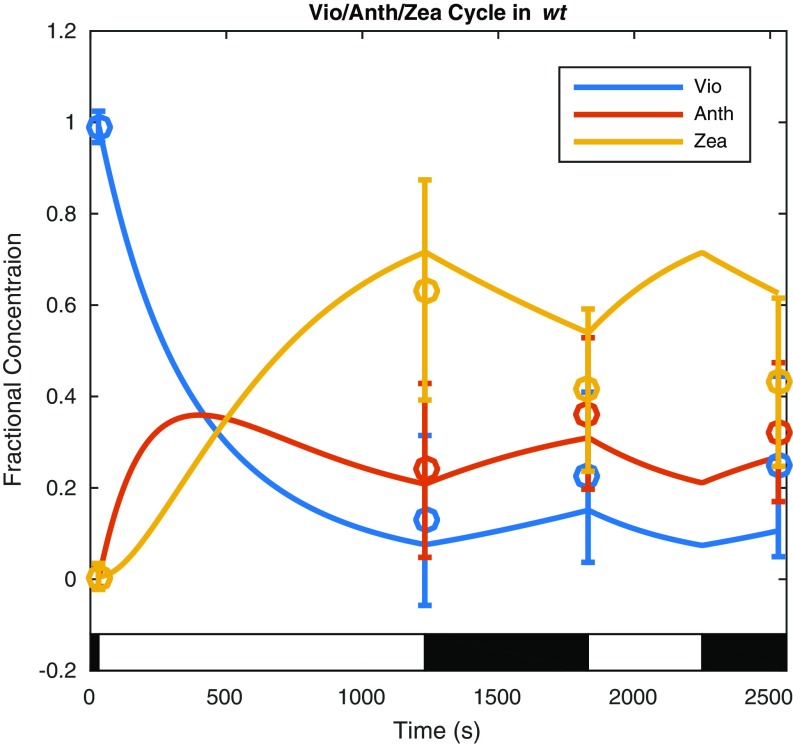
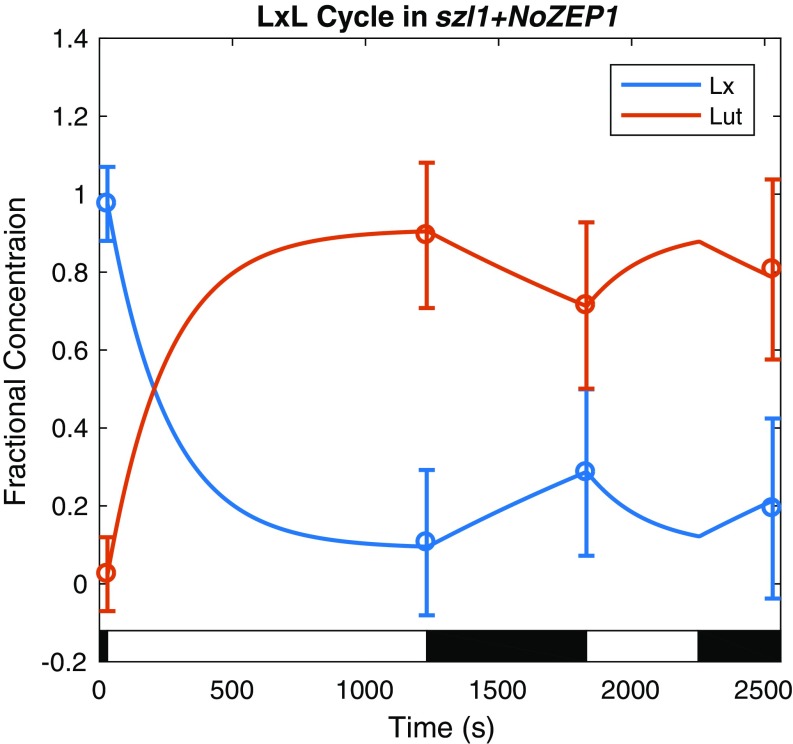
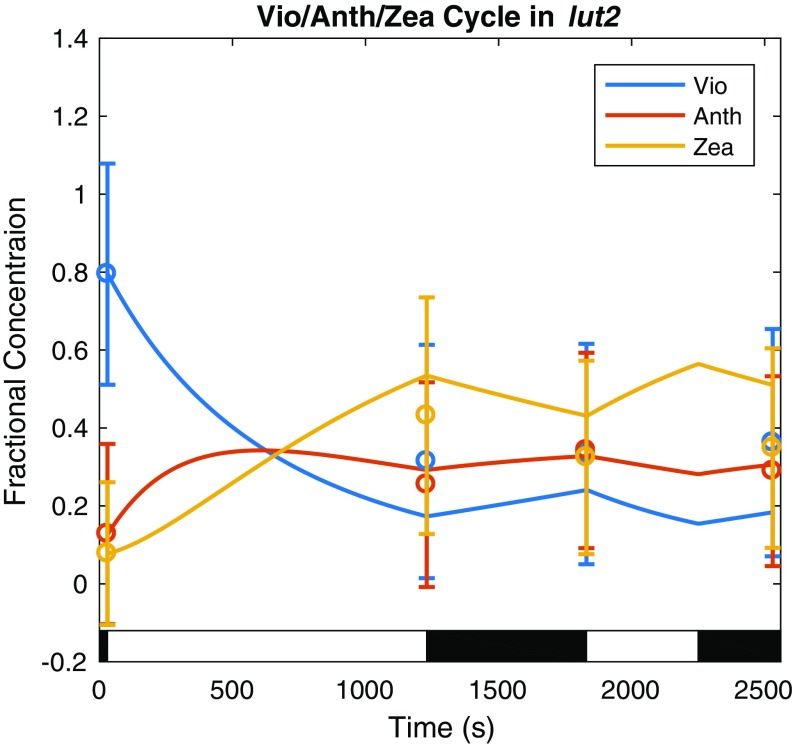
The kinetics of the xanthophyll cycles depend on the activation of VDE by ∆pH; concentrations of the xanthophylls were obtained by fitting a first-order kinetic model with ∆pH-dependent rates of deepoxidation described by Zaks et al. (37) for each relevant mutant to HPLC data to interpolate between measurements. A plot of the wt xanthophyll cycle showing the fractional concentrations of each pigment normalized to the total concentration of the three pigments available for interconversion is shown in Fig. 3. Similar fits were performed for the szl1+NoZEP1 strain, containing the LxL cycle, showing the expected conversion from lutein epoxide to lutein in response to high light conditions, and the lut2 mutant, containing the same VAZ cycle as wt (Figs. S4 and S5).
Fig. 3.
Dynamics of the wt xanthophyll cycle in response to the light acclimation scheme shown in the light and dark bars superimposed on the plot fit to HPLC data are shown here. The data are represented by a fit of the fractional concentration of the available pool of violaxanthin (Vio), antheraxanthin (Anth), and zeaxanthin (Zea) to the available pool of xanthophylls determined from analysis of HPLC measurements (Materials and Methods) at four time points (circles with error bars denoting SD for n = 8) using a first-order kinetic model with a ∆pH-dependent rate of deepoxidation (solid lines).
Fig. S4.
Dynamics of the szl1+NoZEP1 LxL cycle in response to the light acclimation scheme shown in the light and dark bars superimposed on the plot fit to HPLC data are shown here. The data are represented by a fit of the fractional concentration of the available pool of lutein and lutein epoxide to the available pool of xanthophylls determined from analysis of HPLC measurements (Materials and Methods) at four time points (circles with error bars denoting SD for n = 8) using a first-order kinetic model with a ∆pH-dependent rate of deepoxidation (solid lines).
Fig. S5.
Dynamics of the lut2 VAZ cycle in response to the light acclimation scheme shown in the light and dark bars superimposed on the plot fit to HPLC data are shown here. The data are represented by a fit of the fractional concentration of the available pool of violaxanthin (Vio), antheraxanthin (Anth), and zeaxanthin (Zea) to the available pool of xanthophylls determined from analysis of HPLC measurements (Materials and Methods) at four time points (circles with error bars denoting SD for n = 8) using a first-order kinetic model with a ∆pH-dependent rate of deepoxidation (solid lines).
The pool of violaxanthin available for deepoxidation was quantified using Monte Carlo methods to determine the minimum quantity of violaxanthin present using bootstrap resampling of the HPLC data. This technique, described in detail in Materials and Methods, indicated that ∼60% of the measured violaxanthin was unavailable for deepoxidation on the timescales of light acclimation in the experiment, in good agreement with previous work (38). The same technique was used to remove background antheraxanthin and zeaxanthin present in the dark-acclimated state. The fractional concentration was calculated as the fraction of each individual xanthophyll over the sum of the available pool of xanthophylls.
Lutein-Dependent Quenching.
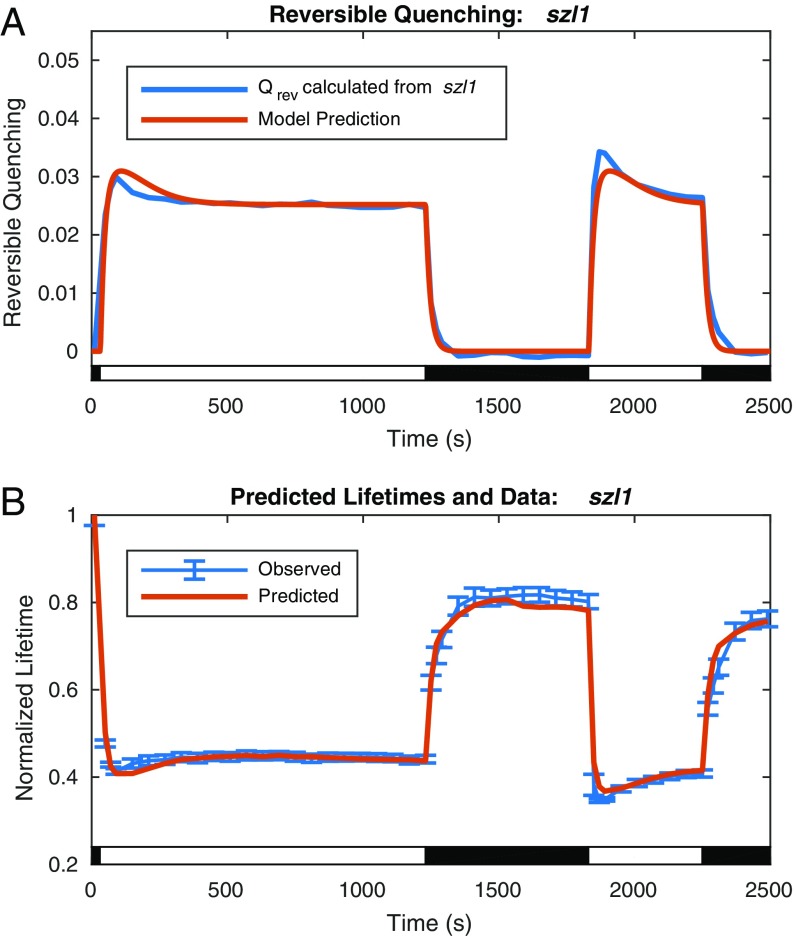
The constant value of lutein in the mutant szl1, which contains no zeaxanthin, is the simplest system to model. The constant lutein-dependent reversible quenching model is
| [3] |
| [4] |
The time dependence of is caused by the time dependence of the activated fraction of PsbS, , which in turn, depends on the ∆pH. The time-dependent activation constant is defined in the form of a Hill equation:
| [5] |
The constants and n describe an equilibrium point and an interaction coefficient of quenching sites activated by PsbS, respectively. Together with , a scaling constant, these constants, which determine the activation, , and recovery, , rates of the quenching, were obtained by fitting solutions of in Eq. 3 to values of calculated from szl1 lifetime values via Eqs. 1 and 2. A plot of the resulting model, comparing the fit values of with the values of calculated from szl1 lifetime values and the predicted lifetimes for szl1, is shown in Fig. 4.
Fig. 4.
Comparison of model to reversible quenching calculated from szl1 lifetime data via Eqs. 1 and 2 and predicted lifetime with data for szl1. (A) The modeled reversible lutein-dependent quenching (red line) compared with the reversible quenching values calculated from szl1 lifetime data after background subtraction of the irreversible quenching present in szl1npq1+NoZEP1 (blue line). (B) Normalized fluorescence lifetimes predicted by the model on reconstruction of fluorescence yield from the model for lutein-dependent reversible quenching in szl1 and the irreversible quenching extracted from szl1npq1+NoZEP1 (red line) compared with data (blue line; data points with error bars denoting SD for n = 20).
The two plots of and the lifetime values are essentially reciprocals as a consequence of Eqs. 1 and 2. What appears as a slight dip in the lifetime at early acclimation times is reflected in a larger apparent spike, or overshoot of the steady state, in the value of the . The model is able to describe the initial overshoot of quenching in response to high light, the steady-state level during light exposure, and the recovery in dark. Small discrepancies remain between the light acclimation periods, with the initial overshoot overestimated in the first period and underestimated in the second period. On recovering the predicted lifetimes from the model for szl1 and the irreversible quenching from szl1npq1+NoZEP1, it is apparent that these discrepancies are commensurate in scale with the uncertainty in the data. In this simple system, reversible quenching, , appears to track directly with the previously predicted ∆pH.
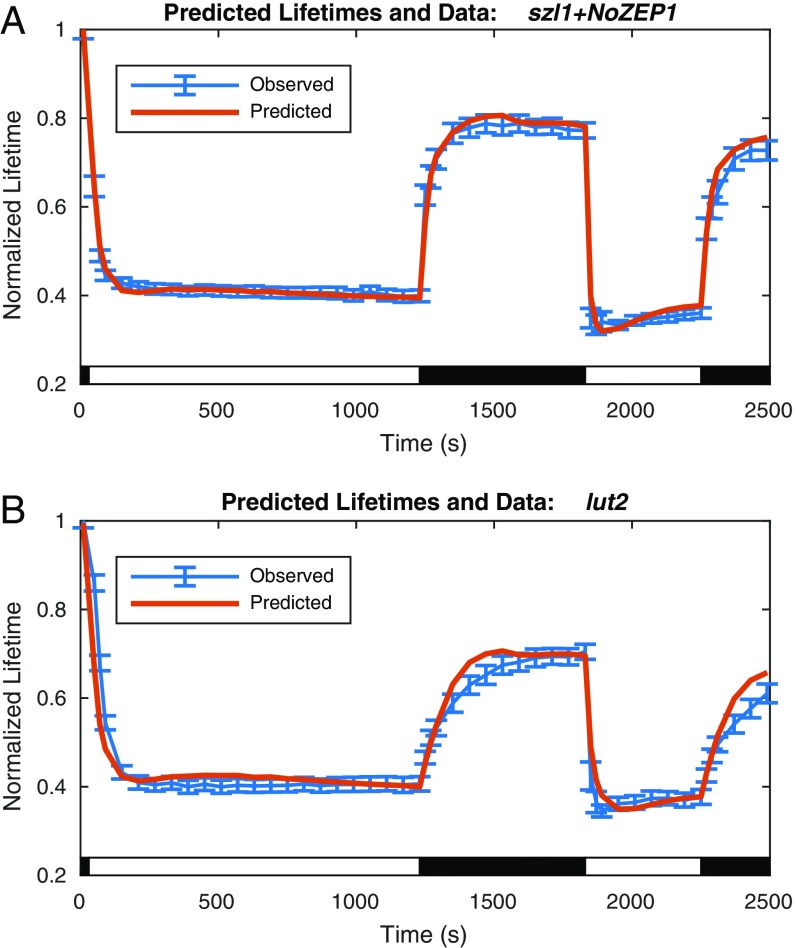
Next, we modeled the szl1+NoZEP1 strain, which contains the LxL cycle, adding a further complication to account for in our model. In the LxL cycle, lutein epoxide is deepoxidated to lutein in response to the formation of ∆pH. Therefore, in addition to the activation of quenching in response to high light, lutein accumulates. The LxL cycle was verified by HPLC and fit to a first-order kinetic model as discussed above and shown in Fig. S4. To account for the impact of the accumulation of lutein on the quenching behavior, the activation rate in the previous model of szl1 quenching was modified to contain the product of two responses: one to the activated PsbS as shown previously, and a second response to the concentration of lutein, also in the form of a Hill equation. The time-dependent activation rate is redefined as
| [6] |
which incorporates an additional , an equilibrium value, and m, an interaction coefficient, in the Hill-type response to lutein. A comparison of predicted lifetimes associated with best fit solutions of to values of , calculated from szl1+NoZEP1 lifetime data using Eqs. 1 and 2, is shown in Fig. 5A.
Fig. 5.
Comparison of predicted and observed lifetimes for szl1+NoZEP1 and lut2. (A) Normalized fluorescence lifetimes predicted by the model of reversible quenching for the LxL cycle mutant szl1+NoZEP1 and irreversible quenching from szl1npq1+NoZEP1 (red line) compared with szl1+NoZEP1 lifetime data (blue line; with data points with error bars denoting SD for n = 20). (B) Normalized fluorescence lifetimes predicted by the model of reversible quenching for the luteinless VAZ cycle mutant lut2 and irreversible quenching from szl1npq1+NoZEP1 (red line) compared with lut2 lifetime data (blue line; with data points with error bars denoting SD for n = 20).
The model captures much of the behavior of the lutein-dependent quenching in szl1+NoZEP1: a smooth transition from the dark-acclimated lifetime to a steady-state quenched lifetime in the first acclimation period followed by a sharp spike in the second acclimation period. Because of the additional complicating factor of the accumulation of lutein, the direct correspondence between ∆pH and seen in szl1 mutants is obscured. The initial accumulation of lutein suppresses the overshoot that is seen in the second acclimation period, when lutein is present at the outset because of the slower rate of reepoxidation.
Zeaxanthin-Dependent Quenching.
The lifetime data show similar characteristics for the LxL cycle strain szl1+NoZEP1 (Fig. 5A) and the luteinless mutant lut2 (Fig. 5B), which only contains the native A. thaliana VAZ cycle, suggesting that a similar model can be used to describe zeaxanthin-dependent quenching. The same two-state system, with analogous terms containing an activation rate formed from the product of response to activated PsbS and the xanthophyll and a constant recovery rate, was used but with zeaxanthin substituted for lutein. This construction is sufficient to account for the zeaxanthin- and ∆pH-dependent portion of the quenching response (usually thought of as a portion of qE).
However, on close examination, there is a discrepancy between the reversible quenching behavior of the LxL cycle szl1+NoZEP1 mutant and the VAZ cycle lut2 mutant seen in the recovery displayed in the dark. Although the reversible quenching of the LxL cycle szl1+NoZEP1 strain recovers fully on dark relaxation, the reversible quenching of the VAZ cycle lut2 mutant does not fully recover on dark relaxation because of the contribution of zeaxanthin-dependent but non–∆pH-dependent quenching [qZ (23)]. To account for this difference, an additional term is required in the model differential equations. The additional term is independent of and linearly dependent on the concentration of zeaxanthin. It carries the opposite sign as the recovery term and shifts the steady-state recovery level when zeaxanthin is present. Although the non–∆pH-dependent quenching operates on a timescale slower than the ∆pH-dependent quenching, it is still included in the values of determined from the partitioning scheme. The model system, therefore, is given by
| [7] |
| [8] |
| [9] |
where the first two terms, including , are analogous to the model for the LxL cycle szl1+NoZEP1 strain and the final term accounts for the zeaxanthin-dependent, non–∆pH-dependent quenching behavior unique to zeaxanthin. The predicted lifetimes associated with fit of values of to values of calculated from lut2 lifetime values by the same method as previously described are shown in Fig. 5B. The fit values again capture the differences between the first and second light acclimation periods, this time caused by the accumulation of zeaxanthin but analogous to the accumulation of lutein. The additional term unique to this model also captures the shift in the recovery level caused by the zeaxanthin-dependent, non–∆pH-dependent qZ behavior.
Constructing wt Quenching from Components.
The zeaxanthin- and lutein-dependent quenching in the mutants containing just one of two xanthophylls allows for a comparison of the ability to quench on a per-lutein or -zeaxanthin basis. Quantities of lutein and zeaxanthin determined from HPLC were normalized to the quantity of Chla, and in turn, the quasisteady-state values of quenching associated with lutein and zeaxanthin were compared on normalizing by the quantity of lutein and zeaxanthin present at quasisteady state. The quasisteady-state quenching values for the lutein-dependent quenching in szl1, normalized to the quantity of lutein, were approximately 10 times lower than the quasisteady-state values of zeaxanthin-dependent quenching in lut2, normalized to the quantity of zeaxanthin. This analysis indicates that, on average, each zeaxanthin molecule contributes 10 times more to the overall quenching than each lutein molecule. The difference could be because of either a difference in actual rate of quenching or a difference in the fraction of time in which each molecule is in a quenching state when activated, resulting in a reduced density of quenching sites not accounted for by the concentrations. However, this analysis relies on homogeneous contributions and does not account for potentially nonuniform contributions of the lutein and zeaxanthin molecules (e.g., if only a specific and unique fraction of the lutein molecules present contributes to quenching dynamics, the analysis fails).
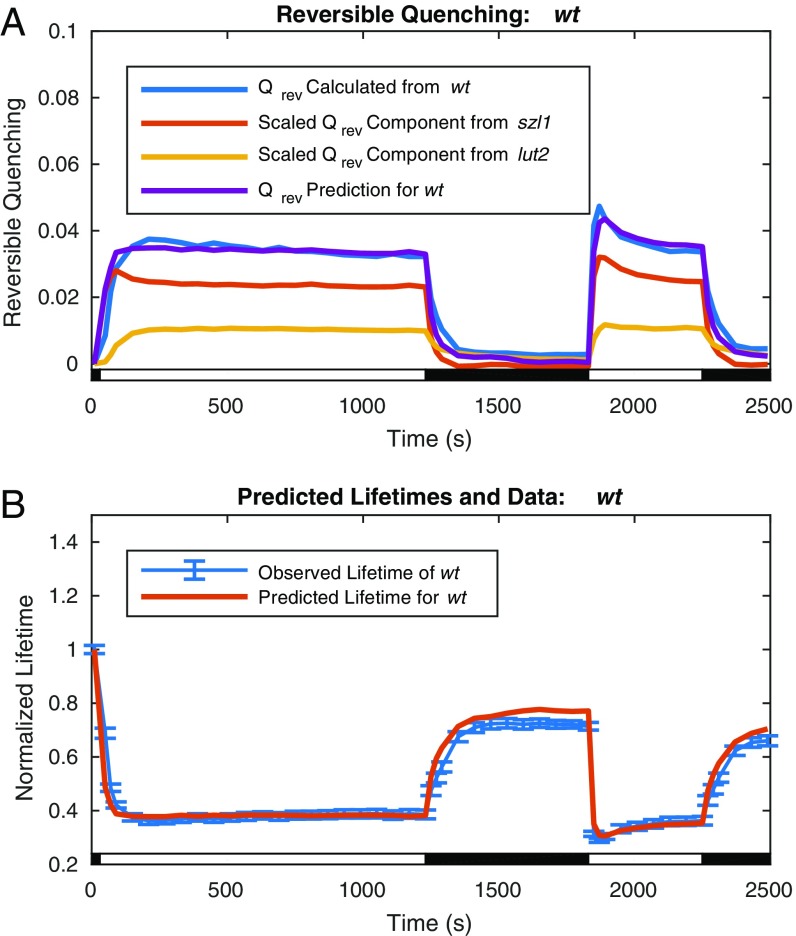
One way to test whether the models developed for szl1 and lut2 have captured the essence of the quenching process involving these two xanthophylls is to use these models to predict the wt response. The zeaxanthin-dependent reversible quenching calculated from lut2 lifetime measurements using Eqs. 1 and 2, denoted , and the lutein-dependent reversible quenching calculated from szl1 lifetime measurements, again using Eqs. 1 and 2, denoted , were each weighted by the ratio of the average concentrations of the relevant carotenoids present in wt relative to the mutant overexpression levels and added to obtain a predicted wt quenching value containing the behavior of both lutein- and zeaxanthin-dependent quenching. This value was multiplied by a single common scaling factor, α, to fit the value of calculated using Eqs. 1 and 2 from wt lifetime measurements, denoted . The expression for the predicted wt reversible quenching is
| [10] |
The lutein and zeaxanthin ratios in Eq. 10 were determined from the HPLC data to be 0.67 and 0.24, respectively. The scaling factor, α, was fitted to 1.37.
Plots of the reconstructed wt quenching parameter, , are compared with values calculated from wt lifetime data via Eqs. 1 and 2 in Fig. 6A; the wt lifetimes predicted from the reconstruction are compared with the measured wt lifetime data in Fig. 6B. The reversible quenching values, and , calculated from lifetime data from lut2 and szl1 are plotted after scaling by the ratio of the concentrations and together with their sum the predicted reversible quenching for wt, . The predicted value of the reversible quenching for wt from the components agrees well with the value calculated directly from the wt lifetime data. The lifetimes resulting from these values in Fig. 6B show that the variation from the observed wt lifetime data is on the order of the uncertainty of the measurement.
Fig. 6.
Comparison of wt reversible quenching calculated from lifetime data via Eqs. 1 and 2 with predicted values calculated from szl1 and lut2 mutant lifetime data via Eq. 10 and corresponding lifetimes. (A) Reversible quenching calculated via Eqs. 1 and 2 from wt lifetime data (blue) agrees well with the predicted reversible quenching (purple) obtained from szl1 (red) and lut2 (yellow) contributions via Eq. 10 (in the text). (B) The wt lifetimes (red) predicted from the wt reversible quenching obtained via Eq. 10 and irreversible quenching from szl1npq1+NoZEP1 are within the error of the observed lifetimes of wt (blue; including error bars indicating SD for n = 20).
The success of our approach in reproducing both the steady-state quenching and the quantitative value of the overshoot in the second light acclimation period with only a single common scaling factor has several implications. First, the finding supports the previous analysis of the relative average contributions to quenching of each xanthophyll. Linear scaling by the xanthophyll concentrations reproduces the observed wt quenching across a range of quenching values, suggesting that, for the range of concentrations found in the mutants studied, the contributions of each molecule in the xanthophyll pool are indeed homogenous. Microscopically, achieving homogeneous contributions corresponds to a regime where the activation of quenching sites is limited by the availability of the xanthophylls and does not correspond to a regime limited by binding sites capable of quenching. In the alternative regime, the ratio of participating sites to concentration of the xanthophylls would not scale linearly across the range of observed quenching values. Instead, the quenching would scale linearly with the available binding sites. At yet higher concentrations of xanthophylls (e.g., in mutants that more strongly overexpress the xanthophylls), these regimes may no longer hold true.
Second, despite correctly predicting the ratio between the steady-state and overshoot quenching on scaling the contributions by the average concentrations of the xanthophylls, the additional common scaling factor, , is still required to quantitatively predict the observed wt quenching values. There are several possible explanations for the scaling factor. For example, the presence of both xanthophylls may increase the density of quenching sites for a given concentration of each xanthophyll because of more efficient binding of the correct xanthophyll in certain sites. Furthermore, there is evidence that substitution at lutein or zeaxanthin sites occurs in mutants lacking the preferred xanthophyll (35). On substitution, changes in quenching rate caused by the substitute xanthophyll could result in reduced quenching for a given density of quenchers in mutants lacking the correct xanthophyll. Finally, in sites where zeaxanthin and lutein are in close proximity to both one another and a chlorophyll, the combined presence may work to cooperatively increase the quenching rate beyond the rates of quenching possible in the presence of either xanthophyll individually (28, 29). However, because both lutein-dependent quenching and zeaxanthin-dependent quenching are able to operate independently, it seems that zeaxanthin is unlikely to function solely as an allosteric regulator. Reasonable physical models (39) could help evaluate the extent that various possibilities could explain the behavior observed for wt quenching. Determining the density of quenching sites required to predict the lutein- and zeaxanthin-dependent quenching and comparing with wt would indicate which, if any, of these effects is consistent with the observed behavior, but it may be difficult to decouple the product of quenching rate and quenching site density, thus requiring additional constraints to separate these quantities.
Conclusion
There are multiple mechanisms that contribute to NPQ in wt plants. We have shown the use of NPQ data from various mutants to isolate specific contributions from lutein and zeaxanthin and use these to reconstruct the response of the wt, which results from several (two or more) different contributions. The success of the approach of Kromdijk et al. (3) in increasing plant productivity by changing expression levels of VDE, zeaxanthin epoxidase, and PsbS indicates that optimizing the rates of violaxanthin to zeaxanthin and lutein epoxide to lutein interconversion along with the concentration of PsbS is a viable route to increased photosynthetic yield. The kinetic model developed here will enable optimal values of concentrations and yields to be explored and tested in real field trials to determine if the 15% increase described in Nicotiana (tobacco) (3) can be further improved on. From the perspective of refining the model, the distinct differences observed between the two light acclimation periods suggest that varying frequency periodic illumination periods could enable the separation of the multiple quenching processes that occur on different timescales, but for example, all depend on the presence of zeaxanthin.
Materials and Methods
Plant Material and Growth Conditions.
A. thaliana WT plants (Col-0) and mutant plants lut2, szl1, szl1npq1, szl1+NoZEP1, and szl1npq1+NoZEP1 were germinated on plates, transplanted to pots, and grown in growth chambers under 110 μmol photons m−2 s−1 on a 10-h day, 14-h night schedule at 23 °C. Mutant descriptions are shown in Table S1. The LxL cycle strains (34) were screened for homozygosity on plates containing Basta. The NPQ phenotype of these mutants, which contain zeaxanthin epoxidase from N. oceanica (40), was confirmed using pulse-amplitude modulated (PAM) fluorescence using an IMAGING-PAM M-series (Heinz Walz) instrument to monitor NPQ capacity. Lastly, HPLC data confirmed the presence of lutein epoxide, which is conclusive evidence of the functionality of the nonnative zeaxanthin epoxidase from N. oceanica in A. thaliana plants. All plants were between 6 and 9 weeks of age at the time of experiments, and all measurements were completed before the stage of bolting as described previously (41).
TCPSC Measurements.
Each sample set was made up of 20 whole leaves from each respective genotype. Before TCSPC snapshot experiments, plants were dark-acclimated for 30 min to ensure that the relevant xanthophylls in plants containing xanthophyll cycles were in their inactive, epoxidized state at the start of the experiment. All plant lines except for lut2 were exposed to 745 μmol photons m−2 s−1 during high light periods. Lut2 plants were subjected to 620 μmol photons m−2 s−1 during periods of high light to achieve similar quenched average lifetimes as szl1+NoZEP1 exposed to 745 μmol photons m−2 s−1 high light periods to facilitate comparison of the shape of the two decay curves at intensities where the average lifetimes of the two mutants are the same. The decay curves of lut2 and szl1+NoZEP1 were very similar, as were the fitted parameters, limiting the extraction of any mechanistic implications. However, the change from 745 to 620 μmol photons m−2 s−1 should not significantly impact the analysis reported in this work. In contrast to PAM traces, data from TCPSC measurements are relatively insensitive to changes in high light intensity, because time resolving the fluorescence eliminates sensitivity to nonquenching processes, including chloroplast avoidance (41). The remaining differences that could have implications for the reconstruction of wt from components were subsequently accounted for by normalization of the average lifetimes and the resulting zeaxanthin concentration in lut2 compared with wt. Plants were kept under 100 μmol photons m−2 s−1 of light when not being dark-acclimated, and no plant was dark-acclimated more than once during any 1.5-h period.
After initial dark acclimation, TCSPC snapshots were collected during two cycles of high light followed by dark relaxation. The first cycle consisted of 20 min of high light followed by 10 min of darkness. The second cycle, immediately after the first cycle, consisted of 7 min of high light followed by 3 min of darkness. Leaves were removed from dark-acclimated plants immediately before TCSPC experiments and placed in a home-built holder that allows the leaf surface to be mostly exposed to air to avoid overheating and drying during the experiment and has a small well to hold water for the petiole to take up during the experiment as described previously (41).
The TCSPC setup was similar to the ones described in the works by Sylak-Glassman et al. (41) and Amarnath et al. (42). A 532-nm Coherent Verdi G10 diode laser pumped an ultrafast Ti:Sapph Coherent Mira 900f oscillator with the birefringence adjusted, such that the center wavelength was 840 nm with an FWHM of ∼9 nm. The 840-nm output pulses from the Mira were then frequency doubled to 420 nm using a beta barium borate crystal to excite the Soret band of Chla. Before the sample area, the beam was split by a beam splitter, so that a small portion was sent to a sync photodiode and acted as a reference pulse for the TCSPC measurements, whereas the remainder was sent to the sample area, where it was incident on the leaf. Data were acquired using a Becker & Hickl SPC-850 data acquisition card in conjunction with the appropriate Becker & Hickl software and the sequence of shutter operations executed using LabView. The portion of the beam that reached the sample was incident on the leaf at a 70° angle to the adaxial side of the leaf. The average power of the laser at the sample was 1.75 mW, corresponding to about 1,800 μmol photons m−2 s−1 of light, which is enough to reach saturation of closed reaction centers (43), with a pulse energy of 19.8 pJ. A monochromator (HORIBA Jobin-Yvon; H-20) set to transmit 684 ± 8 nm was placed before the MCP PMT detector (Hamamatsu R3809U MCP-PMT) to selectively observe fluorescence from the Qy band of Chla molecules in PSII. The actinic light source was a Leica KL1500 LCD with dual gooseneck fiber optic cables to allow for acclimation of two samples to the same light conditions simultaneously.
The detector was cooled to −30 °C, and the gain was set to 94% (controlled by Becker & Hickl software), yielding an instrument response function with an FWHM of 36–38 ps. Each fluorescence lifetime snapshot consisted of a 1-s period of laser exposure and data collection. The lifetime data were partitioned into five 0.2-s steps. During subsequent analysis, the step with the longest average lifetime, which corresponds to the step with the highest fluorescence yield in a PAM trace, was retained as the measurement with the reaction centers closed, similar to ref. 41.
Data Analysis.
To avoid the need for additional physically meaningless lifetime components, each curve was fitted individually to a biexponential function using nonlinear least squares analysis rather than aligning the curves according to their maxima and summing them to average the data before fitting. This method also allowed for the step with the reaction center closed to be chosen before any averaging was done, ensuring that the reaction centers were closed in each leaf for each snapshot rather than just on average. SDs on each fit parameter were calculated from the Jacobian, and a reduced χ2 value was calculated for each fit to confirm goodness of fit. Residuals of several curves from each dataset were examined as an additional check on goodness of fit. Furthermore, singular value decomposition revealed only two components, validating the use of a biexponential function to fit the data (Fig. S2).
After each curve was fitted to a biexponential decay function, the amplitude-weighted average lifetime associated with each decay was calculated, and the uncertainty associated with it was determined from the SD of the fit parameters. Next, the step with the longest lifetime was chosen as the step with the reaction centers closed to saturation. At this point, the rest of the data were discarded, and only the data collected when the reaction centers were identified as closed to saturation were further analyzed. The fits for each snapshot were used to calculate uncertainty-weighted averages of each of the components across 20 leaf samples. Because of normal variability in fluorescence yield from different leaves, it was necessary to normalize the amplitudes associated with the decay times to sum to one to make them comparable across all samples. The average amplitude-weighted lifetime across 20 samples was calculated for each snapshot from the uncertainty-weighted averages of the fit parameters, and the uncertainties on the parameters were then used to calculate the uncertainty on the average amplitude-weighted lifetime for each decay. Decay time, amplitude, and average amplitude-weighted lifetime for each snapshot/decay were then bootstrapped by examining the variation across resampling of the data from 20 samples collected for each snapshot during TCSPC. Because the amplitudes were normalized to sum to one, their uncertainties cannot be decoupled. The uncertainty on the amplitude of the shorter decay time was calculated first, and the uncertainty on the amplitude of the larger decay time was then back calculated. The SDs were obtained by calculating a 68% confidence interval from the resampled dataset generated during bootstrapping. These confidence intervals were used to generate error bars on the traces of amplitude-weighted average lifetimes during TCSPC measurements.
Monte Carlo Methods to Determine Available Xanthophyll Pools.
To estimate the fraction of the detected xanthophylls available to undergo deepoxidation, Monte Carlo methods were used to determine a constant background pool. Many samples of time series for each xanthophyll were generated from a normal distribution using the mean and SD observed from the measurements at each point in the light acclimation scheme. The minimum value of the concentration of each xanthophyll across a sample time series was selected as the value of background xanthophyll in the time series. For, for example, violaxanthin, the minimum within a single time series usually occurred after 20 min of light acclimation. The mean minimum values were subsequently determined and identified as the portion of the measured xanthophyll concentrations that did not contribute to the kinetic behavior of deepoxidation and reepoxidation observed.
Model Estimation.
Models of the kinetic behavior of the carotenoids and quenching were fit to HPLC data points and values of reversible quenching described previously. The nonlinear greybox estimation tools provided in MATLAB were used to determine best fit values of the parameters by evaluating the normalized mean square error expressed as a percentage. Sets of parameters were initialized on a grid to determine global best fits for each model. Because the algorithm requires equally spaced time points, when a missing time point was required as in the case for the carotenoid kinetic modeling, a dummy point was inserted and allowed to vary by resetting to the predicted value of the fit and repeating until the results converged. The normalized mean square error values, expressed as percentages, were greater than 80% for each mutant model fit and 68% for the fit of the wt model to data. Values for the carotenoid fit were all greater than 60% for the active xanthophyll, but because of the small number of time series data points, the fits to HPLC data are only valuable as estimates; 0% corresponds to a straight line at the mean value of the data, and 100% is a perfect fit.
Acknowledgments
This work was supported by US Department of Energy, Office of Science, Basic Energy Sciences, Chemical Sciences, Geosciences, and Biosciences Division Field Work Proposal 449B. K.K.N. is an investigator of the Howard Hughes Medical Institute and the Gordon and Betty Moore Foundation (through Grant GBMF3070).
Footnotes
The authors declare no conflict of interest.
This article contains supporting information online at www.pnas.org/lookup/suppl/doi:10.1073/pnas.1704502114/-/DCSupplemental.
References
- 1.Blankenship RE. Molecular Mechanisms of Photosynthesis. 2nd Ed Wiley-Blackwell; Malden, MA: 2014. [Google Scholar]
- 2.Külheim C, Agren J, Jansson S. Rapid regulation of light harvesting and plant fitness in the field. Science. 2002;297:91–93. doi: 10.1126/science.1072359. [DOI] [PubMed] [Google Scholar]
- 3.Kromdijk J, et al. Improving photosynthesis and crop productivity by accelerating recovery from photoprotection. Science. 2016;354:857–861. doi: 10.1126/science.aai8878. [DOI] [PubMed] [Google Scholar]
- 4.Schatz GH, Brock H, Holzwarth AR. Kinetic and energetic model for the primary processes of photosystem II. Biophys J. 1988;54:397–405. doi: 10.1016/S0006-3495(88)82973-4. [DOI] [PMC free article] [PubMed] [Google Scholar]
- 5.Niyogi KK. Photoprotection revisited: Genetic and molecular approaches. Annu Rev Plant Physiol Plant Mol Biol. 1999;50:333–359. doi: 10.1146/annurev.arplant.50.1.333. [DOI] [PubMed] [Google Scholar]
- 6.Demmig-Adams B, Adams WW., III Photoprotection and other responses of plants to high light stress. Annu Rev Plant Physiol Plant Mol Biol. 1992;43:599–626. [Google Scholar]
- 7.Ruban AV. Nonphotochemical chlorophyll fluorescence quenching: Mechanism and effectiveness in protecting plants from photodamage. Plant Physiol. 2016;170:1903–1916. doi: 10.1104/pp.15.01935. [DOI] [PMC free article] [PubMed] [Google Scholar]
- 8.Zhu X-G, Ort DR, Whitmarsh J, Long SP. The slow reversibility of photosystem II thermal energy dissipation on transfer from high to low light may cause large losses in carbon gain by crop canopies: A theoretical analysis. J Exp Bot. 2004;55:1167–1175. doi: 10.1093/jxb/erh141. [DOI] [PubMed] [Google Scholar]
- 9.Terazono Y, et al. Mimicking the role of the antenna in photosynthetic photoprotection. J Am Chem Soc. 2011;133:2916–2922. doi: 10.1021/ja107753f. [DOI] [PubMed] [Google Scholar]
- 10.Wraight CA, Crofts AR. Energy-dependent quenching of chlorophyll alpha fluorescence in isolated chloroplasts. Eur J Biochem. 1970;17:319–327. doi: 10.1111/j.1432-1033.1970.tb01169.x. [DOI] [PubMed] [Google Scholar]
- 11.Krause GH, Weis E. Chlorophyll fluorescence and photosynthesis: The Basics. Annu Rev Plant Physiol Plant Mol Biol. 1991;42:313–349. [Google Scholar]
- 12.Verhoeven A. Sustained energy dissipation in winter evergreens. New Phytol. 2014;201:57–65. [Google Scholar]
- 13.Ruban AV, Young AJ, Horton P. Induction of nonphotochemical energy dissipation and absorbance changes in leaves (evidence for changes in the state of the light-harvesting system of photosystem II in vivo) Plant Physiol. 1993;102:741–750. doi: 10.1104/pp.102.3.741. [DOI] [PMC free article] [PubMed] [Google Scholar]
- 14.Ruban AV, Horton P. An investigation of the sustained component of non-photochemical quenching of chlorophyll fluorescence in isolated chloroplasts and leaves of spinach. Plant Physiol. 1995;108:721–726. doi: 10.1104/pp.108.2.721. [DOI] [PMC free article] [PubMed] [Google Scholar]
- 15.Ware MA, Giovagnetti V, Belgio E, Ruban AV. PsbS protein modulates non-photochemical chlorophyll fluorescence quenching in membranes depleted of photosystems. J Photochem Photobiol B. 2015;152:301–307. doi: 10.1016/j.jphotobiol.2015.07.016. [DOI] [PubMed] [Google Scholar]
- 16.Brooks MD, Sylak-Glassman EJ, Fleming GR, Niyogi KK. A thioredoxin-like/β-propeller protein maintains the efficiency of light harvesting in Arabidopsis. Proc Natl Acad Sci USA. 2013;110:E2733–E2740. doi: 10.1073/pnas.1305443110. [DOI] [PMC free article] [PubMed] [Google Scholar]
- 17.Xu P, Tian L, Kloz M, Croce R. Molecular insights into Zeaxanthin-dependent quenching in higher plants. Sci Rep. 2015;5:13679. doi: 10.1038/srep13679. [DOI] [PMC free article] [PubMed] [Google Scholar]
- 18.Horton P, Ruban AV, Wentworth M. Allosteric regulation of the light-harvesting system of photosystem II. Philos Trans R Soc Lond B Biol Sci. 2000;355:1361–1370. doi: 10.1098/rstb.2000.0698. [DOI] [PMC free article] [PubMed] [Google Scholar]
- 19.Holt NE, et al. Carotenoid cation formation and the regulation of photosynthetic light harvesting. Science. 2005;307:433–436. doi: 10.1126/science.1105833. [DOI] [PubMed] [Google Scholar]
- 20.Avenson TJ, et al. Zeaxanthin radical cation formation in minor light-harvesting complexes of higher plant antenna. J Biol Chem. 2008;283:3550–3558. doi: 10.1074/jbc.M705645200. [DOI] [PubMed] [Google Scholar]
- 21.Ahn TK, et al. Architecture of a charge-transfer state regulating light harvesting in a plant antenna protein. Science. 2008;320:794–797. doi: 10.1126/science.1154800. [DOI] [PubMed] [Google Scholar]
- 22.Bode S, et al. On the regulation of photosynthesis by excitonic interactions between carotenoids and chlorophylls. Proc Natl Acad Sci USA. 2009;106:12311–12316. doi: 10.1073/pnas.0903536106. [DOI] [PMC free article] [PubMed] [Google Scholar]
- 23.Nilkens M, et al. Identification of a slowly inducible zeaxanthin- dependent component of non-photochemical quenching of chlorophyll fluorescence generated under steady-state conditions in Arabidopsis. Biochim Biophys Acta. 2010;1797:466–475. doi: 10.1016/j.bbabio.2010.01.001. [DOI] [PubMed] [Google Scholar]
- 24.Demmig-Adams B, Cohu CM, Stewart JJ, Adams WW., III . Non-Photochemical Quenching and Energy Dissipation in Plants, Algae and Cyanobacteria. Vol 40 Springer; Dordrecht, The Netherlands: 2014. [Google Scholar]
- 25.Li X-P, et al. Regulation of photosynthetic light harvesting involves intrathylakoid lumen pH sensing by the PsbS protein. J Biol Chem. 2004;279:22866–22874. doi: 10.1074/jbc.M402461200. [DOI] [PubMed] [Google Scholar]
- 26.Li X-P, et al. A pigment-binding protein essential for regulation of photosynthetic light harvesting. Nature. 2000;403:391–395. doi: 10.1038/35000131. [DOI] [PubMed] [Google Scholar]
- 27.Jahns P, Latowski D, Strzalka K. Mechanism and regulation of the violaxanthin cycle: The role of antenna proteins and membrane lipids. Biochim Biophys Acta. 2009;1787:3–14. doi: 10.1016/j.bbabio.2008.09.013. [DOI] [PubMed] [Google Scholar]
- 28.Horton P, Wentworth M, Ruban A. Control of the light harvesting function of chloroplast membranes: The LHCII-aggregation model for non-photochemical quenching. FEBS Lett. 2005;579:4201–4206. doi: 10.1016/j.febslet.2005.07.003. [DOI] [PubMed] [Google Scholar]
- 29.Johnson MP, Pérez-Bueno ML, Zia A, Horton P, Ruban AV. The zeaxanthin-independent and zeaxanthin-dependent qE components of nonphotochemical quenching involve common conformational changes within the photosystem II antenna in Arabidopsis. Plant Physiol. 2009;149:1061–1075. doi: 10.1104/pp.108.129957. [DOI] [PMC free article] [PubMed] [Google Scholar]
- 30.Rabinowitch HD, Budowski P, Kedar N. Carotenoids and epoxide cycles in mature-green tomatoes. Planta. 1975;122:91–97. doi: 10.1007/BF00385408. [DOI] [PubMed] [Google Scholar]
- 31.Bungard RA, et al. Unusual carotenoid composition and a new type of xanthophyll cycle in plants. Proc Natl Acad Sci USA. 1999;96:1135–1139. doi: 10.1073/pnas.96.3.1135. [DOI] [PMC free article] [PubMed] [Google Scholar]
- 32.García-Plazaola JI, Matsubara S, Osmond CB. The lutein epoxide cycle in higher plants: Its relationships to other xanthophyll cycles and possible functions. Funct Plant Biol. 2007;34:759–773. doi: 10.1071/FP07095. [DOI] [PubMed] [Google Scholar]
- 33.García-Plazaola JI, Hormaetxe K, Hernández A, Olano JM, Becerril JM. The lutein epoxide cycle in vegetative buds of woody plants. Funct Plant Biol. 2004;31:815–823. doi: 10.1071/FP04054. [DOI] [PubMed] [Google Scholar]
- 34.Leonelli L, Brooks MD, Niyogi KK. Engineering the lutein epoxide cycle into Arabidopsis thaliana. Proc Natl Acad Sci USA. 2017;114:E7002–E7008. doi: 10.1073/pnas.1704373114. [DOI] [PMC free article] [PubMed] [Google Scholar]
- 35.Li Z, et al. Lutein accumulation in the absence of zeaxanthin restores nonphotochemical quenching in the Arabidopsis thaliana npq1 mutant. Plant Cell. 2009;21:1798–1812. doi: 10.1105/tpc.109.066571. [DOI] [PMC free article] [PubMed] [Google Scholar]
- 36.Pogson B, McDonald KA, Truong M, Britton G, DellaPenna D. Arabidopsis carotenoid mutants demonstrate that lutein is not essential for photosynthesis in higher plants. Plant Cell. 1996;8:1627–1639. doi: 10.1105/tpc.8.9.1627. [DOI] [PMC free article] [PubMed] [Google Scholar]
- 37.Zaks J, Amarnath K, Kramer DM, Niyogi KK, Fleming GR. A kinetic model of rapidly reversible nonphotochemical quenching. Proc Natl Acad Sci USA. 2012;109:15757–15762. doi: 10.1073/pnas.1211017109. [DOI] [PMC free article] [PubMed] [Google Scholar]
- 38.Wehner A, Grasses T, Jahns P. De-epoxidation of violaxanthin in the minor antenna proteins of photosystem II, LHCB4, LHCB5, and LHCB6. J Biol Chem. 2006;281:21924–21933. doi: 10.1074/jbc.M602915200. [DOI] [PubMed] [Google Scholar]
- 39.Amarnath K, Bennett DIG, Schneider AR, Fleming GR. Multiscale model of light harvesting by photosystem II in plants. Proc Natl Acad Sci USA. 2016;113:1156–1161. doi: 10.1073/pnas.1524999113. [DOI] [PMC free article] [PubMed] [Google Scholar]
- 40.Leonelli L, Erickson E, Lyska D, Niyogi KK. Transient expression in Nicotiana benthamiana for rapid functional analysis of genes involved in non-photochemical quenching and carotenoid biosynthesis. Plant J. 2016;88:375–386. doi: 10.1111/tpj.13268. [DOI] [PMC free article] [PubMed] [Google Scholar]
- 41.Sylak-Glassman EJ, Zaks J, Amarnath K, Leuenberger M, Fleming GR. Characterizing non-photochemical quenching in leaves through fluorescence lifetime snapshots. Photosynth Res. 2016;127:69–76. doi: 10.1007/s11120-015-0104-2. [DOI] [PubMed] [Google Scholar]
- 42.Amarnath K, Zaks J, Park SD, Niyogi KK, Fleming GR. Fluorescence lifetime snapshots reveal two rapidly reversible mechanisms of photoprotection in live cells of Chlamydomonas reinhardtii. Proc Natl Acad Sci USA. 2012;109:8405–8410. doi: 10.1073/pnas.1205303109. [DOI] [PMC free article] [PubMed] [Google Scholar]
- 43.Schansker G, Toth SZ, Strasser RJ. Dark recovery of the Chl a fluorescence transient (OJIP) after light adaptation: The qT-component of non- photochemical quenching is related to an activated photosystem I acceptor side. Biochim Biophys Acta. 2006;1757:787–797. doi: 10.1016/j.bbabio.2006.04.019. [DOI] [PubMed] [Google Scholar]


