Significance
Every day, billons of cells undergo apoptosis, expose phosphatidylserine (PtdSer), and are engulfed by macrophages in a PtdSer-dependent manner. Here, we present that Tim4, a PtdSer receptor, strongly enhances Protein S- or growth arrest-specific 6-induced efferocytosis by TAM receptor-expressing phagocytes. Resident peritoneal macrophages, Kupffer cells, and CD169+ skin macrophages required Tim4 for the efficient efferocytosis, whereas thioglycollate-elicited peritoneal macrophages and cultured microglia did not. These results indicate that the efferocytosis by different macrophages may have different physiological outcomes and, therefore, would contribute to the understanding of macrophage heterogeneity.
Keywords: efferocytosis, macrophages, Tim4, apoptosis, engulfment
Abstract
Protein S (ProS) and growth arrest-specific 6 (Gas6) bind to phosphatidylserine (PtdSer) and induce efferocytosis upon binding TAM-family receptors (Tyro3, Axl, and Mer). Here, we produced mouse ProS, Gas6, and TAM-receptor extracellular region fused to IgG fragment crystallizable region in HEK293T cells. ProS and Gas6 bound Ca2+ dependently to PtdSer (Kd 20–40 nM), Mer, and Tyro3 (Kd 15–50 nM). Gas6 bound Axl strongly (Kd < 1.0 nM), but ProS did not bind Axl. Using NIH 3T3-based cell lines expressing a single TAM receptor, we showed that TAM-mediated efferocytosis was determined by the receptor-binding ability of ProS and Gas6. Tim4 is a membrane protein that strongly binds PtdSer. Tim4 alone did not support efferocytosis, but enhanced TAM-dependent efferocytosis. Resident peritoneal macrophages, Kupffer cells, and CD169+ skin macrophages required Tim4 for TAM-stimulated efferocytosis, whereas efferocytosis by thioglycollate-elicited peritoneal macrophages or primary cultured microglia was TAM dependent, but not Tim4 dependent. These results indicate that TAM and Tim4 collaborate for efficient efferocytosis in certain macrophage populations.
Apoptotic cells are quickly engulfed by macrophages, a process called efferocytosis (1), to prevent the release of noxious materials from dying cells that may cause systemic autoimmune diseases (2, 3). To be recognized by macrophages, apoptotic cells expose phosphatidylserine (PtdSer) on their surface as an “eat me” signal.
Various proteins have been proposed to specifically bind PtdSer for efferocytosis (4). Among them, Protein S (ProS) and growth arrest-specific 6 (Gas6) are secreted glycoproteins with about 40% amino acid sequence identity (5). They have a similar structure, consisting of a “Gla” domain containing 11 γ-carboxyglutamic acids, a loop region, four epidermal growth factor-like repeats, and a sex hormone-binding globulin-like structure composed of two globular laminin G-like (LG) domains. ProS and Gas6 bind to PtdSer via their Gla domain in a Ca2+-dependent manner (6). ProS is a serum protein (350 nM in human plasma) (7) and negatively regulates blood coagulation (8). Gas6 is present in the serum at a much lower level (less than 0.2 nM in human plasma) than ProS (9).
To support efferocytosis, ProS and Gas6 bind on phagocytes to a subfamily of receptor tyrosine kinases called “TAM,” from the first letter of the three members (Tyro3, Axl, and Mer) (10). Mouse (m)TAM receptors, which are all type I membrane proteins, have an overall identity of about 40% in their amino acid sequence. Their extracellular regions consist of two Ig-like domains and two fibronectin type III-like domains. ProS and Gas6 bind to TAM receptors via an interaction of their LG domain with Ig-like domains of TAM receptors (11).
In addition to TAM, phagocytes express proteins that directly bind PtdSer (2, 4). T-cell immunoglobulin and mucin domains containing protein 4 (Tim4) belongs to this category (12). We previously showed that Tim4 collaborates with the ProS–Mer system to elicit efferocytosis in mouse resident peritoneal macrophages (13). Here, we prepared recombinant mProS and mGas6 and found that the affinity of mProS and mGas6 to PtdSer was three to eight times weaker than Tim4’s affinity to PtdSer. Both mProS and mGas6 bound to mMer and mTyro3 with similar affinities (Kd of 20–50 nM), but their affinity to mAxl was extremely different. Whereas mGas6 bound mAxl tightly, the binding of mProS to mAxl was undetectable. We then prepared an NIH 3T3-derived cell line that did not express TAM and performed efferocytosis with NIH 3T3 expressing a single type of mTAM receptor. We found that efferocytosis proceeded in accordance with the affinity of ProS and Gas6 to the TAM receptors and was strongly enhanced by Tim4 expression. Finally, we found that the TAM-mediated efferocytosis by resident peritoneal macrophages, Kupffer cells, and CD169+ skin macrophages was strongly dependent on Tim4. In contrast, thioglycollate-elicited peritoneal macrophages and cultured microglia did not require Tim4 for the TAM-mediated efferocytosis, suggesting that these phagocytes have another system for enhancing the process.
Results
Preparation of TAM Receptors and Ligands.
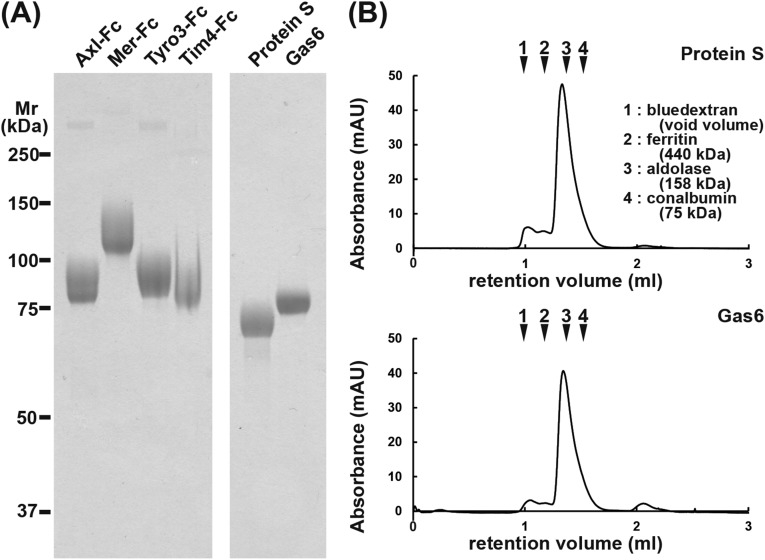
Receptors and ligands are often species specific. The reported interactions between TAM receptors and their ligands have been somewhat confusing, due to the use of proteins from different species in the analyses (5). To study the interaction between TAM receptors and their ligands, we prepared all of the reagents as recombinant mouse proteins. For mouse TAM receptors, the extracellular region was fused to human IgG1– fragment crystallizable (Fc) region, transiently expressed in HEK293T cells in serum-free medium, and purified by protein A-Sepharose in the presence of 1% Triton X-100. The purified proteins showed a single homogeneous band of 85, 120, or 90 kDa in SDS/PAGE under reducing conditions (Fig. S1A), but behaved as a dimer of 260, 300, or 250 kDa under nonreducing conditions. To produce mouse TAM ligands, HEK293T cells were stably transformed with an expression vector for Flag-tagged mProS or mGas6. Clones that secreted high levels of the recombinant protein were identified by Western blotting with anti-Flag mAb and grown in serum-free medium supplemented with vitamin K to support γ-carboxylation of the Gla domain (14). The proteins were purified by anti-Flag affinity chromatography in the presence of 1% Triton X-100, followed by HiTrapQ chromatography to remove proteins that were not γ-carboxylated. The purified mProS and mGas6 had an apparent molecular mass of 70 and 80 kDa, respectively, and were homogeneous (Fig. S1A). On gel filtration using Superdex 200, most of the protein eluted as a single peak with an apparent molecular mass of about 190 kDa (Fig. S1B), suggesting that they mainly existed as a dimer. ProS, and probably Gas6 as well, is known to be present in heterogenous multimeric forms in the serum (15) and to oligomerize upon binding PtdSer (16). The homogeneous dimeric structure of our preparations might have been due to the 1% Triton X-100 treatment to remove membranous materials.
Fig. S1.
Recombinant mTAM receptor–Fc, mProS, and mGas6. (A) Preparation of mTAM receptor–Fc proteins, mProS, and mGas6. Fusion proteins between the extracellular region of mTAM receptors (mTyro3, mAxl, and mMer) and human Ig–Fc, and Flag-tagged mProS and mGas6, were produced in 293T cells. The mTAM receptor–Fc fusion proteins were affinity purified using Protein A–Sepharose, whereas the Flag-tagged mGas6 and mProS were purified by anti-Flag M2 Affinity Gel followed by a HiTrap Q column. The purified proteins (2 μg) were subjected to 10% SDS/PAGE and stained with Coomassie Brilliant Blue. The mTim4–Fc was similarly analyzed by SDS/PAGE. Proteins for molecular mass standards were run in parallel, and their molecular masses are shown in kilodaltons. (B) Gel filtration of the recombinant mProS and mGas6. The purified mProS and mGas6 (about 10 μg protein) were analyzed by size exclusion chromatography using a Superdex 200 Increase 3.2/300 gel filtration column. As molecular mass standards, blue dextran, ferritin, aldolase, and conalbumin were similarly analyzed, and the elution positions are indicated with their molecular masses.
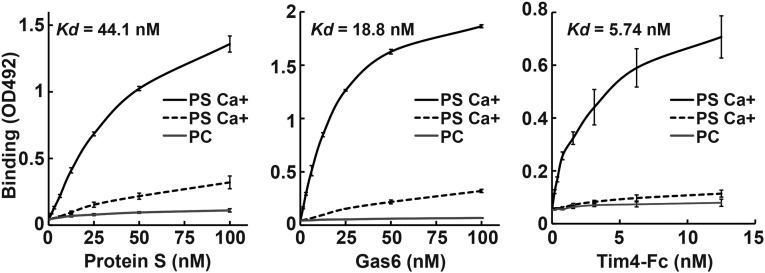
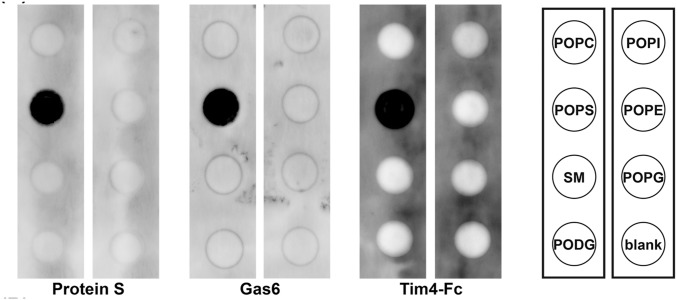
As reported for rat Gas6 (6) and bovine ProS (17), lipid overlay and solid-phase binding assays indicated that mProS and mGas6 specifically bound PtdSer in a Ca2+-dependent manner (Fig. 1 and Fig. S2), whereas they had no affinity for other phospholipids, including PtdCho, PtdEtn, and sphingomyelin. Tim4–Fc, a fusion protein of the extracellular region of mTim4 and human IgG1–Fc (12), showed a similar specificity for PtdSer, with a three to eight times stronger affinity than that of mProS or mGas6 for PtdSer (Fig. 1).
Fig. 1.
Binding of mProS and mGas6 to phosphatidylserine. Microtiter plates (96 wells) were coated with PtdCho or PtdSer and incubated with the indicated concentrations of Flag–mProS, Flag–mGas6, or mTim4–Fc. Bound proteins were quantified by ELISAs. The assay was performed in triplicate, and the average values are plotted with SD (bar). Kds were calculated from the binding curves through sigmoid fitting using Gnu R open access software (R Development Core Team).
Fig. S2.
Specific binding of mProS and mGas6 to PtdSer. Nitrocellulose filters were spotted with synthetic phospholipids [phosphatidylcholine (POPC), phosphatidylserine (POPS), sphingomyelin (SM), phosphatidyldiacylglycerol (PODG), phosphatidylinositol (POPI), or phosphatidylglycerol (POPG)], or solvent (1:1 mixture of methanol and chloroform) (blank), and incubated at 4 °C overnight with 100 nM Flag-tagged mProS, mGas6, or mTim4–Fc in 3 mL of TBS containing 1% BSA and 2 mM CaCl2. Bound proteins were detected with an HRP anti-Flag mAb or anti-human IgG Fcγ.
Interaction Between Mouse TAM Ligands and Their Receptors.
We next analyzed the interaction between TAM ligands (mProS and mGas6) and the Fc fusion proteins of TAM receptors (mTyro3–Fc, mAxl–Fc, and mMer–Fc) using surface plasmon resonance (SPR) (18) and biolayer interferometry (BLI) (Table 1). Although BLI gave 1.5- to 2-fold higher association (kon) and dissociation (koff) rate constant values for all of the combinations, the Kds obtained by both technologies were similar, or at most 1.5-times different, and indicated that mGas6 bound to mAxl very tightly, with a Kd less than 1 nM, whereas ProS had no ability to bind mAxl. On the other hand, mProS and mGas6 bound to mTyro3 and mMer with similar affinities or with at most a 3-fold difference (Kd of 15–50 nM).
Table 1.
Kinetic parameters for the interaction of ProS and Gas6 with TAM family proteins
| TAM receptor | Analysis methods | ProS | Gas6 | ||||
| kon × 104 (M−1⋅s−1) | koff × 10−4 (s−1) | Kd (nM) | kon × 104 (M−1⋅s−1) | koff × 10−4 (s−1) | Kd (nM) | ||
| Axl | SPR | N.D. | N.D. | N.D. | 37.6 ± 0.19 | 3.00 ± 0.01 | 0.80 ± 0.01 |
| Axl | BLI | N.D. | N.D. | N.D. | 77.7 ± 1.52 | 4.84 ± 0.08 | 0.62 ± 0.02 |
| Mer | SPR | 1.04 ± 0.01 | 6.00 ± 0.02 | 57.8 ± 0.58 | 5.47 ± 0.04 | 11.9 ± 0.03 | 21.7 ± 0.27 |
| Mer | BLI | 2.37 ± 0.02 | 9.39 ± 0.09 | 39.6 ± 0.81 | 11.3 ± 0.06 | 15.1 ± 0.09 | 13.4 ± 0.19 |
| Tyro3 | SPR | 6.00 ± 0.05 | 9.70 ± 0.03 | 16.2 ± 0.23 | 10.9 ± 0.17 | 25.3 ± 0.12 | 23.3 ± 0.54 |
| Tyro3 | BLI | 8.82 ± 0.12 | 22.0 ± 0.19 | 24.9 ± 0.61 | 21.3 ± 0.27 | 64.8 ± 0.32 | 30.5 ± 0.61 |
The association (kon) and dissociation (koff) rate constants for each ligand–receptor pair were determined by BLI (biolayer interferometry) and SPR (surface plasmon resonance). N.D., not detected.
Establishment of NIH 3T3 Expressing a Single TAM Receptor.
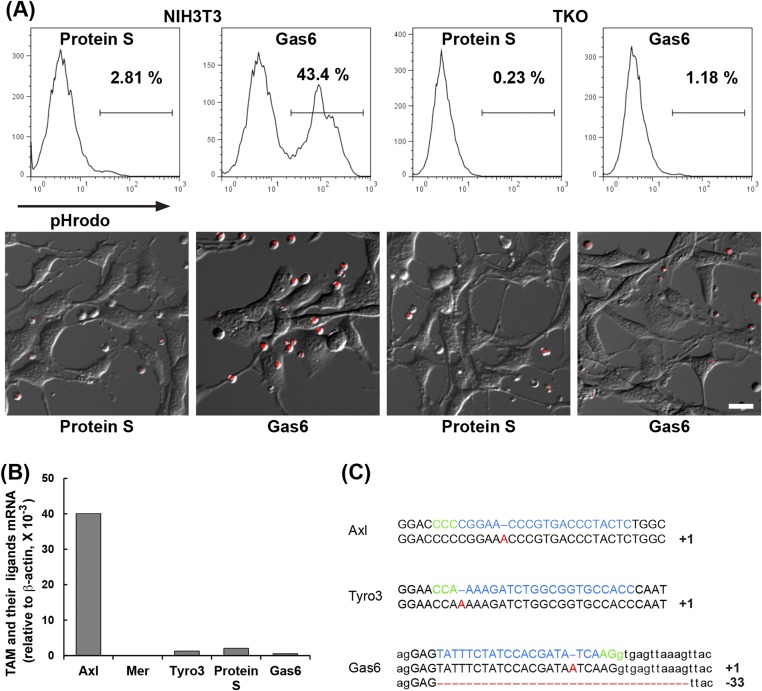
To examine the effect of TAM system on efferocytosis, we performed efferocytosis assays in a serum-free medium (Fig. S3A), because serum carries a high level of ProS. A total of 10 nM mProS did not support efferocytosis by NIH 3T3, but the same concentration of mGas6 strongly supported the process. Lew et al. (16) recently reported that various immortalized cell lines express at least one TAM receptor. Real-time RT-PCR showed that the NIH 3T3 expressed a high level of Axl, low levels of Tyro3, ProS, and Gas6, and very little Mer (Fig. S3B). We therefore knocked out Axl, Tyro3, and Gas6 genes in NIH 3T3 using the CRISPR/Cas9 system (19) (Fig. S3C). The resulting Axl−/−Tyro3−/−Gas6−/− NIH 3T3 [triple knockout (TKO)] lost the ability to engulf apoptotic cells in response to 10 nM Gas6 (Fig. S3A), indicating that the endogenous Axl was responsible for the Gas6-induced efferocytosis in NIH 3T3 cells.
Fig. S3.
Establishment of Axl−/−Tyro3−/−Gas6−/− NIH 3T3 (TKO) cells. (A) Gas6-dependent efferocytosis activity of NIH 3T3 cells. Parental NIH 3T3 or TKO cells (0.5 × 10⁵ cells) were incubated at 37 °C for 65 min with 1.0 × 10⁶ pHrodo-labeled apoptotic thymocytes in DMEM containing 5 mg/mL BSA, and 10 nM mProS or mGas6. After incubation, the cells were examined by flow cytometry (Upper), or observed by fluorescence microscopy (Lower). (Scale bar, 20 μm.) (B) Expression of TAM receptors and ligands in NIH 3T3 cells. RNA from NIH 3T3 cells was subjected to real-time RT-PCR for Tyro3, Axl, Mer, ProS, and Gas6. Each mRNA level is expressed relative to the β-actin mRNA level. (C) CRISPR/Cas9-mediated knock out of the Axl, Tyro3, and Gas6 genes in NIH 3T3 cells. The target sequences (Upper) for the Axl, Tyro3, and Gas6 genes and the sequences of the mutated alleles (Lower) in TKO cells are shown. The intron sequence in Gas6 gene is shown in small letters. The protospacer sequence is in light blue, and the protospacer-adjacent motifs (PAM) are in green. The number of added or deleted nucleotides is shown at Right. The mutation caused homozygous (Axl and Tyro3) or heterozygous truncations.
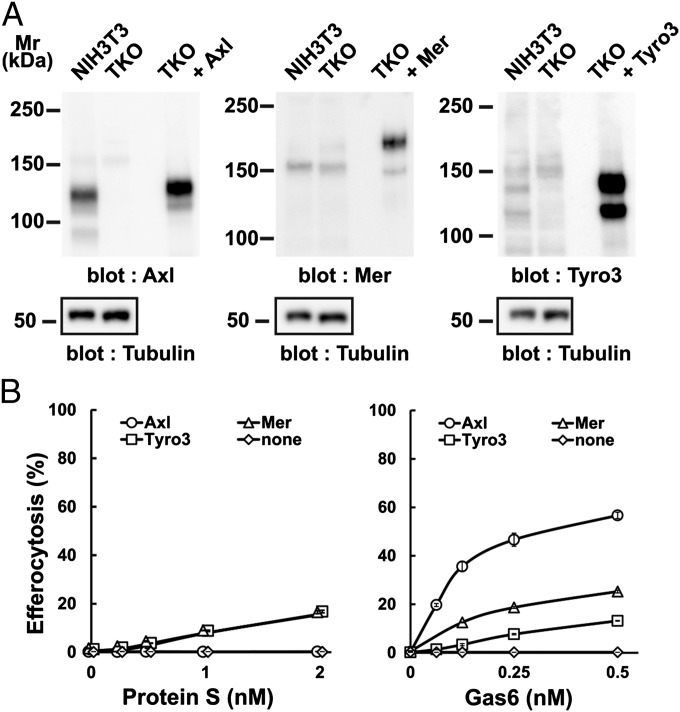
To examine the ability of each TAM receptor to support efferocytosis, the TKO cells were then singly transformed with mAxl, mMer, or mTyro3 (Fig. 2A), and their efferocytosis ability was assayed (Fig. 2B). The mAxl-expressing cells responded well to mGas6 but not at all to mProS, consistent with our finding that mGas6 but not mProS bound to mAxl (Table 1). The half-maximal concentration of mGas6 for increasing efferocytosis was about 0.1 nM, which was five times lower than the Kd for the interaction between mGas6 and mAxl–Fc (Table1), supporting the idea that TAM signaling is activated more strongly by a PtdSer-engaged TAM ligand than a free ligand (16, 20). In agreement with the weak ability of mProS and mGas6 to bind mMer and mTyro3, they moderately supported efferocytosis by mMer- or mTyro3-expressing cells.
Fig. 2.
TAM receptor-mediated engulfment of apoptotic cells. (A) Axl−/−Tyro3−/−Gas6−/− NIH 3T3 (TKO) cells were infected by lentiviruses carrying the cDNA for mAxl, mMer, or mTyro3, and stable transformants were established. NIH 3T3, TKO, and TKO transformants expressing the indicated mTAM receptor were analyzed by Western blotting with an anti-mAxl, anti-mMer, anti-mTyro3, or anti–α-tubulin Ab. (B) TKO cells and their derivatives were incubated with pHrodo-apoptotic thymocytes in DMEM containing 5 mg/mL BSA and the indicated concentration of mProS or mGas6, and analyzed by flow cytometry for pHrodo. The experiments were performed in triplicate, and the average percentage of pHrodo+ cells was plotted with SD (bar) as efferocytosis.
Effect of Tim4 on TAM-Mediated Efferocytosis.
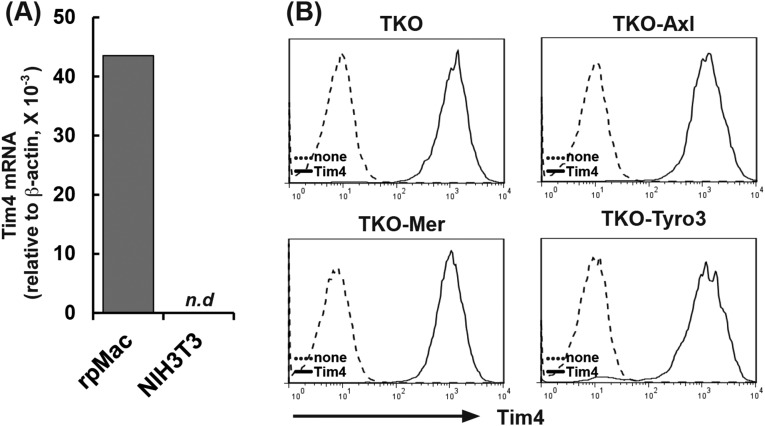
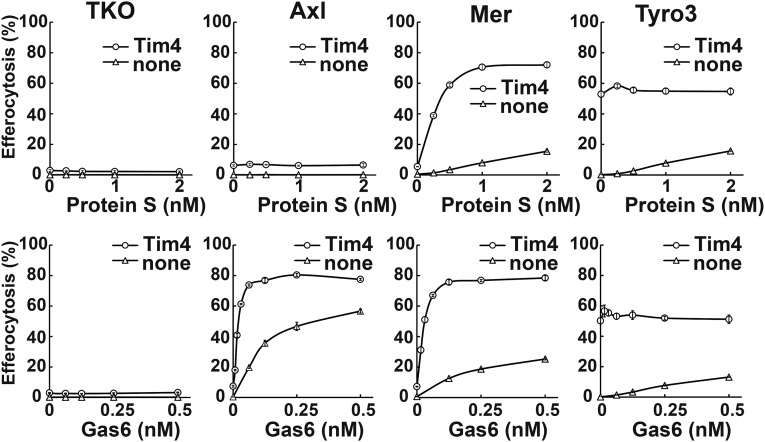
We previously reported that Tim4 strongly enhances Mer-mediated efferocytosis in a reconstituted system using Ba/F3 cells that grow in suspension (13). NIH 3T3 did not express Tim4 (Fig. S4A). Therefore, to examine the effect of Tim4 on the NIH 3T3-based efferocytosis, TKO cells and their transformants expressing mAxl, mMer, or mTyro3 were further transformed with mTim4 (Fig. S4B). As shown in Fig. 3, TKO cells expressing mTim4 did not respond to mProS or mGas6 for efferocytosis. In mAxl-expressing cells, mTim4 did not evoke mProS-supported efferocytosis, but strongly enhanced mGas6-supported efferocytosis. Specifically, the Tim4 expression reduced the concentration of mGas6 required for mAxl-mediated efferocytosis by at least 10 times. A much stronger enhancing effect of Tim4 on efferocytosis was observed with mMer-expressing cells, in which Tim4 strongly enhanced not only mGas6-, but also mProS-supported efferocytosis. In mTyro3-expressing cells transformed with mTim4, efferocytosis took place constitutively, or without TAM ligand, and mProS or mGas6 did not further stimulate it. This finding is difficult to interpret, because we could not detect the direct association between Tim4 and Tyro3 by the immunoprecipitation followed by Western blotting using antibodies against Tim4 and Tyro3. In any events, these results indicated that Tim4 alone could not support the engulfment of apoptotic cells, but strongly enhanced TAM system-mediated efferocytosis.
Fig. S4.
Establishment of TKO cells expressing mAxl, mMer, or mTyro3, together with Tim4. (A) Expression of Tim4 in NIH 3T3 cells. Tim4 mRNA level in NIH 3T3 cells was determined by real-time RT-PCR and normalized to the β-actin mRNA level. As a reference, the Tim4 mRNA level in resident peritoneal macrophages (rpMac) was similarly determined. N.d., not detected. (B) Transformation of TKO cells with mTim4. TKO cells and their transformants expressing mAxl, mMer, or mTyro3 were infected by a retrovirus carrying mTim4 cDNA. The mTim4 expression in the stable transformants (TKO-mTim4, TKO-mAxl/mTim4, TKO-mMer/mTim4, and TKO-mTyro3/mTim4) (solid line) and in their parental cells (dotted line) was analyzed by flow cytometry using an anti-mTim4 mAb (Kat5-18).
Fig. 3.
Enhancement of TAM-mediated efferocytosis by Tim4. TKO, TKO-mAxl, TKO-mMer, and TKO-mTyro3, and their transformants expressing mTim4 were incubated with pHrodo-apoptotic thymocytes in DMEM containing 5 mg/mL BSA and the indicated concentrations of mProS or mGas6, and analyzed by flow cytometry. Experiments were performed in triplicate, and the average percentage of pHrodo+ cells was plotted with SD (bar) as efferocytosis.
Different Requirements of Tim4 for Efferocytosis by Mouse Tissue Macrophages.
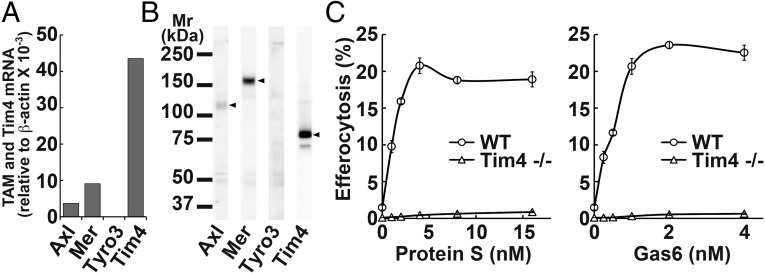
We previously reported that Mertk−/− or Tim4−/− mouse resident peritoneal macrophages cannot engulf apoptotic cells (13). Here we found by real-time RT-PCR that resident peritoneal macrophages expressed not only Mer, but also Axl mRNA (Fig. 4A). Western blotting detected a high level of Mer, but little Axl and no Tyro3 protein (Fig. 4B). The Axl’s, but not Mer’s extracellular region is known to be cleaved off (21), suggesting that resident peritoneal macrophages express both Axl and Mer. Efferocytosis using resident peritoneal macrophages in the presence of increasing concentrations of TAM ligands showed that mGas6 and mProS stimulated the efferocytosis with a dose–response similar to that obtained with TKO cells expressing Mer and Tim4 (Fig. 4C). In agreement with a previous report (13), the resident peritoneal macrophages expressed Tim4 mRNA and protein (Fig. 4 A and B), and the efferocytosis by these macrophages was completely Tim4 dependent (Fig. 4C).
Fig. 4.
Tim4 and TAM ligand-dependent efferocytosis by resident peritoneal macrophages. (A) RNA from resident peritoneal macrophages was analyzed by real-time RT-PCR for mAxl, mMer, mTyro3, and mTim4. The mRNA level is expressed relative to β-actin mRNA level. (B) Cell lysates were analyzed by Western blotting with an anti-mAxl, anti-mMer, anti-mTyro3, or anti-mTim4. (C) Tim4 dependency of TAM-mediated efferocytosis. Resident peritoneal macrophages from wild-type or Tim4−/− mice were coincubated with pHrodo-apoptotic thymocytes in DMEM containing 5 mg/mL BSA and the indicated concentrations of mProS or mGas6. After incubation, cells were detached, stained with APC-anti-CD11b, and analyzed by flow cytometry for pHrodo. The experiments were performed in triplicate, and the average percentage of CD11b+ cells that were pHrodo+ was plotted with SD (bar) as efferocytosis.
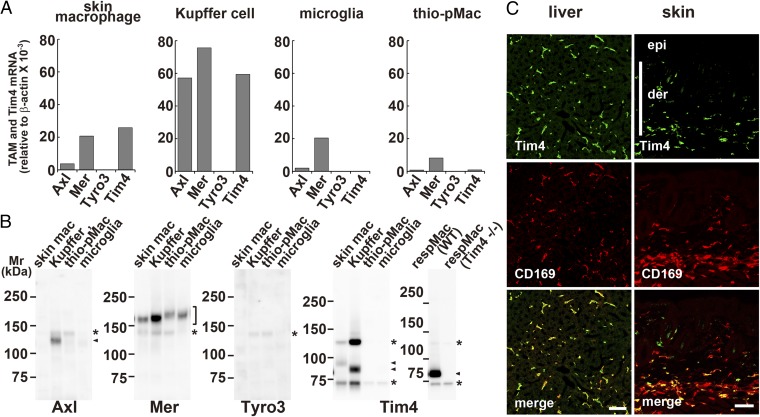
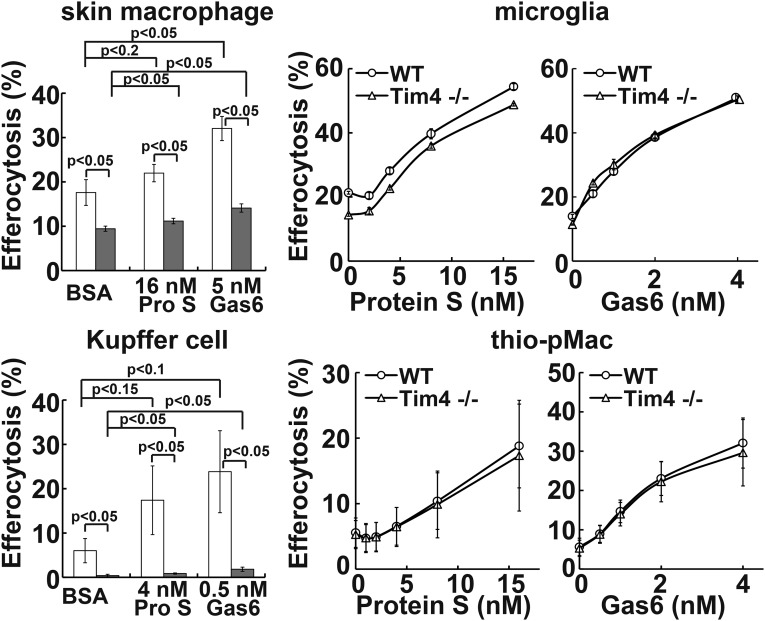
To examine whether other phagocytes require the Tim4 and TAM system for efferocytosis, CD169+ skin macrophages, Kupffer cells, primary cultured microglia, and thioglycollate-elicited peritoneal macrophages were prepared. These phagocytes expressed Mer mRNA and protein, although at significantly different levels among them (Fig. 5). That is, Mer mRNA (and protein) was 10–20 times more abundant in Kupffer cells than in thioglycollate-elicited peritoneal macrophages. Kupffer cells expressed high levels of Axl mRNA and protein. The other phagocytes expressed a low level of Axl mRNA, and Tyro3 mRNA could not be detected in any of the phagocytes examined (Fig. 5A). The Tim4 mRNA and protein were detected in CD169+ skin macrophages and Kupffer cells, but not in the cultured microglia and thioglycollate-elicited peritoneal macrophages (Fig. 5). Accordingly, the ProS- or Gas6-promoted efferocytosis by skin macrophages and Kupffer cells was reduced if Tim4 was absent (Fig. 6). In particular, Kupffer cells fully required Tim4 for efferocytosis and responded well to a low concentration of mProS or mGas6 for efferocytosis. The requirement of Kupffer cells’ efferocytosis for Tim4 seems to be higher than that observed with TKO expressing Axl or Mer, which may indicate that Axl or Mer at the endogenous level almost absolutely require Tim4. On the other hand, although mProS and mGas6 efficiently stimulated microglia and thioglycollate-elicited peritoneal macrophages to engulf apoptotic cells, the lack of Tim4 had no effect on the mProS- or mGas6-stimulated efferocytosis.
Fig. 5.
Different expression of TAM receptors and Tim4 by tissue macrophages. (A) RNA from mouse skin macrophages (skin mac), Kupffer cells (Kupffer), microglia from glial culture, and thioglycollate-elicited peritoneal macrophages (thio-pMac), was subjected to real-time RT-PCR for Axl, Mer, Tyro3, and Tim4. Each mRNA level is expressed relative to β-actin mRNA level. (B) Cell lysates from the indicated macrophages were analyzed by Western blotting with antibodies against mAxl, mMer, mTyro3, or mTim4. Arrowheads and asterisks indicate specific and nonspecific bands, respectively. (C) Cryosections of liver and skin were stained with antibodies against Tim4 (green) and CD169 (red). (Lower) Merged images. der, dermis; epi, epidermis. (Scale bar, 50 μm.)
Fig. 6.
Different requirement of Tim4 for efferocytosis by tissue macrophages. The indicated tissue macrophages from wild-type (open column) or Tim4−/− (closed column) mice were seeded into 24-well plates, and the adherent cells were coincubated with pHrodo-apoptotic thymocytes at 37 °C for 1 h (thioglycollate elicited peritoneal macrophages, thio-pMac) or 2 h (others) in DMEM containing 5 mg/mL BSA and the indicated concentrations of mProS or mGas6. Cells were detached and stained with PE/Cy7-anti-CD11b and AlexaFluor647-anti-CD169 (skin macrophages), APC-anti-F4/80 (Kupffer cells), or APC-anti-CD11b (thio-pMac). The percentage of CD11b+CD169+ cells (skin macrophages), F4/80high and autofluorescence-positive cells (Kupffer cells), or CD11b+ cells (thioglycollate elicited peritoneal macrophages) that was pHrodo+ was determined by flow cytometry. For microglia, the percentage of pHrodo+ cells was determined for the total cell population. Experiments were performed in triplicate for skin macrophages and primary microglia or independently three times for Kupffer cells and thioglycollate-elicited peritoneal macrophages, and the average value was plotted with SD (bar) as efferocytosis. P values are shown.
Discussion
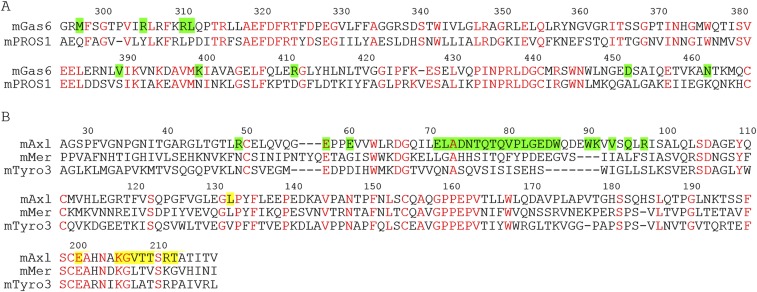
In this report, we showed that mGas6 has a high affinity for mAxl, whereas mProS has almost no affinity for mAxl, and that they both bind to mMer and mTyro3 with a similar affinity. The X-ray structure analysis of the complex of LG domain of Gas6 and Ig domain of Axl (11) and a bioinformatics study (22) indicated that nine functional residues in Gas6 (Met-297, Arg-305, Arg-310, Leu-311, Val-389, Lys-399, Arg-411, Asp-452, and Asn-462 in mGas6 numbering) are at the interface with Axl. An alignment of the amino acid sequence of mGas6 with that of mProS shows that none of these nine amino acids is conserved in mProS (Fig. S5A), which may explain why mProS is unable to bind mAxl. The major interaction site of Axl with Gas6 is the region of amino acid positions 70–100 (11) (Fig. S5B). This region of mAxl has no similarity with mMer or mTyro3, which agrees with the reduced affinity of mGas6 to mMer or mTyro3.
Fig. S5.
The Gas6–Axl interaction is not conserved in other TAM ligand–receptor pairs. (A) Alignment of the amino acid sequences of mouse Gas6 and ProS. The amino acid sequence of the LG domain of mGas6 (amino acids 295–467) was aligned with that of mProS (amino acids 303–475). The residues conserved between mGas6 and mProS are in red. The residues of mGas6 that interact with mAxl, determined by the X-ray structure of the human Axl–Gas6 complex (14), are highlighted in green. (B) Alignment of the amino acid sequences of mouse TAM receptors. The amino acid sequences of the Ig domains of mAxl (amino acids 27–217), mMer (amino acids 86–275), and mTyro3 (amino acids 31–211) were aligned. The amino acid residues conserved among the three members are in red. The residues in Axl for the major and minor interaction with Gas6 (14) are highlighted in green and yellow, respectively.
Many groups including ours have used established cell lines to reconstitute efferocytosis (12, 23–25). This practice led to the identification of many different molecules (MFG-E8, Tim-4, Tim-1, BAI1, CD300a, Stabillin-1, and Stabillin-2) as being able to bind PtdSer exposed on apoptotic cells and enhance efferocytosis (4). On the other hand, we also noticed that the reconstitution of efferocytosis strongly depends on the host cells. For example, the expression of Tim4 alone fully supports efferocytosis in NIH 3T3 (12), but it does not confer efferocytosis ability on Ba/F3 or resident peritoneal macrophages (13). Here, we found that when Tim4 was expressed alone in TKO cells, mProS or mGas6 failed to stimulate efferocytosis. However, this ability was restored by expressing one of the TAM receptors, indicating that Tim4 requires a TAM receptor to stimulate efferocytosis. It will be important to determine whether the other molecules proposed as PtdSer receptors (4) act by themselves or require TAM receptors for efferocytosis.
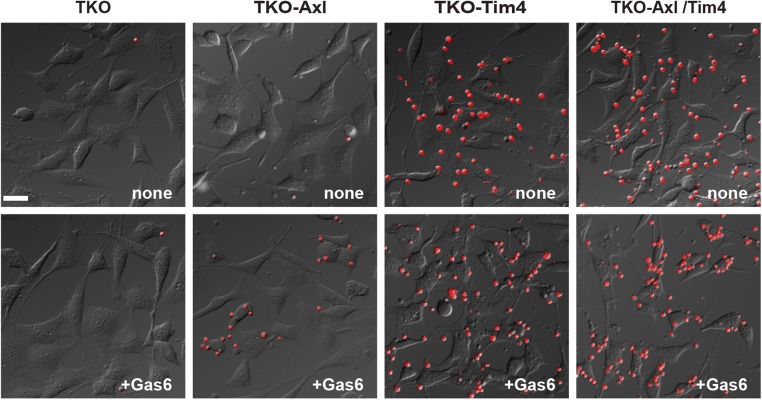
We previously showed that the expression of Tim4 or Mer alone in Ba/F3 or resident peritoneal macrophages does not support efferocytosis, but that efferocytosis can occur when both Tim4 and Mer are expressed (13). However, Ba/F3 expressing Tim4 alone but not Mer alone efficiently recruited apoptotic cells, leading us to conclude that Tim4 acts at the tethering step, whereas Mer functions at the tickling or internalization step. A similar result was obtained here with mProS-stimulated efferocytosis. That is, mMer- or mTyro3-expressing TKO cells weakly responded to mProS for efferocytosis, and this response was strongly enhanced by coexpressing Tim4, supporting the idea that the Tim4 and Mer systems collaborate for efficient efferocytosis. The mGas6-stimulated efferocytosis, in particular with Axl-expressing TKO cells, was observed without Tim4, suggesting that the higher affinity of Gas6 to PtdSer and to Axl may obviate the need for the tethering step. However, even under these conditions, the expression of Tim4 strongly enhanced the efferocytosis. The number of apoptotic cells attached to Tim4-expressing cells far exceeded that observed with Tim4-nonexpressing cells in the presence or absence of Gas6 (Fig. S6), supporting the idea that Tim4 enhances efferocytosis by functioning at the tethering step.
Fig. S6.
Tim4-mediated attachment of apoptotic cells to phagocytes. TKO cells and TKO cells expressing Axl, Tim4, or both were incubated with cell-tracker–labeled apoptotic thymocytes at 37 °C for 10 min in the presence or absence of mGas6 and observed by fluorescence microscopy. (Scale bar, 30 μm.)
We found here that Kupffer cells, resident peritoneal macrophages, and CD169+ skin macrophages express and require Tim4 for efferocytosis. Kupffer cells are a major cell population in the liver (about 15%) (26), where they clear aged red blood cells and engulf infected or damaged hepatocytes to accelerate liver resolution (27, 28). Resident peritoneal macrophages invade the liver to repair damaged tissues (29), indicating that resident peritoneal macrophages perform a similar function as Kupffer cells. One of the functions of skin CD169+ macrophages is to resolve inflammation by clearing recruited immune cells (30, 31). Aged erythrocytes, damaged hepatocytes, and recruited dying immune cells all expose PtdSer to be recognized by macrophages (32), indicating that the collaborative function of Tim4 and TAM receptors in these macrophages plays an important role in clearing the damaged cells.
The thioglycollate-elicited peritoneal macrophages required a TAM receptor to elicit efferocytosis, in agreement with a previous report by Scott et al. (33). However, unlike resident peritoneal macrophages, they did not require Tim4 for efferocytosis. We and others showed that peritonitis-induced inflammatory macrophages require MFG-E8, which acts as a bridge between PtdSer-exposing apoptotic cells and integrin-αvβ3-expressing macrophages (25, 34, 35). Unlike the resident peritoneal macrophages, which have a tolerogenic role (36), the apoptotic cells engulfed by inflammatory macrophages provide antigens to stimulate the immune system (37). It is possible that the different requirement of Tim4 or MFG-E8 for efferocytosis explains the different properties of resident versus inflammatory macrophages. The microglia in brain appear to express Tim4, although very weakly or in only a limited population (38, 39). However, the cultured microglia did not express Tim4, but efficiently engulfed apoptotic cells using the TAM system. Because bone-marrow-derived macrophages express Mer, and can engulf apoptotic cells without Tim4, Dransfield et al. (40) proposed that Mer functions at both the tethering and tickling steps of efferocytosis. Although this possibility cannot be ruled out, we prefer a model in which other molecules collaborate with TAM receptors for efficient efferocytosis in the cultured microglia. In this study, the Tim4 expression appeared to be restricted to tissue-resident macrophages. However, tissue-resident macrophages are heterogeneous (41). Whether resident macrophages in other tissues, such as lung, spleen, and intestines, express and require Tim4 for efficient efferocytosis remains to be studied. Pathogens, in particular the enveloped virus, expose PtdSer (42) and are known to efficiently bind to Tim4-expressing cells (43). It will be interesting to study whether Tim4-expressing resident macrophages, such as peritoneal macrophages and Kupffer cells, are targets of these PtdSer-exposing pathogens.
Materials and Methods
Recombinant Proteins.
For the TAM–Fc fusion proteins, DNA fragments coding for chimeric molecules between the extracellular region of TAM and the human IgG1 Fc constant region were prepared by recombinant PCR, inserted into pEF-BOS-EX, and introduced into HEK293T cells. Triton X-100 was added to the conditioned medium to a final concentration of 1%, and the Fc fusion proteins were purified by Protein A–Sepharose. To produce mProS and mGas6, stable 293T cell transformants highly expressing the Flag-tagged mProS or mGas6 were established and cultured in the presence of 10 μg/mL vitamin K1. The conditioned media were treated with 1% Triton X-100, and the recombinant proteins were purified by anti-Flag mAb-agarose.
SPR and BLI.
SPR analyses were performed using a ProteOn XPR36 Protein Interaction Array System (Bio-Rad), whereas BLI analyses were performed using an Octet RED96 System (ForteBio).
Isolation of Tissue Macrophages.
Resident and thioglycollate-elicited peritoneal macrophages were isolated as described (13, 34). Primary microglia, Kupffer cells, and CD169+ skin macrophages were prepared essentially as described (44–47) with some modifications. All mouse studies were approved by the Animal Care and Use Committee of the Research Institute for Microbial Diseases, Osaka University. Full details for Materials and Methods are given in SI Materials and Methods.
SI Materials and Methods
Mice, Cell Lines, Antibodies, and Reagents.
Tim4−/− mice were described previously (48). C57BL/6J mice were purchased from Japan CLEA, Charles River Japan, or Japan SLC. Human HEK293T cells, Plat-E cells, and mouse NIH 3T3 cells were cultured in DMEM containing 10% FBS.
Hamster anti-mTim4 mAbs (clones Mat4-9-5 and Kat5-18) were described previously (12, 48). Rat anti-mAxl mAb, goat anti-mAxl Ab, nonconjugated or biotin-conjugated goat anti-mMer Ab, goat anti-mTyro3 Ab, and goat anti-mTim4 were from R&D Systems. Alexa Fluor647-conjugated donkey anti-rat IgG, APC-conjugated goat anti-Armenian hamster IgG and HRP-goat anti-human IgG Fcγ Ab were from Jackson ImmunoResearch. Alexa Fluor488-donkey anti-rat IgG and anti-goat IgG were from Thermo Fisher Scientific. APC- or PE/Cy7-conjugated rat anti-CD11b mAb (clone M1/70), PE/Cy7-rat anti-F4/80 mAb (clone BM8), and Alexa Fluor 647-rat anti-CD169 mAb (clone 3D6.112) were from BioLegend, and APC-streptavidin was from BD PharMingen. HRP-rabbit or goat anti-mouse Igs, and HRP-streptavidin were from Dako. Mouse anti–α-tubulin mAb (clone AB-1) was from Oncogene Science. HRP-rabbit anti-β-actin was from MBL. HRP-anti-Flag mAb (clone M2) and anti-Flag affinity gel were from Sigma-Aldrich. Protein A–Sepharose was from GE Healthcare.
Synthetic phospholipids 1-palmitoyl-2-oleoyl-sn-glycero-3-phosphocholine (POPC), 1-palmitoyl-2-oleoyl-sn-glycero-3-phosphoinositol (POPI), 1-palmitoyl-2-oleoyl-sn-glycero-3-phospho-l-serine (POPS), 1-palmitoyl-2-oleoyl-sn-glycero-3-phosphoethanolamine (POPE), N-stearoyl-d-erythro-sphingosylphosphorylcholine (SM), 1-palmitoyl-2-oleoyl-sn-glycero-3-phospho-(1′-rac-glycerol) (POPG), 1-palmitoyl-2-oleoyl-sn-glycerol (PODG), and chicken egg phosphatidylcholine (PtdCho) were purchased from Avanti Polar Lipids. Bovine brain phosphatidylserine (PtdSer) was from Sigma-Aldrich.
Recombinant Proteins.
Recombinant human Fas ligand (FasL) was produced in COS7 cells as described (13). For the TAM–Fc fusion proteins, cDNAs for mAxl (Gene ID: 26362), mMer (Gene ID: 17289), and mTyro 3 (Gene ID: 22174) were prepared by RT-PCR with mRNA from mouse liver, kidney, and brain, respectively. DNA fragments coding for chimeric molecules between the extracellular region of TAM (mAxl, amino acids 1–443; mMer, amino acids 1–498; mTyro3, amino acids 1–418) and the human IgG1 Fc constant region (GenBank: AEV43323.1) were prepared by recombinant PCR and inserted into pEF-BOS-EX. Plasmid DNA was introduced into HEK293T cells by polyethylenimine (PEI)-mediated transfection as described (49). In brief, 350 μg of DNA was mixed with 1,750 μg of polyethyleneimine “Max” (MW 40,000; Polyscience) in 50 mL of Opti-MEM (Thermo Fischer Scientific), incubated for 30 min at room temperature, and then added to 1 × 10⁸ HEK293T cells in 500 mL of DMEM containing 10% FBS. Twelve hours later, the cells were washed with PBS and cultured in Opti-MEM. The culture supernatant was collected 2 and 4 d later, and Triton X-100 was added to the conditioned medium to a final concentration of 1%. After removing insoluble materials by centrifugation, the Fc fusion proteins were bound to Protein A–Sepharose, eluted with 5 M LiCl, and dialyzed against PBS. Mouse Tim4–Fc was prepared as described (12).
To produce mProS and mGas6, full-length cDNAs for mProS (Gene ID: 19128) and mGas6 (Gene ID: 14456) were prepared by RT-PCR with mRNA from mouse liver and kidney, respectively. A DNA fragment coding for a Flag peptide was joined to the 3′-terminus, and the construct was inserted into pPEF-BOS-EX, a derivative of pEF-BOS-EX carrying the puromycin-resistance gene. The expression vector was introduced into HEK293T cells by PEI-mediated transfection as described above, and stable transformants were established by culturing in 1.0–8.0 μg/mL puromycin. The cells were subjected to limiting dilution, and the clone producing the highest level of the recombinant protein was selected. For large-scale protein production, cells were cultured in Opti-MEM supplemented with 10 μg/mL vitamin K1 (phytonadione, Koa-Isei), and the conditioned media were harvested 2 and 4 d later. After adding Triton X-100 to a final concentration of 1% to the conditioned medium, the recombinant proteins were bound to anti-Flag mAb-agarose, eluted with 5 M LiCl, dialyzed against 20 mM Tris⋅HCl buffer (pH 8.0), and further purified using a HiTrapQ column (GE Healthcare) with a linear NaCl gradient. The protein concentration was determined from the absorbance at 280 nm using molar absorption coefficients calculated according to the following equation: Molar extinction coefficient at 280 nm = number of tryptophan residues × 5,500 + number of tyrosine residues × 1,490 + number of cystine residues × 125 (50).
Surface Plasmon Resonance and Biolayer Interferometry.
Surface plasmon resonance (SPR) analyses were performed using a ProteOn XPR36 Protein Interaction Array System (Bio-Rad) according to the manufacturer’s instructions. In brief, GLC sensor chips (Bio-Rad) were activated with 20 mM EDAC [1-ethyl-3-(3-dimethylaminopropyl)carbodiimide hydrochloride] and 5 mM sulfo-NHS (N-hydroxysulfosuccinimide), and then mTAM–Fc fusion protein in 10 mM sodium acetate buffer (pH 4.5) was immobilized on the activated chips. After deactivating uncoupled carboxyl groups with 1 M ethanolamine, mProS or mGas6 in 50 mM Tris⋅HCl buffer (pH 7.4) containing 150 mM NaCl, 2 mM CaCl2, and 0.005% Tween 20, was injected onto the sensor chips, and monitored at 25 °C. Using the ProteOn Manager software (Bio-Rad), the sensorgrams were fitted to a Langmuir 1:1 reaction model, and kinetic constants were calculated.
Biolayer interferometry (BLI) analyses were performed using an Octet RED96 System (ForteBio) according to the manufacturer’s instructions. In brief, Protein A-biosensor tips were loaded with 40 μg/mL mTAM–Fc fusion protein. The tips were successively incubated at 30 °C for 3 min each with various concentrations of mProS or mGas6 in binding buffer [50 mM Tris⋅HCl buffer (pH 7.4), 150 mM NaCl, 2 mM CaCl2, 1 mg/mL BSA, and 0.002% Tween 20], followed by incubation with binding buffer at 30 °C for 4 min. The sensorgrams were fitted to a 1:1 binding model or mass transport model using Data Analysis software (ForteBio), and kinetic constants were calculated.
Protein Lipid Overlay Assay and Solid Phase ELISA.
For the protein lipid overlay assay, 5 μL of 20 ng/μL phospholipid (POPC, POPI, POPS, POPE, SM, POPG, or PODG) in methanol:chloroform (1:1) was spotted onto supported nitrocellulose membranes (Bio-Rad), and air dried. Membranes were treated at room temperature for 1 h with 1% BSA in Tris-buffered saline (TBS, 50 mM Tris⋅HCl, pH 7.4, 150 mM NaCl) containing 2 mM CaCl2, and incubated overnight at 4 °C with 100 nM Flag–mProS, Flag–mGas6, or mTim4–Fc in TBS containing 2 mM CaCl2. After washing five times with TBST (TBS with 0.05% Tween 20) containing 2 mM CaCl2, the bound proteins were detected with an HRP–anti-Flag mAb or HRP–anti-human IgG–Fcγ, followed by a chemiluminescence reaction with ECL Prime (GE Healthcare). To determine the phospholipid-binding activity of mProS, mGas6, and mTim4–Fc, 10 ng of PtdCho from chicken egg or PtdSer from bovine brain in 50 μL methanol was added to each well of a 96-well Nunc Immunoplate Polysorp (Thermo Fisher Scientific), and air dried. The wells were treated with 2% BSA in TBS containing 2 mM CaCl2 or EGTA, and incubated with Flag–mProS or Flag–mGas6 at 37 °C for 3 h, or with mTim4–Fc at room temperature for 1 h. The wells were washed with TBST containing 2 mM CaCl2 or EGTA, and incubated with HRP–anti-Flag M2 mAb or HRP–anti-human IgG, Fcγ. The peroxidase activity was then measured using a peroxidase assay kit (Sumilon), by following the color reaction at 492 nm with a microplate reader.
Genome Editing.
The CRISPR/Cas9 system (19) was used to edit the Axl, Tyro3, and Gas6 genes in NIH 3T3 cells. In brief, the targeting sequences were selected using the CRISPR Design Tool (crispr.mit.edu/), and the following oligonucleotides containing the targeting sequence were prepared: 5′-CACCGGAGTAGGGTCACGGGTTCCG-3′ and 5′-AAACCGGAACCCGTGACCCTACTCC-3′ for Axl, 5′-CACCGGGTGGCACCGCCAGATCTTT-3′ and 5′-AAACAAAGATCTGGCGGTGCCACCC-3′ for Tyro3, and 5′-CACCGTATTTCTATCCACGATATCA-3′ and 5′-AAACTGATATCGTGGATAGAAATAC-3′ for Gas6. The oligonucleotides were annealed and ligated into BbsI-cleaved pX330 (Addgene). NIH 3T3 cells were transfected with the Axl-, Tyro3-, and Gas6-targeting vectors using PEI as described above and cultured for 1 wk. The cells that lacked Axl and Tyro3 expression were sorted by FACSAria II using a rat anti-mAxl mAb and goat anti-mTyro3 Ab together with an Alexa Fluor488-donkey Ab against rat IgG or goat IgG, and subjected to limiting dilution. The null mutation of the Axl, Tyro3, and Gas6 genes was confirmed by sequencing the genomic DNA.
Transformation.
NIH 3T3 and its derivatives were stably transformed by TAM receptors using lentiviral vectors (CSII-EF, pCAG-HIVgp, pENV-IRES-puro, and pRSV-Rev) provided by H. Miyoshi, RIKEN BioResource Center. In brief, DNA fragments coding for mTAM were inserted into the CSII-EF vector and transfected into HEK293T cells together with pCAG-HIVgp, pENV-IRES-puro, and pRSV-Rev. After culturing for 2 d, viruses in the supernatant were recovered by centrifugation at 6,000 × g for 16 h at 4 °C and used to spin-infect Axl−/−Tyro3−/−Gas6−/− (TKO) NIH 3T3 cells. Cells expressing Axl, Mer, or Tyro3 were sorted by FACSAria II using a rat anti-mAxl mAb, biotin-goat anti-mMer Ab, or goat anti-mTyro3 Ab, followed by staining with Alexa Fluor488-donkey anti-rat IgG, APC-streptavidin, or Alexa Fluor488-donkey anti-goat IgG, respectively. To express mTim4, pMXs–mTim4 (12) was introduced into Plat-E cells, and the culture supernatant was used to infect TKO NIH 3T3 cells and their transformants expressing each mTAM. Stable transformants were selected by culturing in the presence of 2 μg/mL puromycin and confirmed by flow cytometry using hamster anti-mTim4 (clone, Kat5-18) and APC-labeled goat anti-Armenian hamster IgG as described (12).
Real-Time RT-PCR.
RNA was prepared from NIH 3T3 cells and tissue macrophages using an RNeasy Micro or Mini Kit (Qiagen) with RNase-Free DNase Set (Qiagen), and reverse transcribed with a high capacity RNA-to-cDNA kit (Thermo Fisher Scientific). Real-time RT-PCR was carried out with the Thunderbird SYBR qPCR Mix (Toyobo Life Science), and analyzed using the LightCycler 480 system (Roche Diagnostics). The primers used were: 5′-GCACAGTCTGCAAACTCCAG and 5′-AACCACGTGGAGATGGTGA for mAxl, 5′-GTTCTGGCCCCACTGCTAC and 5′-AAGGCCCTGAAAATAGCTGA for mMer, 5′-TACAACTACCTCATCGGCGG and 5′-GCCCAGAATGTTCTCCAGTT for mTyro3, 5′-CAATGCACTCTCGTTCAAGG and 5′-CCTGGTGATCCCTGTCTCAG for mProS, 5′-AAAGAGGAGGCCAGAGAGGT and 5′-GTTCTGAACATTTGGCGA for mGas6, 5′-GAATCATCTCCAGGAAGTCAAC and 5′-GTTGTTGTGGCTCTCCTCAG for mTim4, and 5′-CTGAACCCTAAGGCCAACCGT and 5′-TACGTACATGGCTGGGGTGT for mouse β-actin.
Western Blotting.
Cells were directly lysed with sample buffer (2.0% SDS, 62.5 mM Tris⋅HCl, pH 6.8, 10% glycerol, 2% β-mercaptoethanol, and 0.004% BPB), and the insoluble materials were removed by centrifugation. Supernatant containing 1 μg of protein was heated at 95 °C for 5 min before electrophoresis. To detect mTim4, cells were lysed with lysis buffer [50 mM Tris⋅HCl, pH 8.0, 150 mM NaCl, 1% Nonidet P-40, and a protease inhibitor mixture (cOmplete Mini EDTA-free, Roche Diagnostics)], and the insoluble material was removed by centrifugation. Supernatant containing 1 μg of protein was mixed with 2× sample buffer without reducing agent and heated at 95 °C for 5 min. The proteins were separated by 5–10% SDS/PAGE and then transferred to a PVDF membrane (Merck Millipore). Western blotting was carried out with a biotin-conjugated hamster anti-mTim4 mAb (clone Mat4-9-5); goat antibodies against mAxl, mMer, or Tyro3; and a mouse anti–α-tubulin mAb (clone AB-1) in Can Get Signal solution 1 (Toyobo Life Science). Proteins recognized by the primary Ab were reacted with HRP-rabbit anti-goat Igs, HRP-goat anti-mouse Igs, or HRP-streptavidin in Can Get Signal solution 2 and visualized using ECL Prime. For β-actin, an HRP-rabbit anti–β-actin Ab was used in Can Get Signal solution 2 and detected with ECL Prime.
Isolation of Tissue Macrophages.
Resident and thioglycollate-elicited peritoneal macrophages were isolated from mice at 9–12 wk of age as described (13, 34). Primary microglia were prepared from mixed glial cultures essentially as described (44). In brief, after removing meninges, the forebrains of postnatal 1- to 3-d-old mice were dispersed by gently pipetting in Hanks’ balanced salt solution and passed through a cell strainer to obtain a single-cell suspension. Cells were collected by centrifugation, suspended in DMEM/F12 containing 10% FBS, seeded in T75 tissue culture flasks, and cultured at 37 °C for 15 d, changing the medium every 4 d. The flasks were shaken at 180 rpm for 1 h. Cells detached from the astroglial layer were seeded on 10-cm plastic dishes, and incubated at 37 °C for 1 h. After removing nonadherent cells, the adherent cells were used as microglia.
Kupffer cells and CD169+ skin macrophages were prepared according to Hong et al. (45) and Thornley et al. (46), respectively, with some modifications. In brief, livers of 9- to 12-wk-old mice were perfused with 10 mL DMEM containing 10% FBS, 2 μg/mL Collagenase D (Roche Diagnostics), and 100 μg/mL DNase I (Worthington) (digestion buffer). The livers were removed from the mice and processed using a GentleMACS dissociator (Miltenyi Biotech) according to the manufacturer’s instructions. The homogenates were digested at 37 °C for 20 min in 5 mL of digestion buffer and passed through a 70-μm cell strainer (BD Biosciences) to obtain a single-cell suspension. Cells were collected by centrifugation at 300 × g for 5 min and suspended in DMEM containing10% FBS. Hepatocytes were removed by repeated centrifugations four times at 50 × g for 2 min. Cells in the supernatant were collected by centrifugation at 300 × g for 10 min and centrifuged at 1,500 × g for 20 min through a 23–48% Percoll density gradient (prepared in DMEM containing 10% FBS). Mononuclear cells at the interface were collected, washed twice with DMEM containing 10% FBS, and used as crude Kupffer cells. For skin macrophages, the skins of 6- to 8-wk-old female mice were shaved, cut into small pieces, and incubated for 25 min at 37 °C in DMEM containing10% FBS, 1 mg/mL collagenase D, 1 mg/mL Dispase II (Roche Diagnostics), and 100 μg/mL DNase I. Cells were passed through a 70-μm cell strainer, collected by centrifugation at 500 × g for 5 min, washed with DMEM containing 10% FBS, and used as crude skin macrophages. For Western blotting and real-time PCR, Kupffer cells and skin macrophages were further purified by FACSAria II, using PE/Cy7-anti-F4/80 for Kupffer cells (47), or PE/Cy7-anti-CD11b and AlexaFluor647 anti-CD169 (sialoadherin or MOMA-1) for skin macrophages (30, 46), respectively.
Immunofluorescence.
Livers of 9- to 10-wk-old mice were perfused with 4% formaldehyde in PBS for 20 min and skins of 6- to 7-wk-old mice were immersed in 4% formaldehyde in PBS for 20 min. The tissues were cryoprotected by incubating at 4 °C overnight in PBS containing 25% sucrose, embedded in OCT compound, and frozen. Sections (8 μm thick) were prepared by a cryostat, and permeabilized with 0.3% Triton X-100 in PBS. After incubation in PBS containing 2% BSA, the samples were incubated with goat anti-mTim4 Ab and rat anti-CD169 mAb (clone 3D6.112) in Can Get Signal Immunostain Solution A (Toyobo Life Science), followed by incubation with Alexa Fluor488-donkey anti-goat IgG and AlexaFluor647-donkey anti-rat IgG, and observed by fluorescent microscopy (Olympus Fluoview FV1000).
Efferocytosis.
Efferocytosis was assayed as described previously (51). In brief, mouse thymocytes were treated at 37 °C for 90 min with 100 units/mL of FasL in serum-free DMEM and washed with PBS. The cells were then incubated at room temperature for 30 min with 0.15 μg/mL pHrodo red succinimidyl ester (Thermo Fisher Scientific), washed with DMEM, and used as prey.
NIH 3T3 cells and their derivatives were plated on 24-well culture plates at 5 × 10⁴ cells per well, and cultured for 6–7 h in DMEM containing 10% FBS. After changing the medium to serum-free DMEM, the cells were further cultured overnight and preincubated with mProS or mGas6 at 37 °C for 15 min in DMEM containing 5 mg/mL BSA. To each well 1 × 10⁶ pHrodo-labeled apoptotic thymocytes was added, and the mixtures were incubated at 37 °C for 65 min. The cells were detached by treating with Accutase (Nacalai Tesque), suspended in 20 mM CHES-NaOH buffer (pH 9.0) containing 150 mM NaCl and 2% FBS, and analyzed by flow cytometry. For microscopic observation, the medium was changed to FluoroBrite DMEM (Thermo Fischer Scientific), and the cells were observed with a confocal microscope (Olympus, Fluoview FV1000). For tissue macrophages, 2 × 10⁵ cells were seeded into 24-well plates and cultured in DMEM containing 10% FBS for 2 h. The cells were washed with DMEM and preincubated with mProS or mGas6 as described above. To each well 1 × 10⁶ pHrodo-labeled apoptotic thymocytes was added, and the mixtures were incubated at 37 °C for 1 h for thioglycollate-elicited peritoneal macrophages, for 2 h for Kupffer cells, skin macrophages, and microglia, or for 75 min for resident peritoneal macrophages.
Two-tailed Student’s t tests were used for statistical testing between two groups.
Acknowledgments
We thank M. Fujii for secretarial assistance. This work was supported in part by grants-in-aid from the Japan Society for the Promotion of Science (to Y.Y., K.S., and S.N.) and by Core Research for Evolutional Science and Technology (Grant JPMJCR14M4 to S.N.).
Footnotes
Conflict of interest statement: S.N. and Masato Tanaka are coauthors on a 2017 review article.
This article contains supporting information online at www.pnas.org/lookup/suppl/doi:10.1073/pnas.1705365114/-/DCSupplemental.
References
- 1.deCathelineau AM, Henson PM. The final step in programmed cell death: Phagocytes carry apoptotic cells to the grave. Essays Biochem. 2003;39:105–117. doi: 10.1042/bse0390105. [DOI] [PubMed] [Google Scholar]
- 2.Nagata S, Hanayama R, Kawane K. Autoimmunity and the clearance of dead cells. Cell. 2010;140:619–630. doi: 10.1016/j.cell.2010.02.014. [DOI] [PubMed] [Google Scholar]
- 3.Muñoz LE, Lauber K, Schiller M, Manfredi AA, Herrmann M. The role of defective clearance of apoptotic cells in systemic autoimmunity. Nat Rev Rheumatol. 2010;6:280–289. doi: 10.1038/nrrheum.2010.46. [DOI] [PubMed] [Google Scholar]
- 4.Arandjelovic S, Ravichandran KS. Phagocytosis of apoptotic cells in homeostasis. Nat Immunol. 2015;16:907–917. doi: 10.1038/ni.3253. [DOI] [PMC free article] [PubMed] [Google Scholar]
- 5.Hafizi S, Dahlbäck B. Gas6 and protein S. Vitamin K-dependent ligands for the Axl receptor tyrosine kinase subfamily. FEBS J. 2006;273:5231–5244. doi: 10.1111/j.1742-4658.2006.05529.x. [DOI] [PubMed] [Google Scholar]
- 6.Nakano T, et al. Cell adhesion to phosphatidylserine mediated by a product of growth arrest-specific gene 6. J Biol Chem. 1997;272:29411–29414. doi: 10.1074/jbc.272.47.29411. [DOI] [PubMed] [Google Scholar]
- 7.Griffin JH, Gruber A, Fernández JA. Reevaluation of total, free, and bound protein S and C4b-binding protein levels in plasma anticoagulated with citrate or hirudin. Blood. 1992;79:3203–3211. [PubMed] [Google Scholar]
- 8.Dahlbäck B, Hildebrand B, Malm J. Characterization of functionally important domains in human vitamin K-dependent protein S using monoclonal antibodies. J Biol Chem. 1990;265:8127–8135. [PubMed] [Google Scholar]
- 9.Balogh I, Hafizi S, Stenhoff J, Hansson K, Dahlbäck B. Analysis of Gas6 in human platelets and plasma. Arterioscler Thromb Vasc Biol. 2005;25:1280–1286. doi: 10.1161/01.ATV.0000163845.07146.48. [DOI] [PubMed] [Google Scholar]
- 10.Rothlin CV, Carrera-Silva EA, Bosurgi L, Ghosh S. TAM receptor signaling in immune homeostasis. Annu Rev Immunol. 2015;33:355–391. doi: 10.1146/annurev-immunol-032414-112103. [DOI] [PMC free article] [PubMed] [Google Scholar]
- 11.Sasaki T, et al. Structural basis for Gas6-Axl signalling. EMBO J. 2006;25:80–87. doi: 10.1038/sj.emboj.7600912. [DOI] [PMC free article] [PubMed] [Google Scholar]
- 12.Miyanishi M, et al. Identification of Tim4 as a phosphatidylserine receptor. Nature. 2007;450:435–439. doi: 10.1038/nature06307. [DOI] [PubMed] [Google Scholar]
- 13.Nishi C, Toda S, Segawa K, Nagata S. Tim4- and MerTK-mediated engulfment of apoptotic cells by mouse resident peritoneal macrophages. Mol Cell Biol. 2014;34:1512–1520. doi: 10.1128/MCB.01394-13. [DOI] [PMC free article] [PubMed] [Google Scholar]
- 14.Hasanbasic I, Rajotte I, Blostein M. The role of gamma-carboxylation in the anti-apoptotic function of gas6. J Thromb Haemost. 2005;3:2790–2797. doi: 10.1111/j.1538-7836.2005.01662.x. [DOI] [PubMed] [Google Scholar]
- 15.Heeb MJ, Radtke K-P, Fernández JA, Tonnu L. Plasma contains protein S monomers and multimers with similar direct anticoagulant activity. J Thromb Haemost. 2006;4:2215–2222. doi: 10.1111/j.1538-7836.2006.02117.x. [DOI] [PubMed] [Google Scholar]
- 16.Lew ED, et al. Differential TAM receptor-ligand-phospholipid interactions delimit differential TAM bioactivities. eLife. 2014;3:e03385. doi: 10.7554/eLife.03385. [DOI] [PMC free article] [PubMed] [Google Scholar]
- 17.Anderson HA, et al. Serum-derived protein S binds to phosphatidylserine and stimulates the phagocytosis of apoptotic cells. Nat Immunol. 2003;4:87–91. doi: 10.1038/ni871. [DOI] [PubMed] [Google Scholar]
- 18.Cooper MA. Optical biosensors in drug discovery. Nat Rev Drug Discov. 2002;1:515–528. doi: 10.1038/nrd838. [DOI] [PubMed] [Google Scholar]
- 19.Hsu PD, Lander ES, Zhang F. Development and applications of CRISPR-Cas9 for genome engineering. Cell. 2014;157:1262–1278. doi: 10.1016/j.cell.2014.05.010. [DOI] [PMC free article] [PubMed] [Google Scholar]
- 20.Nguyen K-QN, et al. Overexpression of MERTK receptor tyrosine kinase in epithelial cancer cells drives efferocytosis in a gain-of-function capacity. J Biol Chem. 2014;289:25737–25749. doi: 10.1074/jbc.M114.570838. [DOI] [PMC free article] [PubMed] [Google Scholar]
- 21.Zagórska A, Través PG, Lew ED, Dransfield I, Lemke G. Diversification of TAM receptor tyrosine kinase function. Nat Immunol. 2014;15:920–928. doi: 10.1038/ni.2986. [DOI] [PMC free article] [PubMed] [Google Scholar]
- 22.Studer RA, Opperdoes FR, Nicolaes GAF, Mulder AB, Mulder R. Understanding the functional difference between growth arrest-specific protein 6 and protein S: An evolutionary approach. Open Biol. 2014;4:140121. doi: 10.1098/rsob.140121. [DOI] [PMC free article] [PubMed] [Google Scholar]
- 23.Park D, et al. BAI1 is an engulfment receptor for apoptotic cells upstream of the ELMO/Dock180/Rac module. Nature. 2007;450:430–434. doi: 10.1038/nature06329. [DOI] [PubMed] [Google Scholar]
- 24.Park SY, et al. Rapid cell corpse clearance by stabilin-2, a membrane phosphatidylserine receptor. Cell Death Differ. 2008;15:192–201. doi: 10.1038/sj.cdd.4402242. [DOI] [PubMed] [Google Scholar]
- 25.Hanayama R, et al. Identification of a factor that links apoptotic cells to phagocytes. Nature. 2002;417:182–187. doi: 10.1038/417182a. [DOI] [PubMed] [Google Scholar]
- 26.Vollmar B, Menger MD. The hepatic microcirculation: Mechanistic contributions and therapeutic targets in liver injury and repair. Physiol Rev. 2009;89:1269–1339. doi: 10.1152/physrev.00027.2008. [DOI] [PubMed] [Google Scholar]
- 27.Terpstra V, van Berkel TJ. Scavenger receptors on liver Kupffer cells mediate the in vivo uptake of oxidatively damaged red blood cells in mice. Blood. 2000;95:2157–2163. [PubMed] [Google Scholar]
- 28.Sitia G, et al. Kupffer cells hasten resolution of liver immunopathology in mouse models of viral hepatitis. PLoS Pathog. 2011;7:e1002061. doi: 10.1371/journal.ppat.1002061. [DOI] [PMC free article] [PubMed] [Google Scholar]
- 29.Wang J, Kubes P. A reservoir of mature cavity macrophages that can rapidly invade visceral organs to affect tissue repair. Cell. 2016;165:668–678. doi: 10.1016/j.cell.2016.03.009. [DOI] [PubMed] [Google Scholar]
- 30.Davies LC, Jenkins SJ, Allen JE, Taylor PR. Tissue-resident macrophages. Nat Immunol. 2013;14:986–995. doi: 10.1038/ni.2705. [DOI] [PMC free article] [PubMed] [Google Scholar]
- 31.Pasparakis M, Haase I, Nestle FO. Mechanisms regulating skin immunity and inflammation. Nat Rev Immunol. 2014;14:289–301. doi: 10.1038/nri3646. [DOI] [PubMed] [Google Scholar]
- 32.Wesseling MC, et al. Phosphatidylserine exposure in human red blood cells depending on cell age. Cell Physiol Biochem. 2016;38:1376–1390. doi: 10.1159/000443081. [DOI] [PubMed] [Google Scholar]
- 33.Scott RS, et al. Phagocytosis and clearance of apoptotic cells is mediated by MER. Nature. 2001;411:207–211. doi: 10.1038/35075603. [DOI] [PubMed] [Google Scholar]
- 34.Hanayama R, et al. Autoimmune disease and impaired uptake of apoptotic cells in MFG-E8-deficient mice. Science. 2004;304:1147–1150. doi: 10.1126/science.1094359. [DOI] [PubMed] [Google Scholar]
- 35.Uderhardt S, et al. 12/15-lipoxygenase orchestrates the clearance of apoptotic cells and maintains immunologic tolerance. Immunity. 2012;36:834–846. doi: 10.1016/j.immuni.2012.03.010. [DOI] [PubMed] [Google Scholar]
- 36.Geissmann F, et al. Development of monocytes, macrophages, and dendritic cells. Science. 2010;327:656–661. doi: 10.1126/science.1178331. [DOI] [PMC free article] [PubMed] [Google Scholar]
- 37.Shi C, Pamer EG. Monocyte recruitment during infection and inflammation. Nat Rev Immunol. 2011;11:762–774. doi: 10.1038/nri3070. [DOI] [PMC free article] [PubMed] [Google Scholar]
- 38.Gautier EL, et al. Immunological Genome Consortium Gene-expression profiles and transcriptional regulatory pathways that underlie the identity and diversity of mouse tissue macrophages. Nat Immunol. 2012;13:1118–1128. doi: 10.1038/ni.2419. [DOI] [PMC free article] [PubMed] [Google Scholar]
- 39.Zhang Y, et al. An RNA-sequencing transcriptome and splicing database of glia, neurons, and vascular cells of the cerebral cortex. J Neurosci. 2014;34:11929–11947. doi: 10.1523/JNEUROSCI.1860-14.2014. [DOI] [PMC free article] [PubMed] [Google Scholar]
- 40.Dransfield I, Zagórska A, Lew ED, Michail K, Lemke G. Mer receptor tyrosine kinase mediates both tethering and phagocytosis of apoptotic cells. Cell Death Dis. 2015;6:e1646. doi: 10.1038/cddis.2015.18. [DOI] [PMC free article] [PubMed] [Google Scholar]
- 41.Gordon S, Plüddemann A, Martinez Estrada F. Macrophage heterogeneity in tissues: Phenotypic diversity and functions. Immunol Rev. 2014;262:36–55. doi: 10.1111/imr.12223. [DOI] [PMC free article] [PubMed] [Google Scholar]
- 42.Birge RB, et al. Phosphatidylserine is a global immunosuppressive signal in efferocytosis, infectious disease, and cancer. Cell Death Differ. 2016;23:962–978. doi: 10.1038/cdd.2016.11. [DOI] [PMC free article] [PubMed] [Google Scholar]
- 43.Morizono K, Chen ISY. Role of phosphatidylserine receptors in enveloped virus infection. J Virol. 2014;88:4275–4290. doi: 10.1128/JVI.03287-13. [DOI] [PMC free article] [PubMed] [Google Scholar]
- 44.Das Sarma J, et al. Functional interleukin-17 receptor A is expressed in central nervous system glia and upregulated in experimental autoimmune encephalomyelitis. J Neuroinflammation. 2009;6:14. doi: 10.1186/1742-2094-6-14. [DOI] [PMC free article] [PubMed] [Google Scholar]
- 45.Hong E-J, Levasseur M-P, Dufour CR, Perry M-C, Giguère V. Loss of estrogen-related receptor α promotes hepatocarcinogenesis development via metabolic and inflammatory disturbances. Proc Natl Acad Sci USA. 2013;110:17975–17980. doi: 10.1073/pnas.1315319110. [DOI] [PMC free article] [PubMed] [Google Scholar]
- 46.Thornley TB, et al. Fragile TIM-4-expressing tissue resident macrophages are migratory and immunoregulatory. J Clin Invest. 2014;124:3443–3454. doi: 10.1172/JCI73527. [DOI] [PMC free article] [PubMed] [Google Scholar]
- 47.You Q, Cheng L, Kedl RM, Ju C. Mechanism of T cell tolerance induction by murine hepatic Kupffer cells. Hepatology. 2008;48:978–990. doi: 10.1002/hep.22395. [DOI] [PMC free article] [PubMed] [Google Scholar]
- 48.Miyanishi M, Segawa K, Nagata S. Synergistic effect of Tim4 and MFG-E8 null mutations on the development of autoimmunity. Int Immunol. 2012;24:551–559. doi: 10.1093/intimm/dxs064. [DOI] [PubMed] [Google Scholar]
- 49.Raymond C, et al. A simplified polyethylenimine-mediated transfection process for large-scale and high-throughput applications. Methods. 2011;55:44–51. doi: 10.1016/j.ymeth.2011.04.002. [DOI] [PubMed] [Google Scholar]
- 50.Pace CN, Vajdos F, Fee L, Grimsley G, Gray T. How to measure and predict the molar absorption coefficient of a protein. Protein Sci. 1995;4:2411–2423. doi: 10.1002/pro.5560041120. [DOI] [PMC free article] [PubMed] [Google Scholar]
- 51.Toda S, Hanayama R, Nagata S. Two-step engulfment of apoptotic cells. Mol Cell Biol. 2012;32:118–125. doi: 10.1128/MCB.05993-11. [DOI] [PMC free article] [PubMed] [Google Scholar]


