

Abstract
Purpose
Recently, a covariate model characterizing developmental changes in clearance of amikacin in neonates has been developed using birth bodyweight and postnatal age. The aim of this study was to evaluate whether this covariate model can be used to predict maturation in clearance of other renally excreted drugs.
Methods
Five different neonatal datasets were available on netilmicin, vancomycin, tobramycin and gentamicin. The extensively validated covariate model for amikacin clearance was used to predict clearance of these drugs. In addition, independent reference models were developed based on a systematic covariate analysis.
Results
The descriptive and predictive properties of the models developed using the amikacin covariate model were good, and fairly similar to the independent reference models (goodness-of-fit plots, NPDE). Moreover, similar clearance values were obtained for both approaches. Finally, the same covariates as in the covariate model of amikacin, i.e. birth bodyweight and postnatal age, were identified on clearance in the independent reference models.
Conclusions
This study shows that pediatric covariate models may contain physiological information since information derived from one drug can be used to describe other drugs. This semi-physiological approach may be used to optimize sparse data analysis and to derive individualized dosing algorithms for drugs in children.
Keywords: developmental changes, extrapolation, glomerular filtration rate, neonates, pharmacokinetics
INTRODUCTION
Although regulations like the Pediatric Rule (FDA) and the Pediatric Regulation (EMA), encourage pharmaceutical companies to perform research in the pediatric age range when new drugs are developed, to date, drugs in pediatrics are often administered in an off-label or unlicensed manner (1–3). Because of practical, ethical and economical reasons, it remains very challenging to perform pharmacokinetic and pharmacodynamic studies in the pediatric population with the ultimate aim to develop rational dosing regimens (4,5). One of the preferred approaches to facilitate the knowledge on the pharmacokinetics and pharmacodynamics in pediatrics is by applying population pharmacokinetic/pharmacodynamic (PK/PD) modeling (4,6–8). This approach is based on a simultaneous analysis of all data of the entire population while still taking into account that different observations are derived from different patients. Consequently, this population approach allows for the analysis of sparse and unbalanced data, which often applies to pediatric clinical studies. Moreover, the application of the population approach may lead, besides a reduction in invasiveness and burden for the patients, to considerably reduced costs.
However, to avoid that for each new or existing drug a systematic and time-consuming pharmacokinetic and/or pharmacodynamic analysis needs to be conducted (9,10), new approaches are required. One approach, which is gaining more attention in industry, academia and regulatory agencies, is to develop evidence-based dosing regimens in children by PK/PD modeling and simulation in which extrapolations are performed between populations that vary in age (10–12) (bridging). Another recently proposed approach is the use of information obtained from one drug for extrapolation to other drugs that are eliminated through the same route (13). This implicates that pediatric covariate models also contain biological system-specific information reflecting underlying physiological changes that can be used between drugs (13–15).
In a previous analysis, the developmental changes in amikacin clearance were characterized in more than 800 (pre)term neonates with varying gestational ages, birth bodyweights and postnatal ages, on the basis of birth bodyweight and postnatal age as covariates representing antenatal and postnatal maturation of the kidney, respectively (16). The aim of this study was to evaluate whether this internally and externally validated covariate model of amikacin in (pre)term neonates contains system-specific information on the developmental changes in glomerular filtration and that therefore the covariate model can be extrapolated to other drugs eliminated through glomerular filtration. In this study the amikacin covariate model was primarily extrapolated to netilmicin, tobramycin, vancomycin and gentamicin, drugs which were used as paradigm compounds as they are all almost entirely eliminated through GFR and with similar physicochemical properties compared to amikacin.
MATERIALS AND METHODS
Patients and Data
For this analysis, data of renally excreted antibiotics in neonates were obtained from 5 different (in part) previously published studies (17–21). Since the amikacin covariate model (16) which was based on data from 874 neonates varying in postnatal age between 1 and 30 days, was used to describe the data of the other renally excreted drugs, only neonates with a postnatal age until 30 days were included from these datasets. Besides trough and peak samples taken before and at 1 h after initiation of the dose, respectively, samples at varying time points were available in all datasets (17,19–21), except for the tobramycin dataset (18). An overview of the patient characteristics of the different datasets is given in Table I. The different datasets are discussed briefly here, while more details on the studies can be found in the original articles (17–21).
Table I.
Overview of the Patient Characteristics of the Model Developed for Amikacin Applied in the Models Using the Amikacin Covariate Model and of the Different Datasets Used in the Current Analysis as Basis for the Models Using the Amikacin Covariate Model and the Independent Reference Models
| Dataset | Amikacin dataset (16) | Datasets used in this analysis | ||||
|---|---|---|---|---|---|---|
|
|
||||||
| Amikacin (16) | Netilmicin (17) | Tobramycin (18) | Vancomycin (19) | Gentamicin A (20) | Gentamicin B (21) | |
| Number of patients | 874 | 88 | 470 | 273 | 673 | 59 |
| Gestational age (weeks) | 32 (24–43) | 28 (23–41) | 32 (24–43) | 29 (23–34) | 34 (23–43) | 29 (23–42) |
| Postmenstrual age (weeks) | 33 (24–43) | 30 (23–44) | 32 (24–43) | 30 (24–38) | 36 (23–44) | 30 (23–42) |
| Postnatal age (days) | 2 (1–30) | 15 (3–30) | 2 (1–4) | 14 (1–28) | 3 (1–30) | 6 (1–30) |
| Birth bodyweight (g) | 1,750 (385–4,650) | 1,000 (470–3,000) | 1,530 (485–5,245) | 1,140 (385–2,550) | 2,350 (440–5,240) | 1,279 (520–4,950) |
| Current bodyweight (g) | 1,760 (385–4,760) | 1,115 (470–3,592) | – | 1,170 (415–2,630) | 2,550 (440–5,420) | 1,009 (480–5,315) |
| Co-administration of ibuprofen or indomethacin (n(%)) | 118 (13.5) | – | 45 (9.6) | 23 (8.4) | 70 (10.4) | 6 (10.2) |
Values are expressed as median (range)
Amikacin (16)
A dataset of amikacin containing 2,186 concentrations from 874 (pre)term neonates (birth bodyweight (bBW) 385–4,650 g, postnatal age (PNA) 1–30 days) was used to obtain the amikacin covariate model. Patients were enrolled in the study when at least one peak and trough concentration was available for each patient.
Netilmicin (17)
This dataset contained 267 netilmicin concentrations, collected in 88 (pre)term neonates (bBW 470–3,000 g, PNA 3–30 days). Concentrations were taken at the administration of the third dose or after a change in dose or dosing interval.
Tobramycin (18)
Four-hundred and seventy (pre)term neonates (bBW 485–5,245 g, PNA 1–4 days) were included in this dataset of which only paired peak and trough concentrations were available (taken after and before the fourth dose) resulting in 940 tobramycin concentrations.
Vancomycin (19)
This dataset contained 689 vancomycin concentrations collected in 273 preterm neonates (bBW 385–2,550 g, PNA 1–28 days). Concentrations were taken around the second or third dose infusion of vancomycin.
Gentamicin (20,21)
For this drug two different datasets were available.
The first dataset (Gentamicin A), was obtained after combining previously published data (20) with more recently obtained data, resulting in a total of 1,531 concentrations from 673 (pre)term neonates (bBW 440–5,240 g, PNA 1–30 days).
In the second dataset (Gentamicin B) (21), 796 gentamicin concentrations were available of 59 (pre)term neonates (bBW 520–4,950 g, PNA 1–30). In this study several concentrations taken at different time points (e.g. 15 min or 4–8 h after the end of the infusion), besides peak and trough, were available.
Pharmacokinetic Modeling
Model Development
Non-linear mixed effect modeling was used to analyze the pharmacokinetic data. The first-order conditional estimation method with interaction option was used in NONMEM 6.2. (ICON Development solutions, Hanover, MD, USA). The following tools were used to visualize and evaluate the model: S-Plus version 6.2.1 (Insightful software, Seattle, WA) with NM.SP.interface version 05.03.01 (© by LAP&P Consultants BV, Leiden, The Netherlands), PsN and R (version 2.10.1). To test the hypothesis of between-drug extrapolation of covariate models, two different population pharmacokinetic models were developed for each dataset (14): 1) Models using the amikacin covariate model (16) and 2) Independent reference models based on a systematic covariate analysis. More information on both approaches can be found below under Covariate model. Model development was performed in four different steps: (i) choice of the structural model, (ii) choice of the statistical sub-model, (iii) choice of the covariate model, (iv) model evaluation. Discrimination between models was based on different diagnostic tools (22). A difference in objective function value (OFV) of 3.9 points or more was considered as statistically significant (p <0.05 based on χ2 distribution). Finally, the goodness-of-fit plots, the total number of parameters, visual improvement of individual plots, correlation matrix, confidence intervals of parameter estimates, ill-conditioning (23) and shrinkage (24) were assessed. The ill-conditioning was assessed by taking the ratio of the largest and smallest eigenvalue of the covariance matrix of the estimate from the NONMEM output.
Structural Model
For the structural model, both one-, two and three-compartment models were tested. A two compartment model parameterized in terms of clearance (CL), inter-compartmental clearance (Q), volume of distribution of the central compartment (V1) and the peripheral compartment (V2) was found to best describe the different datasets for both the models using the amikacin covariate models as the reference models. Only for the reference model of tobramycin, a two compartment model could not be supported as only peak and trough samples were available. Therefore, a one compartment model was preferred for the tobramycin reference model. For some of the models no covariance step could be given or the bootstrap failed meaning that some of the models were possibly overparameterized. As a result these models were simplified by equalizing V2 to V1 or Q to CL or by estimating Q as a fraction of clearance. These assumptions did not influence the estimate of the parameters of primary focus (CL and V1) with changes in parameter estimates being less than 5%.
Statistical Submodel
The interindividual variability was tested assuming a log-normal distribution in an individual i (post hoc value) and is given by the following equation:
| (1) |
in which θTV is the typical value of the parameter and ηi is assumed to be a random variable with mean value zero and variance ω2. For the intra-individual variability and residual error (statistical submodel), proportional, additive and combination error models were tested. In this analysis, the interindividual variability was only estimated on clearance since the interindividual variability on the other parameters (V1, V2 and Q) could not be estimated and was therefore fixed to zero for all models. For the intra-individual variability and residual error a proportional error model (Eq. 2) was chosen for all the models:
| (2) |
where Yij is the j th observation in the i th individual, Cpred,ij is the predicted concentration and εij is a random variable from a normal distribution with a mean of zero and estimated variance of σ2.
Covariate Model
For each dataset two population pharmacokinetic models were developed as proposed in the analysis of Krekels et al. (14)
Models Using the Amikacin Covariate Model (16)
In these models, the internally and externally validated covariate model for amikacin (16) (Fig. 1), was directly incorporated into the pharmacokinetic model that was developed for each dataset. This implicates that birth bodyweight was implemented as a covariate on clearance using a power function with an exponent of 1.34 as well as postnatal age using a linear function with a slope of 0.213. In the original covariate model of amikacin, co-administration of ibuprofen was identified as a third covariate on clearance, causing a 16.2% decrease in clearance of amikacin. This decrease in clearance was also implemented in the current analysis when ibuprofen or indomethacin was co-administered. Although the decrease in glomerular filtration was reported to be more pronounced after the administration of indomethacin compared to ibuprofen (25), in this analysis the 16.2% decrease in clearance seen for ibuprofen was also applied for indomethacin.
Fig. 1.

Covariate model of amikacin (16) which was applied to the other renally excreted drugs. The figure illustrates the model-based predicted amikacin clearance (CL) values versus birth bodyweight (bBW) for post-natal age of 0, 14 and 28 days with (grey) and without (black) co-administration of ibuprofen. Birth bodyweight reflects the antenatal maturation of the kidney, postnatal age is reflecting the postnatal maturation. Reproduced from [De Cock RF, Allegaert K, Schreuder MF, et al. Maturation of the glomerular filtration rate in neonates, as reflected by amikacin clearance. Clin Pharmacokinet 2012 Feb 1;51 (2): 105–17] with permission from Adis (© Springer International Publishing AG [2012]. All rights reserved.).
Current bodyweight was implemented on volume of distribution using a power function with 0.919 as exponent. While the pediatric covariate model is considered to describe the developmental changes in clearance and volume of distribution, the population values of these parameters were still estimated by NONMEM since they are considered drug specific properties (14) (Eq. 3):
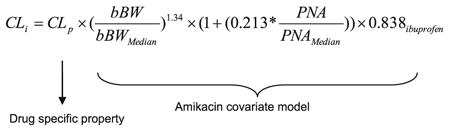 |
where CLi represents the clearance in the ith individual, CLp represents the population value of clearance and is estimated separately for each drug since it is considered to be a drug specific property, and the amikacin covariate model with birth bodyweight (bBW), postnatal age (PNA) and co-administration of ibuprofen is considered to describe the developmental changes in clearance through glomerular filtration.
Independent Reference Models (14)
For these models a systematic covariate analysis (22) was performed in which the following covariates were tested for significance: birth bodyweight (weight at day of birth), current bodyweight (weight at day of blood sampling), gestational age, postmenstrual age, postnatal age, serum creatinine, co-administration of ibuprofen or indomethacin. Covariates were tested using a linear or power function. For serum creatinine, linear or power functions were tested in the denominator since a negative relationship was seen between serum creatinine concentrations and clearance. Previously, it has been shown that serum creatinine values in the first days of life are derived from the mother reflecting maternal renal function instead of neonatal renal function (26,27). Additionally, a progressive increase in serum creatinine concentrations has been reported with maximum serum creatinine concentrations at day 3–4 after birth followed by a subsequent decrease. This trend may be caused by differences in duration and extent of passive tubular back leak (28). As a consequence, serum creatinine values in the first 5 days of life were not taken into account in this analysis.
The significance of a covariate was statistically evaluated by the use of the objective function value. In the forward inclusion a p value <0.005 was considered as statistically significant while a more stringent p value <0.001 was used in the backward deletion. When two or more covariates were found to significantly improve the model, the covariate that reduces the objective function value the most was retained into the model and served as a basis for subsequent inclusion of additional covariates. In addition, the individual and population predicted parameters were plotted against the most predictive covariate to evaluate whether the individual predicted parameters were equally distributed around the population predicted parameters (22). Finally the covariate model was evaluated as mentioned previously under Model development, whereby the results of the Model validation were also considered.
Model Validation
The models using the amikacin covariate model as well as the independent reference models were internally validated using two different methods (22).
To evaluate parameter precision and stability a non stratified bootstrap analysis was performed in which 1,000 replicate datasets of the same size as the original data analysis but with a different combination of individuals were generated. The parameter estimates obtained with the bootstrap were compared to the parameter estimates of the final models.
To evaluate the predictive properties of the models using the amikacin covariate model and reference models, the normalized prediction distribution error method (NPDE) was used, which is a Monte-Carlo simulation-based diagnostic in which the random effects were included (29,30) The dataset was simulated 1,000 times in NONMEM, each observed concentration was subsequently compared to the simulated reference distribution using the NPDE add-on package in R. A histogram of the NPDE distribution in the total dataset and plots of NPDE versus individual predicted concentrations and versus time were used to evaluate the final model.
Comparison of the Models Using the Amikacin Covariate Model and Independent Reference Models
The descriptive and predictive performance of the models using the amikacin covariate model and the independent reference models was compared by different diagnostic tools (14,22). The goodness-of-fit plots were compared to visually evaluate the descriptive performance. Secondly, individual and population clearance values obtained in the models using the amikacin covariate model were compared with the values obtained in the independent reference models (14). To evaluate the difference in clearance values more closely between both models, the population clearance values were plotted for both approaches versus birth bodyweight for PNA 1, 14 and 28 days. Furthermore, the individual and population predicted parameters were plotted against the most predictive covariate for both approaches to evaluate whether the individual predicted parameters were equally distributed around the population parameters (22). Additionally, the objective function values were evaluated as the models developed using both approaches are based on the same datasets. Finally, the results of the model validation (bootstrap analysis) as well as ill-conditioning and shrinkage were assessed. The predictive performance of the models using the amikacin covariate model and reference models was evaluated by comparison of the NPDE-results.
RESULTS
Pharmacokinetic Modeling
Models Using the Amikacin Covariate Model (16)
In these models, the previously published amikacin covariate model (Fig. 1) was directly incorporated in the pharmacokinetic models of the different drugs. The parameter estimates obtained for the models using the amikacin covariate model are shown in Table II together with the parameter estimates obtained in the final model for amikacin (16). As illustrated in Fig. 2 (top panels), the models using the amikacin covariate model described the observed concentrations without bias. The individual post hoc clearances and population predicted clearances versus the most predictive covariate (birth bodyweight) are given in Fig. 3, showing that the population predicted clearance values are describing the individual post hoc clearances without bias. Furthermore, the results of the NPDE analysis in Fig. 4 show that the models can predict the median concentrations in the different datasets accurately. Finally, no trend was seen in the plots of the NPDE versus time and predicted concentrations (Fig. 4).
Table II.
Final Parameter Estimates and Their Corresponding Coefficients of Variation (CV%) of the Model Developed for Amikacin Applied in the Models Using the Amikacin Covariate Model and of the Models Derived in the Current Study Using the Amikacin Covariate Model for Netilmicin, Tobramycin, Vancomycin, Gentamicin Dataset A and Gentamicin Dataset B
| Amikacin (16) | Netilmicin (17) | Tobramycin (18) | Vancomycin (19) | Gentamicin A (20) | Gentamicin B (21) | |
|---|---|---|---|---|---|---|
| Parameter | ||||||
| Objective function value | 7738.145 | 278.771 | 970.81 | 2763.631 | 1824.456 | 570.064 |
| Fixed effects | ||||||
| CLp in CL = CLp × (bBW/median)m × (1+ n × (PNA/median)) × o (ibuprofen) | 0.049 (2.21) | 0.051 (5.22) | 0.062 (2.06) | 0.053 (2.74) | 0.049 (1.47) | 0.047 (3.12) |
| m | 1.34 (2.04) | 1.34 | 1.34 | 1.34 | 1.34 | 1.34 |
| n | 0.213 (9.81) | 0.213 | 0.213 | 0.213 | 0.213 | 0.213 |
| o | 0.838 (3.88) | – | 0.838 | 0.838 | 0.838 | 0.838 |
| Vp in V1 = Vp × (cBW/median)p | 0.833 (1.34) | 0.995 (7.64) | 1.03 (1.42) | 0.913 (2.69) | 0.762 (1.9) | 0.731 (3.35) |
| p | 0.919 (2.46) | 0.919 | 0.919 | 0.919 | 0.919 | 0.919 |
| Q = r × CL | 0.415 (12.3) | – | – | 0.904 (10.4) | – | 1.47 (14.3) |
| Q = CL | – | Q = CL | Q = CL | – | Q = CL | – |
| V2 = V1 | V2 = V1 | V2 = V1 | V2 = V1 | V2 = V1 | V2 = V1 | V2 = V1 |
| Interindividual variability | ||||||
| ω2 (CL) | 0.0899 (14.9) | 0.186 (32.4) | 0.15 (10.7) | 0.11 (12.1) | 0.106 (13.4) | 0.0536 (21.8) |
| Residual variability | ||||||
| σ2 (proportional) | 0.0614 (8.2) | 0.117 (18.2) | 0.044 (9.62) | 0.095 (7.89) | 0.0804 (9.37) | 0.0483 (12.1) |
| σ2 (additive) | 0.267 (27.2) | – | – | – | – | – |
CLp population value for clearance, Vp population value for volume of distribution of the central compartment, bBW bodyweight at birth, cBW current bodyweight, PNA postnatal age, Q intercompartmental clearance, V2 volume of distribution of the peripheral compartment
Fig. 2.

Observed versus population predicted concentrations for the models using the amikacin covariate model (top) and the independent reference models (bottom) of netilmicin, vancomycin, tobramycin, gentamicin A and gentamicin B.
Fig. 3.

Individual post hoc (black) and population predicted (grey) clearance values (l/h) versus the most predictive covariate, birth bodyweight (g), for the models using the amikacin covariate model.
Fig. 4.

Results of the NPDE analysis for the models using the amikacin covariate model of (a) netilmicin, (b) tobramycin, (c) vancomycin, (d) gentamicin A and (e) gentamicin B. Left panel: Histograms of the NPDE distribution with the solid line representing a normal distribution as a reference, Middle panel: NPDE versus time (hours); Right panel: NPDE versus observed concentrations (mg/L).
Independent Reference Models
In the independent reference models of netilmicin, vancomycin and gentamicin datasets A and B, birth bodyweight and postnatal age were identified as the most important covariates to describe clearance. Current bodyweight was found as most important covariate to describe volume of distribution. Birth bodyweight and current bodyweight were implemented on clearance and volume of distribution of the central compartment, respectively, using a power function. Postnatal age was implemented using a power function (netilmicin, gentamicin A and gentamicin B datasets) or linear function (vancomycin dataset) depending on the dataset. For tobramycin, birth bodyweight was implemented on both clearance and volume of distribution using a power function. Based on the statistical criteria, postnatal age was not identified as a covariate on clearance. This may be explained by the fact that data of tobramycin were only available for the first 4 days after birth. In Fig. 2 (bottom panels) the observed versus population predicted concentrations are illustrated for the independent reference models. In Table III, the different parameter estimates are given for the reference models of the 5 different neonatal datasets. In the various independent reference models, serum creatinine was not found as a covariate to describe clearance. Furthermore when plotting the individual and population predicted clearance values versus birth bodyweight, it was seen that the individual post hoc clearances were randomly scattered around the population predicted clearances (figures not shown). Finally the results of the NPDE analyzes showed that the independent reference models were able to adequately predict the median concentrations of the different datasets (figures not shown).
Table III.
Final Parameter Estimates and Their Corresponding Coefficients of Variation (CV%) of the Independent Reference Models Derived in the Current Study for Netilmicin, Tobramycin, Vancomycin, Gentamicin Dataset A and Gentamicin Dataset B
| Netilmicin (17) | Tobramycin (18) | Vancomycin (19) | Gentamicin A (20) | Gentamicin B (21) | |
|---|---|---|---|---|---|
| Parameter | |||||
| Objective function value | 273.659 | 1013.684 | 2740.457 | 1757.241 | 511.263 |
| Fixed effects | |||||
| CLp in CL = CLp × (bBW/median)m × (1 + n × (PNA/median)) | – | 0.067 (1.43) | 0.038 (9.24) | – | – |
| m | – | 1.31 (2.43) | 1.1 (5.72) | – | – |
| n | – | – | 0.955 (19.7) | – | – |
| CLp in CL = CLp × (bBW/median)o × (PNA/median)p | 0.063 (5.92) | – | – | 0.097 (1.5) | 0.046 (4.04) |
| o | 1.44 (7.57) | – | – | 1.36 (2.12) | 1.41 (4.42) |
| p | 0.481 (18.5) | – | – | 0.458 (8.78) | 0.371 (8.36) |
| Vp in V1 = Vp × (cBW/median)q | 0.65 (7.14) | 0.926 (1.45) | 0.618 (2.85) | 1.07 (2.3) | 0.508 (1.74) |
| q | 1 (13.4) | 0.859 (3.41) | 0.952 (8.21) | 0.807 (5.29) | 0.848 (3.27) |
| Q = r × CL | – | – | – | – | 0.688 (12.1) |
| Q = CL | Q = CL | – | Q = CL | Q = CL | – |
| V2 = s | – | – | – | – | 0.846 (25.9) |
| V2 = V1 | V2 = V1 | – | V2 = V1 | V2 = V1 | – |
| Interindividual variability | |||||
| ω2 (CL) | 0.188 (32.1) | 0.065(10.4) | 0.103 (12.5) | 0.102 (13.4) | 0.0357 (22.1) |
| Residual variability | |||||
| σ2 (proportional) | 0.114 (17.9) | 0.0439 (9.16) | 0.0938 (7.64) | 0.0776 (9.27) | 0.0465 (8.65) |
CLp population value for clearance, Vp population value for volume of distribution of the central compartment, bBW bodyweight at birth, cBW current bodyweight, PNA postnatal age, Q intercompartmental clearance, V2 volume of distribution of the peripheral compartment
Comparison of the Models Using the Amikacin Covariate Model and Independent Reference Models
In Fig. 2, observed versus population predicted concentrations are shown for the models using the amikacin covariate model as well as the independent reference models. Visual examination of the plots shows that both the models using the amikacin covariate model as well as the independent reference models are able to predict the observed concentrations and that the difference in performance of the two approaches is negligible. In Fig. 5 the individual and population clearance values for the models using the amikacin covariate model are plotted versus those of the independent reference models of the different datasets. While both approaches estimate similar individual and population clearance values for netilmicin, tobramycin, gentamicin A and gentamicin B, a slight difference in population clearance values is seen for vancomycin, a drug with slightly different physicochemical and pharmacokinetic drug properties compared to amikacin and the other drugs. In Fig. 6, the population clearance values obtained using both approaches are plotted versus birth bodyweight for PNA 1, 14 and 28 days. To obtain the clearance values for the models using the amikacin covariate model, the full study range of the amikacin dataset was used while for the independent reference models, the study range available for that particular dataset was applied, explaining the differences seen in the length of both lines illustrating the population clearance values using both approaches. Based on this figure, it was concluded that at day of birth (day 1) and 14 days similar clearance values are obtained for both approaches for all drugs, while at day 28, a slight difference is seen for vancomycin and gentamicin B. For tobramycin it should be noted that no population clearance values are illustrated following the independent reference model for day 14 and 28 since this model is based on the original dataset which only included data during the first 4 days after birth. When plotting the individual and population predicted parameters against the most predictive covariate for both approaches, it was observed that the individual predicted parameters were equally distributed around the population parameters. Finally, when considering the differences in objective function values between the models using the amikacin covariate model and the reference models (Tables II and III), it was seen that the reference models of netilmicin, vancomycin, and gentamicin A and B had a lower objective function value (Δ objective function value: netilmicin 5 points, vancomycin 23 points, gentamicin A 67 points, gentamicin B 59 points) as compared to the models using the amikacin covariate model. For tobramycin, the objective function value of the reference model was 43 points higher compared to the model using the amikacin covariate model, which can be explained by the use of a one compartment reference model versus a two compartment model using the amikacin covariate model. Furthermore, Tables II and III show that the coefficients of variation of both fixed and random effects are well below 50% indicating that both approaches are able to estimate the parameters with high precision. Moreover, no ill-conditioning was detected in the models using both approaches since the condition number of the final pharmacokinetic models (range 2.23–64.44) was far below the critical value of 1,000. Finally, η-shrinkage expressed as a percentage was identified to be below 20% for all final pharmacokinetic models using both approaches.
Fig. 5.

Individual and population predicted clearances for the models using the amikacin covariate model versus the independent reference models for netilmicin, vancomycin, tobramycin, gentamicin dataset A and gentamicin dataset B.
Fig. 6.

Population clearance values for the models using the amikacin covariate model (black) and the independent reference models (dotted line) versus birth bodyweight for PNA 1 (above), 14 (middle) and 28 days (below) for netilmicin, vancomycin, tobramycin, gentamicin A and gentamicin B. For the clearance values obtained with the amikacin covariate model, the full study range of the amikacin dataset is used while for the independent reference models, the study range available for that particular dataset is used causing the differences seen in the length of both lines illustrating the population clearance values using both approaches. Moreover for tobramycin, no clearance values for to the independent reference model could be illustrated for PNA 14 and 28 days since no data were available.
Results of the bootstrap analysis showed that the median estimated values based on re-sampled data were close (<20%) to the estimated values of the final models using the amikacin covariate model and independent reference models. This suggests that the final models using the amikacin covariate model and the independent reference models are stable and that the estimated parameter values are precise.
Considering the predictive performance, both the models using the amikacin covariate model as well as the independent reference models perform similar since both approaches can accurately predict the overall median concentrations. In addition, there was no bias in the normalized prediction distribution errors over time, nor over the predicted concentration range.
DISCUSSION
To facilitate the development and availability of drugs in children and to avoid the development and validation of PK/PD models for each new or existing drug, new approaches are needed. Therefore the aim of the current study was to evaluate whether the internally and externally validated covariate model of amikacin in (pre)term neonates (16) can be extrapolated to other drugs eliminated through glomerular filtration in neonates. This implicates that pediatric covariate models also contain biological system-specific information reflecting underlying physiological changes (13–15). To test this hypothesis the covariate model of amikacin was directly incorporated in the pharmacokinetic model for netilmicin, vancomycin, tobramycin, gentamicin A and gentamicin B, drugs that, like amikacin are almost entirely eliminated through glomerular filtration. Using this approach a distinction is being made between drug-specific and system-specific information as explained in the “Materials and Methods” section in which the pediatric covariate model is considered system-specific while the population values are considered to be drug-specific. Subsequently the descriptive and predictive performance of models using the amikacin covariate model was compared to the independent reference models in which the covariate model was identified using a systematic covariate analysis (14,22).
To extrapolate information from one drug to another a few requirements need to be met (14). First of all it is a prerequisite that the covariate models, which are assumed to contain system-specific information, are extensively validated. In this analysis the covariate model, developed to describe the pharmacokinetics of amikacin, was based on the analysis of 2,186 amikacin samples in 874 (pre)term neonates. The covariate model was both internally and externally validated (16). Furthermore, it is important that the covariate models which are extrapolated to other drugs, are based on a considerable number of samples from a large patient cohort with varying characteristics such as gestational age, birth bodyweight and postnatal age. In addition, it should be emphasized that the covariate models can only be extrapolated to populations with clinical characteristics that are within the studied range of the applied covariate model. In this analysis the amikacin covariate model developed for (pre)term neonates between 1 and 30 days was extrapolated to five other datasets in which the clinical characteristics are similar compared to the amikacin dataset considering bodyweight and age range (Table I). Finally, a similar disease status was seen between the patients used for development of amikacin covariate model and the patients collected for the analysis of the unstudied drugs since all patients were admitted to the neonatal intensive care unit. When all the mentioned requirements are fulfilled, model development of the unstudied drugs (netilmicin, vancomycin, tobramycin and gentamicin) may be based on an even more limited number of data which is by all means a major advantage in the design and sampling strategy of (pediatric) clinical trials since the number of patients and the burden for patients participating in the trial can be reduced. However a limited amount of data still needs to be available to estimate the population parameter values for each drug as these are considered to be drug-specific parameters (see “Covariate Model” section under “Materials and Methods”). When all the above mentioned requirements are fulfilled, an advantage of utmost importance is seen in the time required to develop and validate models using a covariate model which already has been extensively validated (weeks) compared to reference models (months).
The descriptive and predictive performance of the models using the amikacin covariate model was confirmed by Figs. 2, 3 and 4. This suggests that the covariate model of amikacin may contain system-specific information on the developmental changes in glomerular filtration. In an analysis of Krekels et al. (14), the same concept was applicable since it was illustrated that the covariate model for the glucuronidation of morphine in (pre)term neonates to children up to 3 years of age was able to describe the developmental changes in the glucuronidation of zidovudine in term neonates and infants. Although similar individual and population clearance values are predicted by both approaches as seen in Fig. 5, a slight difference is seen in population clearance values of vancomycin and gentamicin B between the reference model and the model using the amikacin covariate model for the higher population values for clearance. This is also reflected in Fig. 6 in which this slight difference was seen between the clearance values for vancomycin and gentamicin B following both approaches at day 28. It is however unknown which of the two approaches best reflects the true clearance of these drugs. For gentamicin B, it should be noted that this difference seen in the higher clearance values of both approaches is only based on a limited number of data. Considering vancomycin, it is possible that the population clearance values predicted by the reference model are slightly different because this model is only based on vancomycin data from preterm neonates (Table I). This limitation in information is less important in the model using the amikacin covariate model in which missing information is supplemented by information gained from the amikacin covariate model. The slight difference in population clearance values between the two approaches can also indicate that although vancomycin is mainly eliminated by glomerular filtration, the elimination of vancomycin may be modified by the presence of tubular processes (secretion or reabsorption) (31), which is not captured by the amikacin model. Finally, the difference may also be due to the different physicochemical properties of vancomycin compared to the other drugs, because in contrast to netilmicin, tobramycin and gentamicin, drugs that belong to the same class as amikacin, namely the aminoglycosides, vancomycin is a tricyclic glycopeptide. Besides the large difference in molecular mass of vancomycin (1449.3 g/mol) compared to amikacin (585.603 g/mol), netilmicin (475.58 g/mol), tobramycin (467.515 g/mol) and gentamicin (477.596 g/mol), the difference between the two drugs classes is also reflected in the protein binding. For the aminoglycosides the protein binding is below 10% in adults while this is much higher (approximately 55%) for the glycopeptide vancomycin. For antibiotics with a higher protein binding a lower renal clearance is often seen since only free drug is eliminated through the renal function (32).
In this analysis, the amikacin covariate model was in a first step extrapolated to drugs which are also almost entirely eliminated through GFR and with similar physicochemical properties compared to amikacin. However the majority of the drugs is eliminated by different elimination routes (hepatic and renal elimination). Therefore in a future analysis, the extension of the amikacin covariate model will be evaluated as well as the exact influence of differences in physicochemical and pharmacokinetic drug properties on the extrapolation of the amikacin covariate model to other drugs which are eliminated by different routes. To analyze this, a future analysis needs to be performed as done by Krekels et al. (15). In that analysis the exact influence of differences in physiochemical properties on the extrapolation potential of the glucuronidation function was examined by using a physiological based (PBPK) modeling approach. Finally it will also be evaluated whether it is possible to characterize developmental changes in tubular processes in preterm and term based on the amikacin covariate model describing the developmental changes in GFR. A combination of all these different strategies (extrapolation to other drugs, adult data or non-clinical data) (33–35) will result in an approach focusing on the underlying system instead of focusing on the drugs and may facilitate development of pharmacokinetic models and evidence-based dosing regimens in the pediatric population.
CONCLUSIONS
In this study it was demonstrated that the descriptive and predictive performance of the models using the amikacin covariate model was similar to the independent reference models. This indicates that the use of system-specific information from one drug to other drugs may lead to optimization of sparse data analysis in children and that the covariate model, which in this case is describing the developmental changes in GFR, can be used to evaluate and optimize study and sampling design. As a consequence, the covariate model may play an important role to determine first-in-child dosing strategies and evidence-based dosing regimens of new and existing drugs.
Supplementary Material
Acknowledgments
This study was performed within the framework of Top Institute Pharma project number D2-104. The clinical research of Karel Allegaert is supported by the Fund for Scientific Research, Flanders (Clinical Fellowship 1800214N) and has been supported by an IWT-SBO project (130033). The clinical research of J. van den Anker is supported by NIH grants (R01HD060543, K24DA027992, R01HD048689, U54HD071601) and FP7 grants TINN (223614), TINN2 (260908), NEUROSIS (223060), and GRIP (261060). The authors also would like to thank LAP&P Consultants for their technical support with NONMEM.
ABBREVIATIONS
- bBW
Birth bodyweight
- cBW
Current bodyweight
- GFR
Glomerular filtration rate
- NPDE
Normalized prediction distribution error method
- PD
Pharmacodynamics
- PK
Pharmacokinetics
- PNA
Postnatal age
Footnotes
Electronic supplementary material The online version of this article, (doi:10.1007/s11095-013-1197-y) contains supplementary material, which is available to authorized users.
Contributor Information
Roosmarijn F. W. De Cock, Division of Pharmacology, LACDR, Leiden University Leiden, The Netherlands
Karel Allegaert, Neonatal Intensive Care Unit, University Hospital Leuven Leuven, Belgium.
Catherine M. T. Sherwin, Division of Clinical Pharmacology & Clinical Trials Office, Department of Pediatrics, University of Utah School of Medicine, Salt Lake City, Utah, USA
Elisabet I. Nielsen, Department of Pharmaceutical Biosciences, Uppsala University, Uppsala, Sweden
Matthijs de Hoog, Intensive Care and Department of Pediatric Surgery, Erasmus MC - Sophia Children’s Hospital, Rotterdam, The Netherlands.
Johannes N. van den Anker, Intensive Care and Department of Pediatric Surgery, Erasmus MC - Sophia Children’s Hospital, Rotterdam, The Netherlands. Division of Pediatric Clinical Pharmacology, Children’s National Medical Center, Washington, District of Colombia, USA
Meindert Danhof, Division of Pharmacology, LACDR, Leiden University, Leiden, The Netherlands.
Catherijne A. J. Knibbe, Department of Clinical Pharmacy, St. Antonius Hospital, P.O. Box 2500, 3430 EM Nieuwegein, The Netherlands. Division of Pharmacology, LACDR, Leiden University Leiden, The Netherlands
References
- 1.Cuzzolin L, Atzei A, Fanos V. Off-label and unlicensed prescribing for newborns and children in different settings: a review of the literature and a consideration about drug safety. Expert Opin Drug Saf. 2006;5(5):703–18. doi: 10.1517/14740338.5.5.703. [DOI] [PubMed] [Google Scholar]
- 2.‘t Jong GW, Vulto AG, de Hoog M, Schimmel KJ, Tibboel D, van den Anker JN. A survey of the use of off-label and unlicensed drugs in a Dutch children’s hospital. Pediatrics. 2001;108(5):1089–93. doi: 10.1542/peds.108.5.1089. [DOI] [PubMed] [Google Scholar]
- 3.Conroy S, Choonara I, Impicciatore P, Mohn A, Arnell H, Rane A, et al. Survey of unlicensed and off label drug use in paediatric wards in European countries. European Network for Drug Investigation in Children. BMJ. 2000;320(7227):79–82. doi: 10.1136/bmj.320.7227.79. [DOI] [PMC free article] [PubMed] [Google Scholar]
- 4.De Cock RF, Piana C, Krekels EH, Danhof M, Allegaert K, Knibbe CA. The role of population PK-PD modelling in paediatric clinical research. Eur J Clin Pharmacol. 2011;67(Suppl 1):5–16. doi: 10.1007/s00228-009-0782-9. [DOI] [PMC free article] [PubMed] [Google Scholar]
- 5.Ince I, de Wildt SN, Tibboel D, Danhof M, Knibbe CA. Tailor-made drug treatment for children: creation of an infrastructure for data-sharing and population PK-PD modeling. Drug Discov Today. 2009;14(5–6):316–20. doi: 10.1016/j.drudis.2008.11.004. [DOI] [PubMed] [Google Scholar]
- 6.FDA C. Guidance for industry. [20 February 2013];General considerations for pediatric pharmacokinetic studies for drugs and biological products (Draft Guidance) 1998 Available from: http://www.fda.gov/downloads/Drugs/GuidanceComplianceRegulatoryInformation/Guidances/ucm072114.pdf.
- 7.FDA C. Guidance for industry. Population pharmacokinetics. 1999 Available from: http://www.fda.gov/downloads/Drugs/GuidanceComplianceRegulatoryInformation/Guidances/ucm072137.pdf.
- 8.Tod M, Jullien V, Pons G. Facilitation of drug evaluation in children by population methods and modelling. Clin Pharmacokinet. 2008;47(4):231–43. doi: 10.2165/00003088-200847040-00002. [DOI] [PubMed] [Google Scholar]
- 9.Smits A, Kulo A, de Hoon JN, Allegaert K. Pharmacokinetics of drugs in neonates: pattern recognition beyond compound specific observations. Curr Pharm Des. 2012;18(21):3119–46. doi: 10.2174/1381612811209023119. [DOI] [PubMed] [Google Scholar]
- 10.Manolis E, Osman TE, Herold R, Koenig F, Tomasi P, Vamvakas S, et al. Role of modeling and simulation in pediatric investigation plans. Paediatr Anaesth. 2011;21(3):214–21. doi: 10.1111/j.1460-9592.2011.03523.x. [DOI] [PubMed] [Google Scholar]
- 11.Bellanti F, Della Pasqua O. Modelling and simulation as research tools in paediatric drug development. Eur J Clin Pharmacol. 2011;67(Suppl 1):75–86. doi: 10.1007/s00228-010-0974-3. [DOI] [PMC free article] [PubMed] [Google Scholar]
- 12.Johnson TN. Modelling approaches to dose estimation in children. Br J Clin Pharmacol. 2005;59(6):663–9. doi: 10.1111/j.1365-2125.2005.02429.x. [DOI] [PMC free article] [PubMed] [Google Scholar]
- 13.Knibbe CA, Krekels EH, Danhof M. Advances in paediatric pharmacokinetics. Expert Opin Drug Metab Toxicol. 2011;7(1):1–8. doi: 10.1517/17425255.2011.539201. [DOI] [PubMed] [Google Scholar]
- 14.Krekels EHJ, Neely M, Panoilia E, Tibboel D, Capparelli E, Danhof M, et al. From pediatric covariate model to semiphysiological function for maturation: part I—extrapolation of a covariate model from morphine to zidovudine. CPT: Pharmacometrics & Systems Pharmacology. 2012;1:e9. doi: 10.1038/psp201211. Published online 3 October 2012. [DOI] [PMC free article] [PubMed] [Google Scholar]
- 15.Krekels EHJ, Johnson TN, den Hoedt SM, Rostami-Hodjegan A, Danhof M, Tibboel D, et al. From pediatric covariate model to semiphysiological function for maturation: part II—sensitivity to physiological and physicochemical properties. CPT: Pharmacometrics & Systems Pharmacology. 2012;1:e10. doi: 10.1038/psp201212. Published online 10 October 2012. [DOI] [PMC free article] [PubMed] [Google Scholar]
- 16.De Cock RF, Allegaert K, Schreuder MF, Sherwin CM, de Hoog M, van den Anker JN, et al. Maturation of the glomerular filtration rate in neonates, as reflected by amikacin clearance. Clin Pharmacokinet. 2012;51(2):105–17. doi: 10.2165/11595640-000000000-00000. [DOI] [PubMed] [Google Scholar]
- 17.Sherwin CM, Broadbent RS, Medlicott NJ, Reith DM. Individualising netilmicin dosing in neonates. Eur J Clin Pharmacol. 2008;64(12):1201–8. doi: 10.1007/s00228-008-0536-0. [DOI] [PubMed] [Google Scholar]
- 18.de Hoog M, Schoemaker RC, Mouton JW, van den Anker JN. Tobramycin population pharmacokinetics in neonates. Clin Pharmacol Ther. 1997;62(4):392–9. doi: 10.1016/S0009-9236(97)90117-X. [DOI] [PubMed] [Google Scholar]
- 19.Allegaert K, Anderson BJ, van den Anker JN, Vanhaesebrouck S, de Zegher F. Renal drug clearance in preterm neonates: relation to prenatal growth. Ther Drug Monit. 2007;29(3):284–91. doi: 10.1097/FTD.0b013e31806db3f5. [DOI] [PubMed] [Google Scholar]
- 20.Sherwin CM, McCaffrey F, Broadbent RS, Reith DM, Medlicott NJ. Discrepancies between predicted and observed rates of intravenous gentamicin delivery for neonates. J Pharm Pharmacol. 2009;61(4):465–71. doi: 10.1211/jpp/61.04.0008. [DOI] [PubMed] [Google Scholar]
- 21.Nielsen EI, Sandstrom M, Honore PH, Ewald U, Friberg LE. Developmental pharmacokinetics of gentamicin in preterm and term neonates: population modelling of a prospective study. Clin Pharmacokinet. 2009;48(4):253–63. doi: 10.2165/00003088-200948040-00003. [DOI] [PubMed] [Google Scholar]
- 22.Krekels EH, van Hasselt JG, Tibboel D, Danhof M, Knibbe CA. Systematic evaluation of the descriptive and predictive performance of paediatric morphine population models. Pharm Res. 2011;28(4):797–811. doi: 10.1007/s11095-010-0333-1. [DOI] [PMC free article] [PubMed] [Google Scholar]
- 23.Montgomery DC, Peck EA. Introduction to linear regression analysis. New York: Wiley; 1982. pp. 301–2. [Google Scholar]
- 24.Karlsson MO, Savic RM. Diagnosing model diagnostics. Clin Pharmacol Ther. 2007;82(1):17–20. doi: 10.1038/sj.clpt.6100241. [DOI] [PubMed] [Google Scholar]
- 25.Allegaert K. The impact of ibuprofen or indomethacin on renal drug clearance in neonates. J Matern Fetal Neonatal Med. 2009;22(Suppl 3):88–91. doi: 10.1080/14767050903180965. [DOI] [PubMed] [Google Scholar]
- 26.Capparelli EV, Lane JR, Romanowski GL, McFeely EJ, Murray W, Sousa P, et al. The influences of renal function and maturation on vancomycin elimination in newborns and infants. J Clin Pharmacol. 2001;41(9):927–34. doi: 10.1177/00912700122010898. [DOI] [PubMed] [Google Scholar]
- 27.Bartelink IH, Rademaker CM, Schobben AF, van den Anker JN. Guidelines on paediatric dosing on the basis of developmental physiology and pharmacokinetic considerations. Clin Pharmacokinet. 2006;45(11):1077–97. doi: 10.2165/00003088-200645110-00003. [DOI] [PubMed] [Google Scholar]
- 28.George I, Mekahli D, Rayyan M, Levtchenko E, Allegaert K. Postnatal trends in creatinemia and its covariates in extremely low birth weight (ELBW) neonates. Pediatr Nephrol. 2011;26(10):1843–9. doi: 10.1007/s00467-011-1883-0. [DOI] [PubMed] [Google Scholar]
- 29.Brendel K, Dartois C, Comets E, Lemenuel-Diot A, Laveille C, Tranchand B, et al. Are population pharmacokinetic and/or pharmacodynamic models adequately evaluated? A survey of the literature from 2002 to 2004. Clin Pharmacokinet. 2007;46(3):221–34. doi: 10.2165/00003088-200746030-00003. [DOI] [PMC free article] [PubMed] [Google Scholar]
- 30.Comets E, Brendel K, Mentre F. Computing normalised prediction distribution errors to evaluate nonlinear mixed-effect models: the npde add-on package for R. Comput Methods Prog Biomed. 2008;90(2):154–66. doi: 10.1016/j.cmpb.2007.12.002. [DOI] [PubMed] [Google Scholar]
- 31.Pacifici GM, Allegaert K. Clinical pharmacokinetics of vancomycin in the neonate: a review. Clinics (Sao Paulo) 2012;67(7):831–7. doi: 10.6061/clinics/2012(07)21. [DOI] [PMC free article] [PubMed] [Google Scholar]
- 32.Kimura T, Sunakawa K, Matsuura N, Kubo H, Shimada S, Yago K. Population pharmacokinetics of arbekacin, vancomycin, and panipenem in neonates. Antimicrob Agents Chemother. 2004;48(4):1159–67. doi: 10.1128/AAC.48.4.1159-1167.2004. [DOI] [PMC free article] [PubMed] [Google Scholar]
- 33.Jamei M, Dickinson GL, Rostami-Hodjegan A. A framework for assessing interindividual variability in pharmacokinetics using virtual human populations and integrating general knowledge of physical chemistry, biology, anatomy, physiology and genetics: a tale of ‘bottom-up’ vs ‘top-down’ recognition of covariates. Drug Metab Pharmacokinet. 2009;24(1):53–75. doi: 10.2133/dmpk.24.53. [DOI] [PubMed] [Google Scholar]
- 34.Johnson TN, Rostami-Hodjegan A. Resurgence in the use of physiologically based pharmacokinetic models in pediatric clinical pharmacology: parallel shift in incorporating the knowledge of biological elements and increased applicability to drug development and clinical practice. Paediatr Anaesth. 2011;21(3):291–301. doi: 10.1111/j.1460-9592.2010.03323.x. [DOI] [PubMed] [Google Scholar]
- 35.Allegaert K, Smits A, van den Anker JN. Physiologically based pharmacokinetic modeling in pediatric drug development: a clinician’s request for a more integrated approach. J Biomed Biotechnol. 2012:103763. doi: 10.1155/2012/103763. [DOI] [PMC free article] [PubMed] [Google Scholar]
Associated Data
This section collects any data citations, data availability statements, or supplementary materials included in this article.