Abstract
Photon-counting computed tomography (PCCT) uses a photon counting detector to count individual photons and allocate them to specific energy bins by comparing photon energy to preset thresholds. This enables simultaneous multi-energy CT with a single source and detector. Phantom studies were performed to assess the spectral performance of a research PCCT scanner by assessing the accuracy of derived images sets. Specifically, we assessed the accuracy of iodine quantification in iodine map images and of CT number accuracy in virtual monoenergetic images (VMI). Vials containing iodine with 5 known concentrations were scanned on the PCCT scanner after being placed in phantoms representing the attenuation of different size patients. For comparison, the same vials and phantoms were also scanned on 2nd and 3rd generation dual-source, dual-energy (DSDE) scanners. After material decomposition, iodine maps were generated, from which iodine concentration was measured for each vial and phantom size and compared with the known concentration. Additionally, VMIs were generated and CT number accuracy was compared to the reference standard, which was calculated based on known iodine concentration and attenuation coefficients at each keV obtained from the U.S. National Institute of Standards and Technology. Results showed accurate iodine quantification (root mean square error of 0.5 mgI/cc) and accurate CT number of VMIs (percentage error of 8.9%) using the PCCT scanner. The overall performance of the PCCT scanner, in terms of iodine quantification and VMI CT number accuracy, was comparable to that of EID-based dual-source, dual-energy scanners.
Keywords: Photon counting detector, Multi-energy CT, Iodine quantification, Virtual Monoenergetic Images, CT number accuracy
1 Introduction
Photon counting detector (PCD) based computed tomography (PCCT) is an emerging imaging technique and substantial progress has been reported in recent years by different researchers (Tümer et al., 2000, Schlomka et al., 2008, Shikhaliev, 2008b, Shikhaliev, 2008a, Iwanczyk et al., 2009, Kappler et al., 2010, Taguchi and Iwanczyk, 2013, Persson et al., 2014, Bennett et al., 2014, Roessl and Proksa, 2007, Ballabriga et al., 2016). PCDs measure individual photons and their associated energy, rather than the integrated charges generated by all measured photons, as occurs with an energy-integrating detector (EID). This provides unique benefits compared to EIDs, including lower electronic noise, higher contrast to noise ratio (CNR) and improved dose efficiency, as demonstrated in recent studies (Schmidt, 2010, Gutjahr et al., 2016, Yu et al., 2016b). In addition, the energy discrimination nature of the PCD enables a simultaneous multi-energy imaging technique using a single tube, single tube potential (kV), and single detector (Roessl and Proksa, 2007, Schlomka et al., 2008, Kappler et al., 2014, Li et al., 2015, Faby et al., 2015).
A research PCCT scanner has been introduced to explore the benefit of photon counting detector CT (Kappler et al., 2010). Previous studies using this scanner demonstrated that the PCCT was capable of providing clinical image quality at X-ray photon flux encountered in routine CT exams, which were commensurate with commercial EID systems (Yu et al., 2016a, Pourmorteza et al., 2016). Benefits of this specific PCCT scanner over the state-of-the-art CT scanner using EIDs have been previously demonstrated and include improved CNR, increased spatial resolution, and better HU stability at low dose (Gutjahr et al., 2016, Leng et al., 2017, Symons et al., 2016). These studies, however, focused only on traditional image quality in a single-energy mode, i.e. only the images pertaining to the lowest energy threshold were evaluated. This present study continued the investigation of this specific PCCT system by focusing on its spectral performance.
Dual energy CT has been commercially available using various techniques including dual source, fast kV switching, dual layer detector, dual filters, and two consecutive scans (McCollough et al., 2015, Flohr et al., 2006, Xu et al., 2009, Boll et al., 2008, Almeida et al., 2016, Leng et al., 2015a). With dual energy CT, two measurements of the imaging objects acquired with different beam spectra enable differentiation and quantification of two or more materials based on the energy dependence of each material (Alvarez and Macovski, 1976). For example, a patient image can be decomposed into iodine and water images and the amount of iodine at each location can be quantified (Johnson et al., 2007, Chandarana et al., 2011, Li et al., 2013). Another common application of dual energy CT is to generate virtual monoenergetic images (VMI) (Goodsitt et al., 2011, Matsumoto et al., 2011, Yu et al., 2011, Yu et al., 2012). Applications of VMI include increased iodine CNR using low keV images or reduction of metal artifact with high keV images (Yu et al., 2011, Zhang et al., 2011, Leng et al., 2015b, Pinho et al., 2013). Since CT number is energy dependent and conventional CT uses a broad spectrum, CT numbers of the same material can vary substantially among scanner models and vendors due to the differences in beam spectra caused by tube potential, anode material, and beam filtration. In VMI, the CT number of a given material has a predetermined value at a given X-ray energy (keV) which, in theory, should be independent of manufacturer and scanner model. This allows for comparison across manufacturers and scanners, which may benefit clinical applications that require accurate and stable CT numbers (Michalak et al., 2016). However, previous studies showed that the VMI CT numbers can be inaccurate, with substantial variations among different scanners (Goodsitt et al., 2011, Mileto et al., 2015).
The purpose of this study, therefore, is to assess the spectral performance of a research photon counting detector CT scanner in terms of iodine quantification accuracy and VMI CT number accuracy, and to compare the performance with that of dual-source, dual-energy (DSDE) CT scanners with EIDs.
2 Methods
2.1 Research Photon-Counting Detector CT System
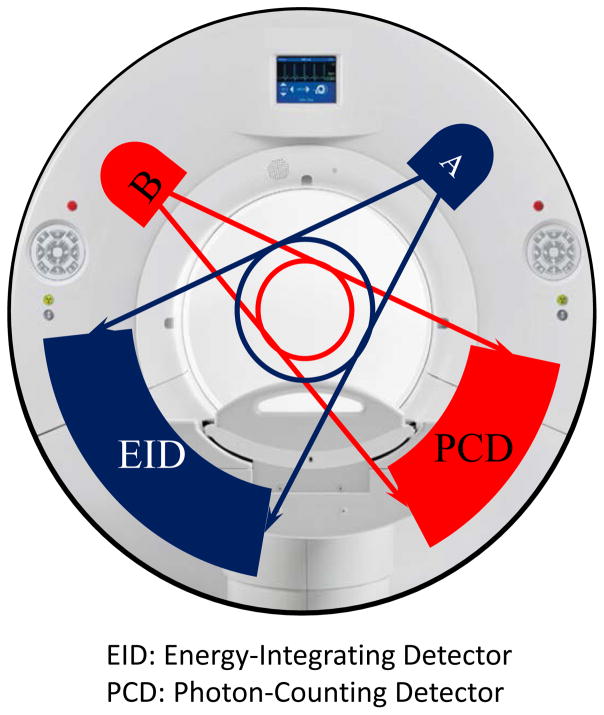
The evaluated research PCCT scanner was built on the same platform as that of a 2nd generation dual-source CT scanner, with two equivalent X-ray tubes mounted approximately 95 degrees from each other. One tube was coupled to an EID with a full 50-cm diameter field of view (FOV), while the other was coupled to a CdTe-based PCD with a 27.5 cm diameter FOV (Fig. 1). To image patients larger than 27.5 cm on the PCD subsystem, a data completion scan (DCS) is used to avoid truncation artifacts (Yu et al., 2016c). In addition to the PCD scan, an additional scan of the target object is performed using the EID subsystem with 50 cm FOV, which is called a DCS scan. The DCS data are used to estimate the missing projection data outside the 27.5 cm FOV of the PCD subsystem so that a complete set of projection data are available to avoid truncation artifacts. The estimated PCD projection data are only used during the ramp filtering step to avoid truncation artifacts, but are not used in the backprojection step (Yu et al., 2016c). A previous study demonstrated that a low dose scan with a volume CT dose index (CTDIvol) of approximately 1 mGy was sufficient for the DCS scan (Yu et al., 2016c).
Figure 1.
The research PCCT scanner was built on the platform of a 2nd generation dual source scanner with an energy integrating detector (EID) replaced by a photon counting detector (PCD).
The PCD subsystem is capable of acquiring energy resolved data with 2 or 4 energy thresholds, consequently yielding 2 or 4 energy bins by subtracting photon counts from the adjacent thresholds. The native pixel size of the PCD is 0.225 mm. However, they are usually grouped as 4×4 blocks (macro pixel) during readout behind the discriminators, which results in 0.9 mm detector pixel size, which corresponds to an effective pixel size of 0.5 mm at the iso-center. There is no anti charge sharing technique in the evaluated system. The PCD subsystem is able to perform whole-body CT scans at clinical dose levels, with a maximal tube current of 550 mA at a tube potential of 140 kV. Detailed descriptions of the research PCCT system and its conventional CT performance can be found in other publications (Gutjahr et al., 2016, Kappler et al., 2010, Yu et al., 2016a).
2.2 Phantom Scans and Reconstructions
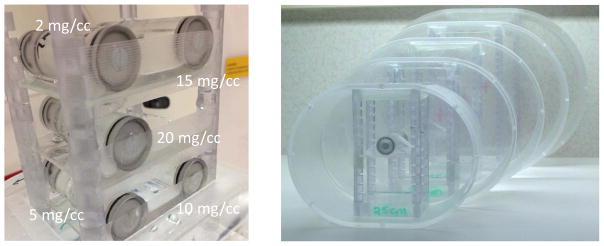
Iodinated contrast media (Iohexol, 350mgI/ml, Omnipaque; GE Healthcare, Shanghai, China) was diluted with water to achieve 5 iodine concentrations similar to those commonly seen in clinical exams: 2, 5, 10, 15 and 20 mgI/cc. The iodine solutions were placed in individual vials, which were placed in torso-shaped water phantoms that mimicked the attenuation of a patient torso. Five phantoms with lateral widths measuring 25, 30, 35, 40 and 45 cm were used in this study to represent slim to obese adult patients, respectively (Fig. 2).
Figure 2.
Vials containing different iodine solutions (left) were placed inside water phantoms representing patient torso with different sizes (right).
The iodine-containing phantoms were scanned on the PCCT scanner with the following parameters: tube potential of 140 kV, energy thresholds of 25 and 65 keV, rotation time of 0.5 second per revolution, and helical pitch of 0.6. The current research PCCT scanner is not equipped with automatic exposure control. Tube current was manually adjusted base on each phantom size so that the tube-current-time-product ranged from 82 mAs (25 cm phantom) to 282 mAs (45 cm phantom), resulting in CTDIvol of 9.14 (25 cm phantom) to 42.92 mGy (45 cm phantom). Images were reconstructed with a weighted filtered backprojection algorithm and a quantitative, medium-smooth kernel (D30) (Stierstorfer et al., 2004). The kernel is designed for dual energy analysis with no edge enhancement so that accurate CT number is achieved. This kernel is routinely used in clinical dual energy exams. The reconstructed field of view was 250 mm. The slice thickness was 5mm, the same as that of our routine abdomen CT exams.
For comparison, the same phantoms were also scanned on a 2nd and 3rd generation dual-source dual-energy (DSDE) scanner (Somatom Definition Flash and Force, Siemens Healthcare, Forchheim, Germany). Two dual energy modes on the 2nd generation DSDE scanner were used: 80/Sn140 and 100/Sn140, where Sn indicates an additional tin filter is used for the 140 kV beam. Four dual energy modes on the 3rd generation DSDE scanner were used: 70/Sn150kV, 80/Sn150kV, 90/Sn150kV, and 100/Sn150kV. Tube current was adjusted so that the CTDIvol for each phantom size and DSDE mode was matched to that of the PCCT scanner. Images were reconstructed using the same parameters as those of the PCCT scanner: a quantitative, medium-smooth kernel (D30), 250 mm field of view, and 5 mm slice thickness.
2.3 Data Processing and Data Analysis
2.3.1 Iodine Quantification
The reconstructed images were loaded onto a workstation with commercial dual energy post-processing software (Syngo Via, Siemens Healthcare, Forchheim, Germany). A ‘virtual unenhanced’ application was used to decompose the original low and high energy images into water and iodine images, with the latter providing the concentration of iodinated contrast (in mgI/cc) at each location. For each imaging condition, the largest possible circular region of interest (ROI) without touching the wall of the vials was drawn to measure the concentration of iodine in each of the 5 vials. The iodine concentration of the background (water) was also measured with a similar size ROI. This process was repeated for each scanner, dual energy mode, and phantom size.
The measured iodine concentration was compared to the known concentration for each vial, and errors calculated. A linear fit was performed and the coefficient of determination (R2) was reported. For each imaging condition (dual energy mode and scanner type), the root-mean-square-errors (RMSE) were calculated and compared across phantom size and iodine concentration.
2.3.2 Virtual Monoenergetic Image (VMI)
VMIs were generated using a ‘virtual monoenergetic’ application in the same dual energy post-processing software (Syngo Via, Siemens Healthcare, Forchheim, Germany). VMIs corresponding to 40 to 140 keV at every 10 keV were generated. For each VMI, CT number was measured for each vial using a circular ROI. This measurement was repeated for each scanner, dual energy mode, and phantom size.
A reference CT number at each keV was calculated based on the known iodine concentration and the mass attenuation coefficient obtained from the U.S. National Institute of Standards and Technology (NIST). Measured CT numbers at each keV were compared with the reference CT numbers. Percentage error was calculated for each phantom size, concentration, scanner and dual energy mode. The dependence of percentage error on phantom size and iodine concentration was investigated. Variations of VMI CT numbers among the three DE scanners for the same concentration (10mgI/cc) and keV (60 keV) were also calculated to assess the CT number accuracy across phantom size on the different scanners.
3 Results
3.1 Threshold and Bin Images
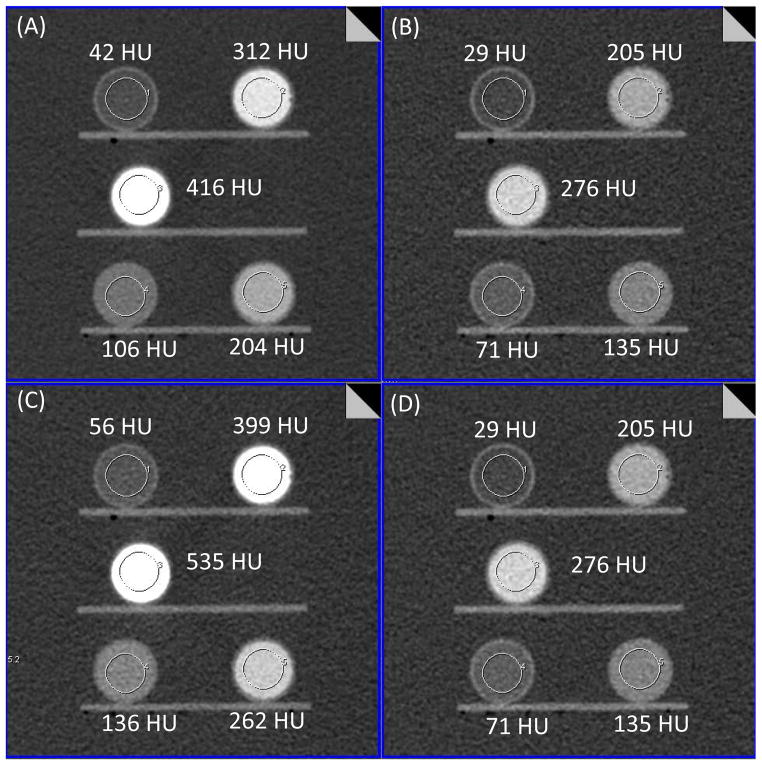
Fig. 3 shows low-energy threshold ([25, 140] keV), high-energy threshold ([65, 140] keV), bin 1 ([25, 65] keV) and bin 2 ([65, 140] keV) images of the 35 cm phantom acquired on the PCD system. High-energy threshold and bin 2 images are identical. As seen from these images, iodine signal is brighter on the low-energy threshold image compared to that of high-energy threshold image due to the lower effective energy of the photons. Similarly, iodine signal in the bin 1 image is brighter than that of the bin 2 image and low-energy threshold image.
Figure 3.
PCCT images of the low-energy threshold (A, [25, 140] keV), high-energy threshold (B, [65, 140] keV), bin 1 (C, [25, 65] keV) and bin 2 (D, [65, 140] keV). High-energy threshold and bin 2 images are identical. All images are displayed with window width and window center of 462 and 133 HU.
3.2 Iodine Quantification
Fig. 4 shows iodine, water, and fused (overlaid) images of the 35 cm phantom after material decomposition. In the iodine image, iodine signals were only at the locations corresponding to the 5 vials with iodine solutions. No noticeable signal was observed in the background (water) area. The RMSE of iodine measurement in the background area was 0.3 mgI/cc (Table 2). For the water image, iodine in the 5 vials was successfully removed, leaving only water signal behind. As shown in Fig. 4D, a linear relationship was observed between the measured and true iodine concentrations for the PCCT (R2 > 0.99). Errors between the measured and true iodine concentration ranged from −1.0 to +1.5 mgI/cc. The overall RMSE for all phantom sizes and concentrations was 0.5 mgI/cc.
Figure 4.
Iodine image (A), water image (B) and fused image (iodine overlaid on the water image, C) generated from the PCCT bin images using a material decomposition algorithm. ROIs placed at the iodine vials and water background showed measured iodine concentrations. The water image was displayed with window width and window center of 464 HU and 250 HU. Measured iodine concentration was compared to the true concentration (D).
Table 2.
RMSE of iodine quantification (mgI/cc) measured by PCCT, 2nd and 3rd generation dual source dual energy scanners for different iodine concentrations.
| Scanner | DE Mode | Iodine Concentration (mgI/cc) | |||||
|---|---|---|---|---|---|---|---|
|
| |||||||
| 0 | 2 | 5 | 10 | 15 | 20 | ||
| PCCT | [25, 65] keV | 0.3 | 0.4 | 0.6 | 0.5 | 0.9 | 0.8 |
|
| |||||||
| 2nd Gen. DS | 80/Sn140kV | 0.2 | 0.3 | 0.6 | 0.6 | 1.5 | 2.2 |
| 100/Sn140kV | 0.7 | 0.4 | 0.4 | 0.2 | 0.2 | 0.4 | |
|
| |||||||
| 3rd Gen. DS | 70/Sn150kV | 0.2 | 0.4 | 0.6 | 0.6 | 1.9 | 2.3 |
| 80/Sn150kV | 0.2 | 0.1 | 0.2 | 0.3 | 0.5 | 0.7 | |
| 90/Sn150kV | 0.2 | 0.4 | 0.1 | 0.4 | 0.4 | 0.6 | |
| 100/Sn150kV | 0.3 | 0.4 | 0.3 | 0.2 | 0.3 | 0.2 | |
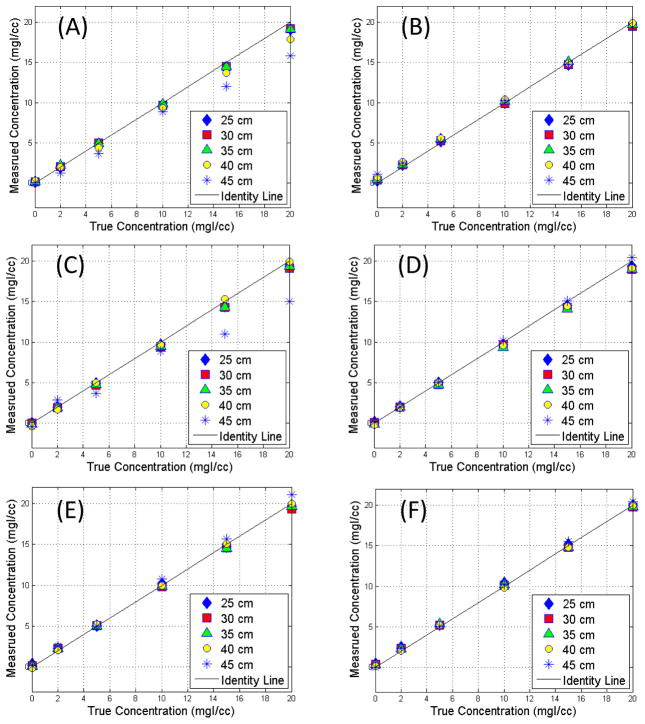
A comparison of the measured and true iodine concentrations on the 2nd and 3rd generation DSDE scanners is shown in Fig. 5. A linear relationship was observed in most DSDE modes, except for the ones with the lowest tube potential for the low energy beam (80/Sn140 and 70/Sn150 for the 2nd and 3rd generation DSDE scanner, respectively) where substantial underestimation of iodine concentration was observed for large size phantoms, where the lowest tube potential setting provided insufficient penetration of the phantom (Michalak et al., 2017 (In Press)).
Figure 5.
Comparison of measured iodine concentration versus true concentration for the 2nd generation dual source scanner with dual energy modes of 80/Sn140 (A) and 100/Sn140 (B), and 3rd generation dual source scanner with dual energy modes of 70/Sn150 (C), 80/Sn150 (D), 90/Sn150 (E), and 100/Sn150 (F).
The RMSE for each phantom size, dual energy mode, and scanner type is summarized in Table 1. Overall, all three scanners showed accurate iodine quantification, and the performance was in general comparable. The overall RMSE ranged from 0.3 to 0.7 mgI/cc. In general, accuracy slightly decreased for larger phantoms. For PCCT, the lowest RMSE of 0.2 mgI/cc was observed on the 25 cm phantom and the highest RMSE of 0.8 mgI/cc was observed on the 40 cm phantom. For the 2nd generation DSDE scanner, RMSE increased for the 40 and 45 cm phantoms when 80/Sn140 kV was used. For 3rd generation DSDE scanner, RMSE of the 45 cm phantom and 70/Sn150 kV was noticeably higher. Tables 2 and 3 summarize the quantification errors for each iodine concentration, with Table 2 showing the absolute error in terms of RMSE, and Table 3 showing the relative error in terms of percentage error. As seen in Table 2, increased RMSE was observed towards high concentrations of iodine for the PCCT, 80/Sn140 kV on the 2nd generation DSDE, and 70/Sn150 kV and 80/Sn150 kV on the 3rd generation DSDE. The remaining DSDE modes had similar RMSE for different iodine concentrations. For the background water, which had no iodine, the RMSE ranged from 0.2 to 0.7 mgI/cc. In terms of relative error, the highest percentage errors were seen at the 2 mgI/cc concentration for all DE modes (Table 3).
Table 1.
RMSE of iodine quantification (mgI/cc) measured by PCCT, 2nd and 3rd generation dual source dual energy scanners for different phantom sizes (cm).
| Scanner Model | DE Mode | 25 cm | 30 cm | 35 cm | 40 cm | 45 cm | All Sizes |
|---|---|---|---|---|---|---|---|
| PCCT | [25, 65] keV | 0.2 | 0.4 | 0.6 | 0.8 | 0.5 | 0.5 |
|
| |||||||
| 2nd Gen. DS | 80/Sn140kV | 0.4 | 0.3 | 0.4 | 0.8 | 1.7 | 0.7 |
| 100/Sn140kV | 0.3 | 0.3 | 0.3 | 0.5 | 0.5 | 0.4 | |
|
| |||||||
| 3rd Gen. DS | 70/Sn150kV | 0.3 | 0.4 | 0.4 | 0.2 | 2.1 | 0.7 |
| 80/Sn150kV | 0.3 | 0.4 | 0.3 | 0.4 | 0.2 | 0.3 | |
| 90/Sn150kV | 0.3 | 0.3 | 0.2 | 0.1 | 0.6 | 0.3 | |
| 100/Sn150kV | 0.3 | 0.3 | 0.3 | 0.2 | 0.3 | 0.3 | |
Table 3.
Percentage error of iodine quantification measured by PCCT, 2nd and 3rd generation dual source dual energy scanners for different iodine concentrations.
| Scanner | DE Mode | Iodine Concentration (mgI/cc) | |||||
|---|---|---|---|---|---|---|---|
|
| |||||||
| 0 | 2 | 5 | 10 | 15 | 20 | ||
| PCCT | [25, 65] keV | NA | 14.6% | 7.2% | 4.1% | 4.8% | 3.3% |
|
| |||||||
| 2nd Gen. DS | 80/Sn140kV | NA | 11.0% | 8.4% | 5.2% | 8.1% | 8.9% |
| 100/Sn140kV | NA | 21.0% | 6.8% | 2.0% | 1.5% | 2.0% | |
|
| |||||||
| 3rd Gen. DS | 70/Sn150kV | NA | 14.0% | 7.6% | 5.4% | 8.4% | 7.4% |
| 80/Sn150kV | NA | 5.0% | 2.8% | 2.8% | 2.8% | 3.2% | |
| 90/Sn150kV | NA | 16.0% | 1.6% | 2.6% | 2.7% | 2.6% | |
| 100/Sn150kV | NA | 17.0% | 4.8% | 2.2% | 1.7% | 0.8% | |
3.3 Virtual Monoenergetic Image (VMI)
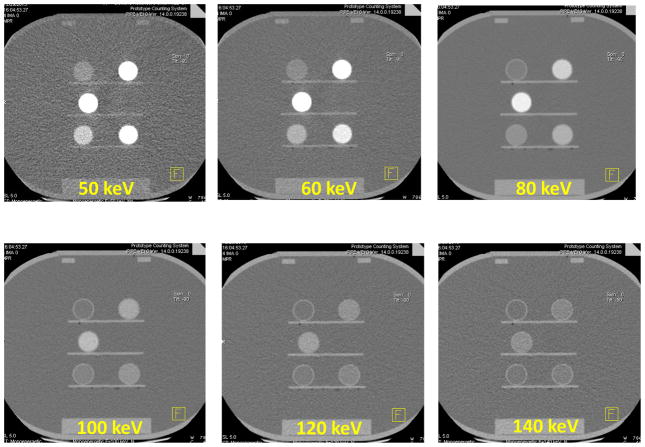
Fig. 6 shows sample VMIs at 50, 60, 80, 100, 120 and 140 keV for the 30 cm phantom. As expected, iodine was brighter at low keV images compared to that of high keV images, with the brightest iodine signal observed in the 50 keV image. Fig. 7 shows the measured CT numbers of VMIs for the 30 cm phantom from 40 to 140 keV, together with the reference values calculated based on known iodine concentrations and attenuation coefficients at each keV. The measured values agreed well with the reference values, with percentage error ranging from 2.3 to 11.2% for each keV and an overall percentage error of 5.3% for all keVs.
Figure 6.
Virtual monoenergetic images of 50, 60, 80, 100, 120 and 140 keV generated from the 30 cm phantom scanned on the PCCT.
Figure 7.
Measured and reference VMI CT numbers of different iodine concentrations from the 30 cm phantom scanned on the PCCT.
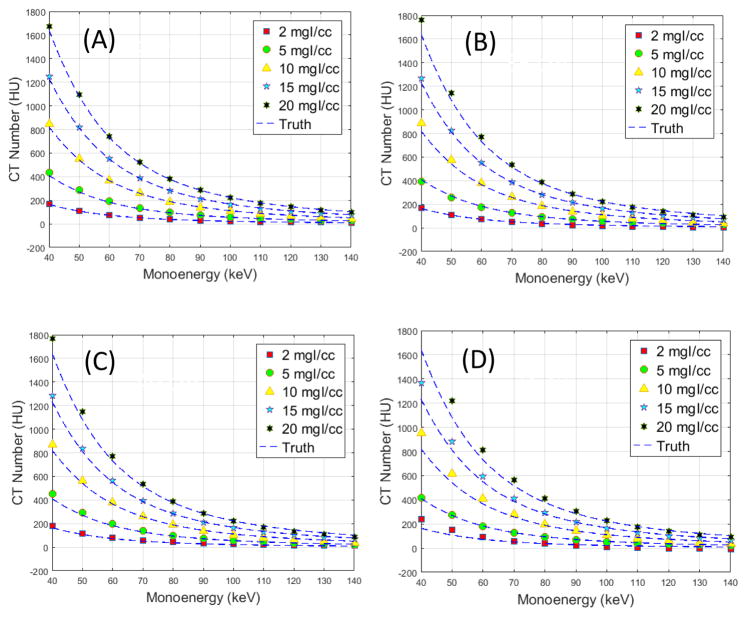
Fig. 8 shows a comparison of measured and reference VMI CT numbers for the other phantom sizes. The percentage errors for different phantom sizes (25 to 45 cm) and different iodine concentrations scanned on the PCCT scanner and the two DSDE scanners are summarized in Tables 4 and 5. It can be observed from Fig. 8 and Table 4 that error generally increased with phantom size for the PCCT scanner, with the lowest percentage error of 2.4% for the 25 cm phantom and highest percentage error of 19.0% for the 45 cm phantom. The high percentage error of the 45 cm phantom was mainly due to the 2 mgI/cc iodine solution, whose relative error was 61.6%. The percentage error dropped from 19.0% down to 8.4% if the 2mgI/cc solution was excluded. The performance of the three scanners was in general comparable, with percentage error of 8.9% for the PCCT, 6.0 and 9.1% for the 2nd generation DSDE scanner, and 6.2%, 6.4%, 7.2% and 8.2% for the 3rd generation DSDE scanner. For different iodine concentrations, higher percentage errors were observed for the 2mgI/cc solution compared to other iodine concentrations due to the low values of VMI CT numbers at the 2mgI/cc iodine solution.
Figure 8.
Measured and reference VMI CT numbers of different iodine concentrations from the 25 (A), 35 (B), 40 (C) and 45 cm (D) phantoms scanned on the PCCT.
Table 4.
Percentage error of VMI CT numbers measured by PCCT, 2nd and 3rd generation dual source dual energy scanners for different phantom sizes.
| Scanner | DE Mode | 25 cm | 30 cm | 35 cm | 40 cm | 45 cm | All Sizes |
|---|---|---|---|---|---|---|---|
| PCCT | [25, 65] keV | 2.4% | 5.3% | 8.1% | 9.5% | 19.0% | 8.9% |
|
| |||||||
| 2nd Gen. DS | 80/Sn140kV | 7.7% | 8.0% | 6.5% | 8.1% | 15.4% | 9.1% |
| 100/Sn140kV | 4.0% | 9.7% | 4.3% | 4.6% | 7.6% | 6.0% | |
|
| |||||||
| 3rd Gen. DS | 70/Sn150kV | 4.0% | 4.8% | 5.0% | 5.0% | 13.4% | 6.4% |
| 80/Sn150kV | 3.3% | 8.0% | 6.2% | 7.5% | 5.8% | 6.2% | |
| 90/Sn150kV | 12.5% | 5.0% | 5.1% | 6.1% | 6.2% | 7.0% | |
| 100/Sn150kV | 13.5% | 5.2% | 6.3% | 8.5% | 7.4% | 8.2% | |
Table 5.
Percentage error of VMI CT numbers measured by PCCT, 2nd and 3rd generation dual source dual energy scanners relative to different iodine concentrations.
| Scanner Model | DE Mode | Iodine Concentration (mgI/cc) | |||||
|---|---|---|---|---|---|---|---|
|
| |||||||
| 2 | 5 | 10 | 15 | 20 | All | ||
| PCD - CT | [25, 65] keV | 22.0% | 4.7% | 7.6% | 4.6% | 5.1% | 8.9% |
|
| |||||||
| 2nd Gen. DS | 80/Sn140kV | 11.4% | 9.2% | 7.1% | 9.3% | 8.7% | 9.1% |
| 100/Sn140kV | 8.6% | 6.7% | 4.2% | 4.7% | 6.0% | 6.0% | |
|
| |||||||
| 3rd Gen. DS | 70/Sn150kV | 12.8% | 6.9% | 3.7% | 5.0% | 3.8% | 6.4% |
| 80/Sn150kV | 13.1% | 6.7% | 4.3% | 3.8% | 2.9% | 6.2% | |
| 90/Sn150kV | 16.6% | 7.6% | 3.9% | 3.8% | 3.0% | 7.0% | |
| 100/Sn150kV | 22.1% | 7.9% | 3.6% | 4.1% | 3.2% | 8.2% | |
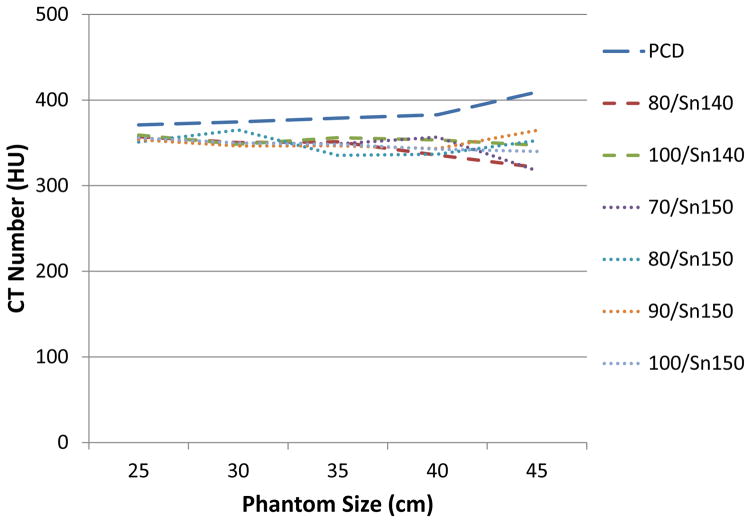
Fig. 9 shows the VMI CT numbers of 60 keV and 10 mgI/cc iodine concentration across phantom sizes, measured at all scanners and scan modes. It demonstrated accurate VMI CT numbers relative to phantom size except for some deviation at the large size phantom (45 cm). Coefficient of variation was 0.036 for the PCCT, 0.038 and 0.013 for the 2nd generation DSDE scanner, and 0.042, 0.032, 0.022 and 0.016 for the 3rd generation DSDE scanner.
Figure 9.
VMI CT numbers at 60 keV of 10 mgI/cc across phantom sizes, at different DE modes and scanner types. The reference VMI CT number that calculated based on attenuation and iodine concentration was 366 HU.
4 Discussion and Conclusions
One of the major motivations for introducing PCD technology into CT is its multi-energy capability. Dual energy CT is currently used in multiple clinical areas. It is critical therefore to assess the spectral performance of the PCCT scanner to obtain baseline data and compare its performance to that of commercially available dual energy scanners. Phantom studies demonstrated high accuracy of iodine quantification using PCCT across a range of iodine concentration and a range of body sizes that are typically encountered in clinical practice. This is critical as iodine is the most common contrast agent used in clinical CT exams and many diagnoses rely on the enhancement of iodine signal in CT images, such as the tumor staging and the assessment of treatment response. Phantom data also showed accurate CT numbers in VMIs generated from the PCCT scans. This is important to clinical tasks where accurate CT numbers are needed, such as differentiating renal masses from renal cysts by comparing the enhancement to a predetermined threshold of CT number. Also, the VMI CT number remained consistently accurate across phantom size and scanner models, which may provide consistent measurements and diagnoses, no matter on which scanner the exam is performed and what the patient size is.
For both iodine quantification and VMI CT number accuracy, slight degradation of performance was observed towards larger size phantoms. This could potentially be attributed to a few factors that influence the accuracy of CT number of the original low- and high-energy threshold (and bin) images, which consequently affects the spectral performance, such as scatter, beam hardening and calibration. Another observation is that for different concentrations of iodine solutions, the relative error is higher for low concentrations, e.g. the 2 mgI/cc solution. This is understandable as the errors are divided by a smaller number in this scenario. This is in line with the general observation that lower concentration solutions are harder to accurately quantify.
In general, the spectral performance of the PCCT scanner was comparable to that of DSDE CT scanners in terms of iodine quantification and VMI CT number accuracy. A previous study by Faby et al investigated image noise of VNC and iodine images (Faby et al., 2015) using computer simulations to compare DE modes with subsequent-scanning, fast-kV-switching, dual-layer detector, DSDE, and PCD. It was found in their study that DSDE with tin filter had the best performance in terms of noise in the material decomposition images. In multi-energy CT, material decomposition capability depends on the spectral separation. Although in theory PCCT could enable perfect spectral separation, the real spectra are usually associated with considerable overlaps due to non-ideal effects such as charge sharing and k-escape (Taguchi and Iwanczyk, 2013, Gutjahr et al., 2016, Koenig et al., 2014). One technique to reduce charge sharing and improve spectral resolution is to use charge sharing correction circuit, which is not available in the system investigated in this study (Koenig et al., 2014). On the other hand, the additional tin filter on the DSDE scanners, which is not available on the PCCT, significantly improves the separation between the low- and high-energy spectra (Primak et al., 2010).
In this study, only 2 energy thresholds were used for the PCCT scans, which were fixed at 25 and 65 keV. These thresholds were selected as they provided approximately equal number of photons for each energy bin at 140 kV ([25, 65] and [65 140] keV). Selection of different energy thresholds/bins might affect the performance, which warrants future studies. The PCCT scanner is capable of generating up to 4 energy bins. For the tasks investigated in this study, and for comparison to dual-energy CT, 2 energy bins were sufficient. Other tasks involving multiple materials, including materials with a k-edge in the diagnostic X-ray energy range, may benefit from the 4 energy bins.
In conclusion, high accuracy for iodine quantification (RMSE of 0.5 mgI/cc) and accurate CT numbers in VMIs (percentage error of 8.9%) were achieved using the PCCT scanner. The accuracy of iodine quantification and VMI CT number using PCCT was comparable to that of EID-based DSDE scanners, while PCCT offers other advantage such as perfect temporal and spatial alignment to avoid motion artifact, high spatial resolution, and improved contrast to noise ratio.
Acknowledgments
Research reported in this article was supported by the National Institutes of Health under award numbers R01 EB016966 and C06 RR018898 and in collaboration with Siemens Healthcare. The content is solely the responsibility of the authors and does not necessarily represent the official views of the National Institute of Health. We would like to thank Michael Bruesewitz for his assistance in data acquisition, and Kristina Nunez for her assistance in manuscript preparation.
Potential conflicts of interest include the following: Dr. McCollough receives industry grant support from Siemens Healthcare. Drs. Krauss, Schmidt, Kappler, and Halaweish are Siemens employees. Siemens Healthcare provided the research scanner evaluated in this work, which is not commercially available. The remaining authors have no conflict of interest.
References
- ALMEIDA IP, SCHYNS LE, ÖLLERS MC, VAN ELMPT W, PARODI K, LANDRY G, VERHAEGEN F. Dual - energy CT quantitative imaging: a comparison study between twin - beam and dual - source CT scanners. Medical Physics. 2016 doi: 10.1002/mp.12000. [DOI] [PubMed] [Google Scholar]
- ALVAREZ RE, MACOVSKI A. Energy-selective reconstructions in x-ray computerised tomography. Physics in medicine and biology. 1976;21:733. doi: 10.1088/0031-9155/21/5/002. [DOI] [PubMed] [Google Scholar]
- BALLABRIGA R, ALOZY J, CAMPBELL M, FROJDH E, HEIJNE E, KOENIG T, LLOPART X, MARCHAL J, PENNICARD D, POIKELA T. Review of hybrid pixel detector readout ASICs for spectroscopic X-ray imaging. Journal of Instrumentation. 2016;11:P01007. [Google Scholar]
- BENNETT JR, OPIE AM, XU Q, YU H, WALSH M, BUTLER A, BUTLER P, CAO G, MOHS A, WANG G. Hybrid spectral micro-CT: system design, implementation, and preliminary results. IEEE transactions on bio-medical engineering. 2014;61:246–53. doi: 10.1109/TBME.2013.2279673. [DOI] [PubMed] [Google Scholar]
- BOLL DT, MERKLE EM, PAULSON EK, FLEITER TR. Coronary stent patency: dual-energy multidetector CT assessment in a pilot study with anthropomorphic phantom. Radiology. 2008;247:687–95. doi: 10.1148/radiol.2473070849. [DOI] [PubMed] [Google Scholar]
- CHANDARANA H, MEGIBOW AJ, COHEN BA, SRINIVASAN R, KIM D, LEIDECKER C, MACARI M. Iodine quantification with dual-energy CT: phantom study and preliminary experience with renal masses. American Journal of Roentgenology. 2011;196:W693–W700. doi: 10.2214/AJR.10.5541. [DOI] [PubMed] [Google Scholar]
- FABY S, KUCHENBECKER S, SAWALL S, SIMONS D, SCHLEMMER HP, LELL M, KACHELRIEß M. Performance of today’s dual energy CT and future multi energy CT in virtual non-contrast imaging and in iodine quantification: A simulation study. Med Phys. 2015;42:4349–4366. doi: 10.1118/1.4922654. [DOI] [PubMed] [Google Scholar]
- FLOHR TG, MCCOLLOUGH CH, BRUDER H, PETERSILKA M, GRUBER K, SÜB C, GRASRUCK M, STIERSTORFER K, KRAUSS B, RAUPACH R. First performance evaluation of a dual-source CT (DSCT) system. European radiology. 2006;16:256–268. doi: 10.1007/s00330-005-2919-2. [DOI] [PubMed] [Google Scholar]
- GOODSITT MM, CHRISTODOULOU EG, LARSON SC. Accuracies of the synthesized monochromatic CT numbers and effective atomic numbers obtained with a rapid kVp switching dual energy CT scanner. Medical Physics. 2011;38:2222–2232. doi: 10.1118/1.3567509. [DOI] [PubMed] [Google Scholar]
- GUTJAHR R, HALAWEISH AF, YU Z, LENG S, YU L, LI Z, JORGENSEN SM, RITMAN EL, KAPPLER S, MCCOLLOUGH CH. Human Imaging With Photon Counting-Based Computed Tomography at Clinical Dose Levels: Contrast-to-Noise Ratio and Cadaver Studies. Investigative radiology. 2016 doi: 10.1097/RLI.0000000000000251. [DOI] [PMC free article] [PubMed] [Google Scholar]
- IWANCZYK JS, NYGARD E, MEIRAV O, ARENSON J, BARBER WC, HARTSOUGH NE, MALAKHOV N, WESSEL JC. Photon counting energy dispersive detector arrays for x-ray imaging. IEEE transactions on bio-medical engineering. 2009;56:535–542. doi: 10.1109/TNS.2009.2013709. [DOI] [PMC free article] [PubMed] [Google Scholar]
- JOHNSON TR, KRAUSS B, SEDLMAIR M, GRASRUCK M, BRUDER H, MORHARD D, FINK C, WECKBACH S, LENHARD M, SCHMIDT B. Material differentiation by dual energy CT: initial experience. European radiology. 2007;17:1510–1517. doi: 10.1007/s00330-006-0517-6. [DOI] [PubMed] [Google Scholar]
- KAPPLER S, GLASSER F, JANSSEN S, KRAFT E, REINWAND M. A research prototype system for quantum-counting clinical CT. Proceedings of SPIE--the International Society for Optical Engineering. 2010;7622:76221Z. [Google Scholar]
- KAPPLER S, HENNING A, KREISLER B, SCHÖECK F, STIERSTORFER K, FLOHR T. Photon counting CT at elevated X-ray tube currents: contrast stability, image noise and multi-energy performance. Proceedings of SPIE--the International Society for Optical Engineering. 2014;9033:90331C. [Google Scholar]
- KOENIG T, ZUBER M, HAMANN E, CECILIA A, BALLABRIGA R, CAMPBELL M, RUAT M, TLUSTOS L, FAULER A, FIEDERLE M. How spectroscopic x-ray imaging benefits from inter-pixel communication. Physics in medicine and biology. 2014;59:6195. doi: 10.1088/0031-9155/59/20/6195. [DOI] [PubMed] [Google Scholar]
- LENG S, GUTJAHR R, FERRERO A, KAPPLER S, HENNING A, HALAWEISH A, ZHOU W, MONTOYA J, MCCOLLOUGH C, HEALTHCARE S. SPIE Medical Imaging. International Society for Optics and Photonics; 2017. Ultra-High Spatial Resolution, Multi-Energy CT using Photon Counting Detector Technology; pp. 101320Y-101320Y–7. [DOI] [PMC free article] [PubMed] [Google Scholar]
- LENG S, SHIUNG M, AI S, QU M, VRTISKA TJ, GRANT KL, KRAUSS B, SCHMIDT B, LIESKE JC, MCCOLLOUGH CH. Feasibility of Discriminating Uric Acid From Non–Uric Acid Renal Stones Using Consecutive Spatially Registered Low-and High-Energy Scans Obtained on a Conventional CT Scanner. American Journal of Roentgenology. 2015a;204:92–97. doi: 10.2214/AJR.13.11911. [DOI] [PMC free article] [PubMed] [Google Scholar]
- LENG S, YU L, FLETCHER JG, MCCOLLOUGH CH. Maximizing iodine contrast-to-noise ratios in abdominal CT imaging through use of energy domain noise reduction and virtual monoenergetic dual-energy CT. Radiology. 2015b;276:562–570. doi: 10.1148/radiol.2015140857. [DOI] [PMC free article] [PubMed] [Google Scholar]
- LI Y, SHI G, WANG S, WU R. Iodine quantification with dual-energy CT: phantom study and preliminary experience with VX2 residual tumour in rabbits after radiofrequency ablation. The British journal of radiology. 2013;86:20130143. doi: 10.1259/bjr.20130143. [DOI] [PMC free article] [PubMed] [Google Scholar]
- LI Z, LENG S, YU L, YU Z, MCCOLLOUGH CH. Image-based Material Decomposition with a General Volume Constraint for Photon-Counting CT. Proceedings of SPIE--the International Society for Optical Engineering. 2015;9412:94120T. doi: 10.1117/12.2082069. [DOI] [PMC free article] [PubMed] [Google Scholar]
- MATSUMOTO K, JINZAKI M, TANAMI Y, UENO A, YAMADA M, KURIBAYASHI S. Virtual Monochromatic Spectral Imaging with Fast Kilovoltage Switching: Improved Image Quality as Compared with That Obtained with Conventional 120-kVp CT. Radiology. 2011;259:257–262. doi: 10.1148/radiol.11100978. [DOI] [PubMed] [Google Scholar]
- MCCOLLOUGH C, LENG S, YU L, FLETCHER JG. Dual-and Multi-Energy Computed Tomography: Principles, Technical Approaches, and Clinical Applications. Radiology. 2015;276:637. doi: 10.1148/radiol.2015142631. [DOI] [PMC free article] [PubMed] [Google Scholar]
- MICHALAK G, GRIMES J, FLETCHER J, HALAWEISH A, YU L, LENG S, MCCOLLOUGH C. Technical Note: Improved CT number stability across patient size using dual - energy CT virtual monoenergetic imaging. Medical physics. 2016;43:513–517. doi: 10.1118/1.4939128. [DOI] [PubMed] [Google Scholar]
- MICHALAK G, GRIMES J, FLETCHER J, HALAWEISH A, YU L, LENG S, MCCOLLOUGH C. Selection of optimal tube-potential settings for dual-energy CT virtual mono-energetic imaging of iodine in the abdomen. Abdominal Radiology. 2017 doi: 10.1007/s00261-017-1122-7. In Press. [DOI] [PubMed] [Google Scholar]
- MILETO A, BARINA A, MARIN D, STINNETT SS, ROY CHOUDHURY K, WILSON JM, NELSON RC. Virtual monochromatic images from dual-energy multidetector CT: variance in CT numbers from the same lesion between single-source projection-based and dual-source image-based implementations. Radiology. 2015;279:269–277. doi: 10.1148/radiol.2015150919. [DOI] [PubMed] [Google Scholar]
- PERSSON M, HUBER B, KARLSSON S, LIU X, CHEN H, XU C, YVEBORG M, BORNEFALK H, DANIELSSON M. Energy-resolved CT imaging with a photon-counting silicon-strip detector. Physics in medicine and biology. 2014;59:6709–27. doi: 10.1088/0022-3727/59/22/6709. [DOI] [PubMed] [Google Scholar]
- PINHO DF, KULKARNI NM, KRISHNARAJ A, KALVA SP, SAHANI DV. Initial experience with single-source dual-energy CT abdominal angiography and comparison with single-energy CT angiography: image quality, enhancement, diagnosis and radiation dose. European radiology. 2013;23:351–359. doi: 10.1007/s00330-012-2624-x. [DOI] [PubMed] [Google Scholar]
- POURMORTEZA A, SYMONS R, SANDFORT V, MALLEK M, FULD MK, HENDERSON G, JONES EC, MALAYERI AA, FOLIO LR, BLUEMKE DA. Abdominal imaging with contrast-enhanced photon-counting CT: first human experience. Radiology. 2016;279:239–245. doi: 10.1148/radiol.2016152601. [DOI] [PMC free article] [PubMed] [Google Scholar]
- PRIMAK AN, GIRALDO JCR, EUSEMANN CD, SCHMIDT B, KANTOR B, FLETCHER JG, MCCOLLOUGH CH. Dual-source dual-energy CT with additional tin filtration: dose and image quality evaluation in phantoms and in vivo. American Journal of Roentgenology. 2010;195:1164–1174. doi: 10.2214/AJR.09.3956. [DOI] [PMC free article] [PubMed] [Google Scholar]
- ROESSL E, PROKSA R. K-edge imaging in x-ray computed tomography using multi-bin photon counting detectors. Phys Med Biol. 2007;52:4679–96. doi: 10.1088/0031-9155/52/15/020. [DOI] [PubMed] [Google Scholar]
- SCHLOMKA JP, ROESSL E, DORSCHEID R, DILL S, MARTENS G, ISTEL T, BAUMER C, HERRMANN C, STEADMAN R, ZEITLER G, LIVNE A, PROKSA R. Experimental feasibility of multi-energy photon-counting K-edge imaging in pre-clinical computed tomography. Phys Med Biol. 2008;53:4031–47. doi: 10.1088/0031-9155/53/15/002. [DOI] [PubMed] [Google Scholar]
- SCHMIDT TG. CT energy weighting in the presence of scatter and limited energy resolution. Medical physics. 2010;37:1056–1067. doi: 10.1118/1.3301615. [DOI] [PubMed] [Google Scholar]
- SHIKHALIEV PM. Computed tomography with energy-resolved detection: a feasibility study. Phys Med Biol. 2008a;53:1475–95. doi: 10.1088/0031-9155/53/5/020. [DOI] [PubMed] [Google Scholar]
- SHIKHALIEV PM. Energy-resolved computed tomography: first experimental results. Phys Med Biol. 2008b;53:5595–613. doi: 10.1088/0031-9155/53/20/002. [DOI] [PubMed] [Google Scholar]
- STIERSTORFER K, RAUSCHER A, BOESE J, BRUDER H, SCHALLER S, FLOHR T. Weighted FBP--a simple approximate 3D FBP algorithm for multislice spiral CT with good dose usage for arbitrary pitch. Phys Med Biol. 2004;49:2209–18. doi: 10.1088/0031-9155/49/11/007. [DOI] [PubMed] [Google Scholar]
- SYMONS R, CORK TE, SAHBAEE P, FULD MK, KAPPLER S, FOLIO LR, BLUEMKE DA, POURMORTEZA A. Low-dose lung cancer screening with photon-counting CT: a feasibility study. Physics in Medicine and Biology. 2016;62:202. doi: 10.1088/1361-6560/62/1/202. [DOI] [PMC free article] [PubMed] [Google Scholar]
- TAGUCHI K, IWANCZYK JS. Vision 20/20: Single photon counting x-ray detectors in medical imaging. Med Phys. 2013;40:100901. doi: 10.1118/1.4820371. [DOI] [PMC free article] [PubMed] [Google Scholar]
- TÜMER T, CLAJUS M, VISSER G, YIN S, WILLSON P, D’ARIES L, PARNHAM K, GLICK B, PERRY J, GAMBLE T. Preliminary results obtained from a novel CdZnTe pad detector and readout ASIC developed for an automatic baggage inspection system. Nuclear Science Symposium Conference Record. 2000;1:4/36–4/41. [Google Scholar]
- XU D, LANGAN DA, WU X, PACK JD, BENSON TM, TKACZKY JE, SCHMITZ AM. SPIE Medical Imaging. International Society for Optics and Photonics; 2009. Dual energy CT via fast kVp switching spectrum estimation. [Google Scholar]
- YU L, CHRISTNER JA, LENG S, WANG J, FLETCHER JG, MCCOLLOUGH CH. Virtual monochromatic imaging in dual - source dual - energy CT: Radiation dose and image quality. Medical physics. 2011;38:6371–6379. doi: 10.1118/1.3658568. [DOI] [PMC free article] [PubMed] [Google Scholar]
- YU L, LENG S, MCCOLLOUGH CH. Dual-energy CT–based monochromatic imaging. American Journal of Roentgenology. 2012;199:S9–S15. doi: 10.2214/AJR.12.9121. [DOI] [PubMed] [Google Scholar]
- YU Z, LENG S, JORGENSEN SM, LI Z, GUTJAHR R, CHEN B, HALAWEISH AF, KAPPLER S, YU L, RITMAN EL, MCCOLLOUGH CH. Evaluation of conventional imaging performance in a research whole-body CT system with a photon-counting detector array. Physics in medicine and biology. 2016a;61:1572–95. doi: 10.1088/0031-9155/61/4/1572. [DOI] [PMC free article] [PubMed] [Google Scholar]
- YU Z, LENG S, KAPPLER S, HAHN K, LI Z, HALAWEISH AF, HENNING A, MCCOLLOUGH CH. Noise performance of low-dose CT: comparison between an energy integrating detector and a photon counting detector using a whole-body research photon counting CT scanner. Journal of Medical Imaging. 2016b;3:043503–043503. doi: 10.1117/1.JMI.3.4.043503. [DOI] [PMC free article] [PubMed] [Google Scholar]
- YU Z, LENG S, LI Z, HALAWEISH AF, KAPPLER S, RITMAN EL, MCCOLLOUGH CH. How Low Can We Go in Radiation Dose for the Data-Completion Scan on a Research Whole-Body Photon-Counting Computed Tomography System. Journal of computer assisted tomography. 2016c doi: 10.1097/RCT.0000000000000412. [DOI] [PMC free article] [PubMed] [Google Scholar]
- ZHANG D, LI XH, LIU B. Objective characterization of GE Discovery CT750 HD scanner: Gemstone spectral imaging mode. Med Phys. 2011;38:1178–1188. doi: 10.1118/1.3551999. [DOI] [PubMed] [Google Scholar]


