Abstract
OBJECTIVE
We implemented an Image Quality Reporting and Tracking Solution (IQuaRTS), directly linked from the PACS, to improve communication between radiologists and technologists.
MATERIALS AND METHODS
IQuaRTS launched in May 2015. We compared MRI issues filed in the period before IQuaRTS implementation (May–September 2014) using a manual system with MRI issues filed in the IQuaRTS period (May–September 2015). The unpaired t test was used for analysis. For assessment of overall results in the IQuaRTS period alone, all issues filed across all modalities were included. Summary statistics and charts were generated using Excel and Tableau.
RESULTS
For MRI issues, the number of issues filed during the IQuaRTS period was 498 (2.5% of overall MRI examination volume) compared with 78 issues filed during the period before IQuaRTS implementation (0.4% of total examination volume) (p = 0.0001), representing a 625% relative increase. Tickets that documented excellent work were 8%. Other issues included images not pushed to PACS (20%), film library issues (19%), and documentation or labeling (8%). Of the issues filed, 55% were MRI-related and 25% were CT-related. The issues were stratified across six sites within our institution. Staff requiring additional training could be readily identified, and 80% of the issues were resolved within 72 hours.
CONCLUSION
IQuaRTS is a cost-effective online issue reporting tool that enables robust data collection and analytics to be incorporated into quality improvement programs. One limitation of the system is that it must be implemented in an environment where staff are receptive to quality improvement.
Keywords: open source, point of care, quality improvement, radiologist-technologist communication, Web tools
Tight communication between radiologists and referring physicians and between radiologists and patients has been recognized as an important part of radiology quality [1, 2]. There has been less discussion about the importance of tight communication between radiologists and technologists. With the increasing size of radiology departments and the larger number of imaging sites within a department, there is an increasing need for communication tools that enable radiologists and technologists to address a variety of acquisition and documentation issues that are key components to radiology quality.
Proper image acquisition and documentation are components of a larger radiology quality control program [3–5]. Generally performed by licensed technologists, proper image acquisition and documentation include ensuring that the patient is appropriately prepared for the examination, the correct imaging protocol is executed, all components of the imaging examination are properly labeled, key information is documented, and all the images and documentation are correctly transmitted to the radiologist for interpretation. A deficiency in any of these steps will affect quality in many forms. For example, inadequate patient preparation may lead to motion artifacts. The use of an incorrect scanning protocol may result in excessive radiation to a patient or the recall of a patient for repeat imaging. Improper documentation of a patient’s height, weight, or blood sugar value may affect the interpretation of PET scans. Failure to transmit all series in an imaging examination may lead to delays in interpretation or failure of imaging processing pipelines.
At our institution, a long-standing approach to documenting these issues used a Portable Document Format (PDF, Adobe Systems) form that radiologists were asked to complete when these issues were recognized. The radiologist completed the form on a PC and then e-mailed it to a modality supervisor who would then address the issue and gather metrics. The form was difficult to locate on the hospital intranet and was tedious to complete and e-mail. Tracking of issues was a manual process done by the modality supervisor, feedback was rarely provided to the issuing radiologist, and metrics took weeks to calculate and analyze. The difficulties involved in the PDF form workflow disincentivized radiologists from using the form and reporting issues.
The purpose of this study was to develop, deploy, and assess an issue reporting solution accessible directly from the PACS at the point of care that facilitated radiologist-technologist communication. We hypothesized that a solution could be developed at low cost, remove several barriers to documenting these issues, and increase the overall radiologist-to-technologist feedback rate, thereby contributing to improved departmental quality.
Materials and Methods
Needs Assessment
After consultation with multiple radiologists and technologists in all subspecialties in our department, the following seven key criteria, which we refer to here as needs assessment items 1–7, were devised for the radiologist-technologist communication system. The first needs assessment item was that the system should be accessible directly from the PACS by a radiologist at the time of examination interpretation (point of care). Second, the system should capture key information about an examination to minimize the data entry by the radiologist and allow staff members to identify the examination needing remediation. Third, the system should enable a radiologist to describe and categorize an issue. Fourth, the system should notify only the appropriate quality control team members needed to address a particular issue. Fifth, the system should allow radiologists and technologists to track an issue’s progress until resolution. Sixth, the system should generate key performance indicators. Seventh, the system should use open-source technologies when possible.
Identification of Technologist Quality Control Team
Up to three technologists were selected to serve as quality control team members for each modality and each scanning location within our institution. These team members were not new hires but, rather, were technologists already serving in supervisory positions within the institution. The job of these team members was to be the points of contact who would receive issue notifications and address issues appropriately. Team members were involved at the earliest stages in defining issue categories, reviewing workflow, and setting expectations for responses to a variety of issues filed. Importantly, the role of this system in quality improvement was emphasized, focusing on constructive feedback and communication by both radiologists and technologists.
System Architecture
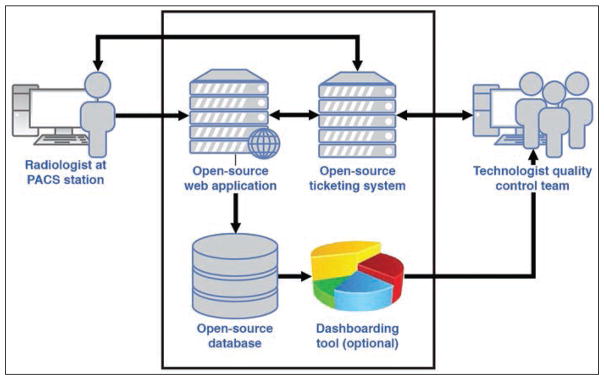
Several reusable components for imaging informatics have been previously described [6]. To achieve the desired needs, we devised a system consisting of PACS context integration with a Web application, a Web browser–based interface, a database, a ticketing system, and a dashboarding tool (Fig. 1). All components of the system resided inside a firewall within the hospital network. This system comprising these components was termed the “Image Quality Reporting and Tracking Solution” or “IQuaRTS.”
Fig. 1.
Schematic shows architecture of radiologist-technologist feedback system. System is composed of web application, ticketing system, and database. Dashboarding tool is optional.
PACS context integration with a Web application
PACS context integration describes the ability to pass user information and specific elements of an examination currently being viewed in the PACS to another application, thereby achieving needs assessment items (i.e., needs assessment items 1 and 2). Several PACS vendors offer this capability, with instructions on how to write the necessary code. In the point-of-care setting, when a radiologist wanted to report an issue with an examination currently under review, the radiologist’s first step was to select this application within the PACS. Examination elements passed to the Web application included the radiologist’s identification number, patient’s name, medical record number, examination accession number, scanning location, and modality.
Web application
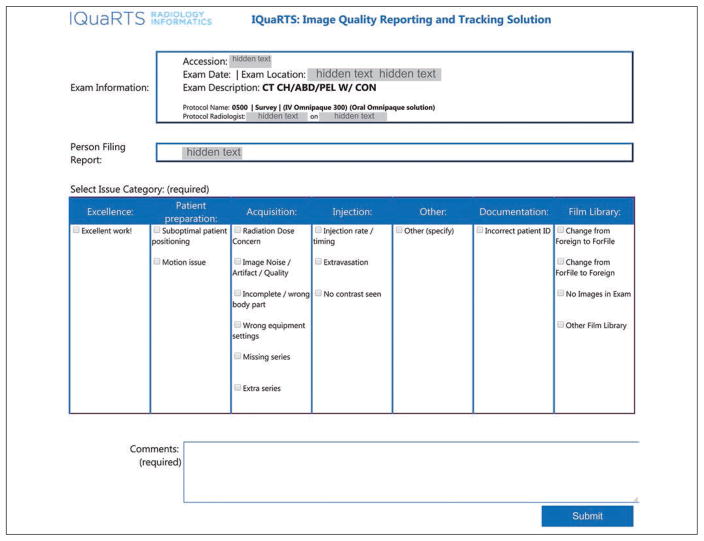
The Web application stored patient and examination information and displayed this information on a Web browser on the radiologist’s PACS computer. Simultaneously, the application displayed a form allowing the radiologist to select issue categories and enter free-text issue comments (Fig. 2), thereby achieving needs assessment item 3. Issue categories included both accolades and critiques. Issue categories included excellence, patient preparation, acquisition, injection, documentation, film library, and other. Under each of these categories were a series of subcategories that were modality-specific. When the radiologist completed the issue submission, the application passed information to a database and to a ticketing system.
Fig. 2.
Screen capture of web application form used in Image Quality Reporting and Tracking System (IQuaRTS). This form displays on PACS window when system is activated from PACS button at time of examination interpretation. Key examination information, including accession number, modality, and site of examination, are automatically passed from PACS into form, reducing amount of radiologist data entry. Radiologist defines issue category by selecting one of checkboxes and then adds comment to clarify issue. Final issue category is determined by quality assurance team member after issue resolution. CT CH/ABD/PEL W/CON = CT of chest, abdomen, pelvis with contrast material; ID = identification. (Omnipaque [iohexol] is manufactured by GE Healthcare).
Ticketing system
We used a freely available, open-source ticketing system (osTicket version 1.9.7, Enhancesoft) to track issue progress and manage communication between radiologists and technologists, thereby achieving needs assessment item 7. The system could be installed locally within our institutional firewall and provided a Web-based interface. Through an application programmer interface, the Web application passed user- and examination-specific information to the ticketing system. Within the system, ticket filters based on examination modality and location allowed automated assignment of tickets to the appropriate technologist quality control team members, who would receive an e-mail notification about issue submission. An issue submitted by a radiologist would therefore be routed only to a specified group of individuals tasked with addressing the issue, thereby achieving needs assessment item 4.
Technologist quality control team members were asked to keep all communications within the ticketing system. The system had sections that allowed team members to write notes to one another and to write separate notes to the radiologist who submitted the issue. All notes entered in the system resulted in e-mail notifications to appropriate team members or to the radiologist, as appropriate. The e-mails included Web links that would take the recipients back to the ticketing system interface and to the specific ticket itself, thereby achieving needs assessment item 5. Once the issue was resolved, technologists were able to close the ticket, resulting in a notification to the radiologist. All activities, including the date of ticket submission, date of closure, and all communications, were time-stamped within the ticketing system. By using this system, quality control team members were able to keep submitted issues organized, with a tight internal communication that allowed multiple team members to work as a unit. The Web application obtained the date of ticket closure from the ticketing system and passed this information, along with previously obtained information, to the database.
Database
An SQL Server (version 2008 R2, Microsoft) database was used in this application because it was readily available through an institutional site license. Free open-source alternatives that would be equally effective for this kind of application include PostgreSQL (PostgreSQL Global Development Group) and MySQL Community Edition (Oracle).
Deployment and Testing
The online reporting system was officially launched in the MRI department in May 2015. After 2 weeks of initial testing, we then deployed the system to the nuclear medicine department. On June 1, 2015, the system was made available to the remaining subspecialties of the radiology department, which included CT, ultrasound (US), mammography, and computed or digital radiography modalities. Once the online reporting system for a modality was deployed, radiologists were able to submit issues relating to any examination in PACS performed using that modality regardless of the time or day that the examination was performed.
Statistical Analysis
A 5-month period after IQuaRTS implementation, which we refer to as the “IQuaRTS period” (May–September 2015) was compared with the same 5-month period in the year before IQuaRTS implementation (May–September 2014). Data collected from the IQuaRTS period included the date of issue submission, identity of submitter, examination site, examination modality, examination subspecialty, and category of problem as determined from final resolution. In the period before IQuaRTS implementation, quality issues submitted by radiologists to technologists were organized by a group of MRI technologists only. There was no organized system for documentation of these issues in any other modality. For the purposes of comparison between the two periods, MRI issues filed in the period before IQuaRTS implementation were compared only with MRI issues filed during the IQuaRTS period. The mean number of tickets filed per month for the two periods was compared using an unpaired t test (GraphPad, GraphPad Software).
For assessment of overall results in the IQuaRTS period alone, all issues filed across all modalities were included in the analysis. Summary statistics and charts stratified by radiologist, issue category, and issue response time were generated (Excel 2007, Microsoft). Summary statistics and charts stratified by imaging site and radiology subspecialty, both normalized to overall examination volumes, were generated (Tableau version 9.1, Tableau Software).
Results
IQuaRTS was launched in May 2015. Radiologist faculty, fellows, and residents were notified of its availability through an e-mail communication. System costs included approximately 100 hours of developer time. The entire application ran on a virtual machine within the institution’s data center. The remaining components were either open-source or otherwise freely available within the institutional information technology (IT) resources.
Comparison of the Periods Before and After IQuaRTS Implementation
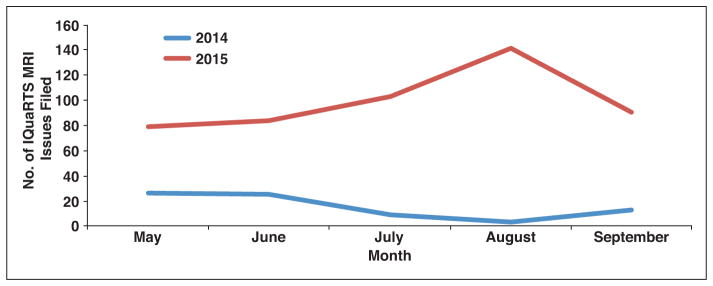
As we explained earlier, comparison of the IQuaRTS period with the period before IQuaRTS implementation was possible for MRI issues only. For these MRI issues only, the number of issues filed during the IQuaRTS period was 498 (2.5% of overall MRI examination volume, 99.6 tickets/mo) compared with 78 issues filed during the period before IQuaRTS implementation (0.4% of total examination volume, 15.2 tickets/mo) (p = 0.0001), which represents a 625% relative increase in tickets filed (i.e., 2.5/0.4) (Fig. 3). Of the seven sites in our organizational infrastructure, every site except one with generally low examination volumes saw an increase in the number of MRI issues filed in the IQuaRTS period. Likewise, across all radiology subspecialties (e.g., body, breast, musculoskeletal, neuroradiology), there was an increase in the number of MRI issues filed during the IQuaRTS period.
Fig. 3.
Graph shows number of MRI issues filed in same 5-month period in 2 separate years. Image Quality Reporting and Tracking Solution (IQuaRTS) application was used to submit issues in 2015 (red line). Portable Document Format (PDF, Adobe Systems) form and e-mail were used to submit issues in 2014 (blue line).
Overall Results From the Period After IQuaRTS Implementation
Radiologist participation
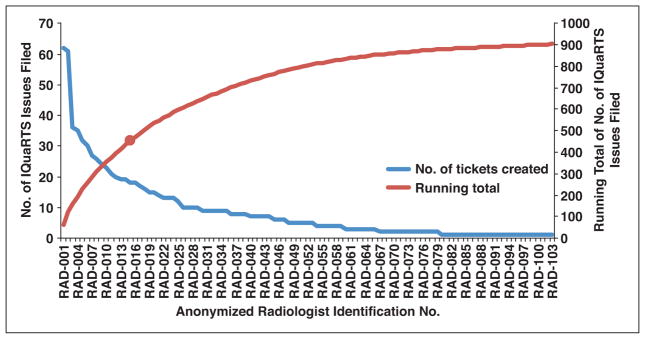
Of the 166 radiologists who read any examination during the IQuaRTS period, 103 (62%) submitted at least one issue. The participation was concentrated in a subset of these radiologists; 15 radiologists submitted 50% of the issues (Fig. 4). Participation included radiologists in all subspecialties.
Fig. 4.
Graph shows number of issues filed by individual radiologists (blue line) and running total (red line) during 5-month period using Image Quality Reporting and Tracking Solution (IQuaRTS). Radiologist names have been sorted in descending order of issues submission count and then anonymized. Red circle represents 50% point of total 903 issues filed. Fifteen of participating 103 radiologists submitted 50% of all issues.
Issue counts and categorization
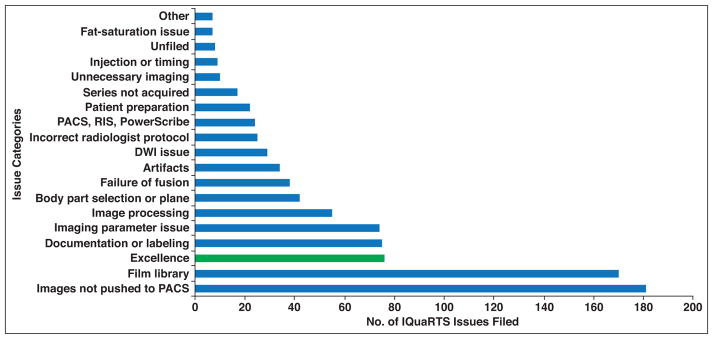
Across all modalities in the IQuaRTS period alone, a total of 154,579 examinations were performed, and 903 issues were filed (0.6% of overall examination volume). Database queries enabled quick categorization of issue type by modality (Table 1). The modality with the greatest number of issues was MRI (n = 498), followed by CT (n = 225). The issue with the highest count was “Images not pushed to PACS” (n = 181), followed by film library issues (n = 170). Film library issues were frequently filed because outside examinations submitted for review were incomplete (missing images). Other issues receiving high counts of submissions included documentation or labeling (n = 75), imaging parameter (n = 74), and image processing (n = 55). Importantly, 76 issues (8% of all issues filed) were filed by radiologists to recognize excellent quality of the technologists’ work (Fig. 5).
TABLE 1.
Number of Issues Filed in a 5-Month Period Using Image Quality Reporting and Tracking Solution (IQuaRTS), Organized by Issue Category and Examination Modality
| Issue Category | No. of Issues
|
||||||||
|---|---|---|---|---|---|---|---|---|---|
| CR | CT | MG | MRI | NM | PET | US | XA | Total | |
|
| |||||||||
| Artifacts | 4 | 5 | 25 | 34 | |||||
| Body part selection or plane | 1 | 9 | 27 | 3 | 2 | 42 | |||
| Documentation or labeling | 5 | 11 | 35 | 18 | 5 | 1 | 75 | ||
| DWI issue | 29 | 29 | |||||||
| Excellence | 3 | 10 | 46 | 3 | 14 | 76 | |||
| Failure of fusion | 4 | 34 | 38 | ||||||
| Fat-saturation issue | 7 | 7 | |||||||
| Film library issues | 4 | 92 | 52 | 1 | 21 | 170 | |||
| Image processing | 7 | 1 | 46 | 1 | 55 | ||||
| Images not pushed to PACS | 1 | 51 | 112 | 1 | 15 | 1 | 181 | ||
| Imaging parameter issue | 2 | 11 | 1 | 59 | 1 | 74 | |||
| Incorrect radiologist protocol | 1 | 24 | 25 | ||||||
| Injection or timing | 4 | 2 | 2 | 1 | 9 | ||||
| Other | 2 | 1 | 3 | 1 | 7 | ||||
| PACS, RIS, PowerScribea | 5 | 12 | 3 | 4 | 24 | ||||
| Patient preparation | 3 | 4 | 1 | 7 | 3 | 4 | 22 | ||
| Series not acquired | 1 | 1 | 15 | 17 | |||||
| Unfiled | 1 | 2 | 1 | 4 | 8 | ||||
| Unnecessary imaging | 4 | 3 | 2 | 1 | 10 | ||||
|
| |||||||||
| Total no. of issues filed | 30 | 225 | 9 | 498 | 11 | 103 | 24 | 3 | 903 |
| Total no. of examinations performed | 154,579 | ||||||||
| Total no. of issues filed/total no. of examinations performed | 0.6% | ||||||||
Note—Issue categories were determined by quality assurance team members after the issue was resolved. CR = computed radiography, MG = mammography, NM = nuclear medicine, US = ultrasound, XA = x-ray angiography, RIS = radiology information system.
Nuance Communications.
Fig. 5.
Graph shows number of issues filed by each issue category in 5-month period using Image Quality Reporting and Tracking Solution (IQuaRTS). Issue categories were determined by quality assurance team members after issue was resolved. Radiologists filed 76 issues of excellence (8% of all issues), providing positive feedback to technologists (green bar). Blue bars show all other issues. RIS = radiology information system. (PowerScribe is product of Nuance Communications.)
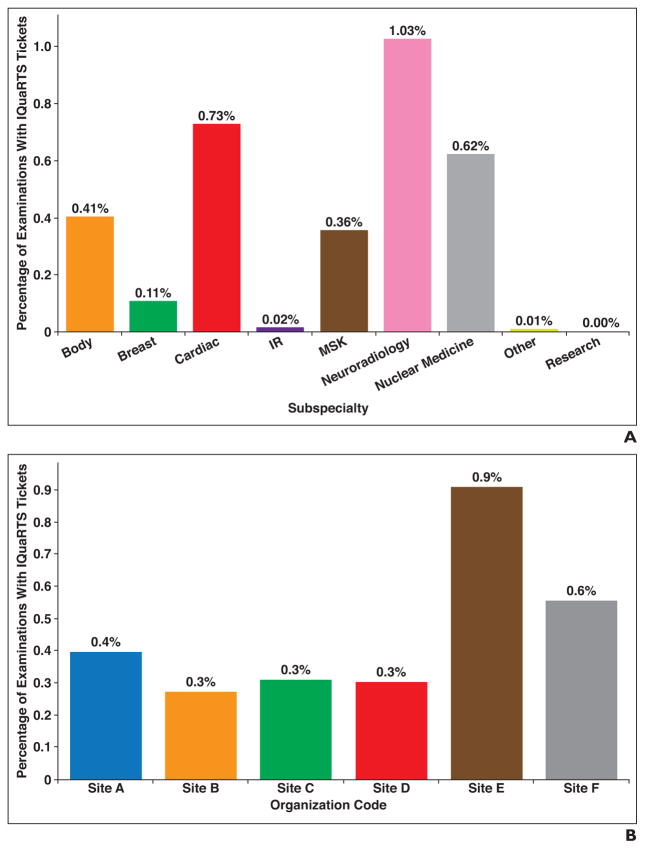
Database queries also enabled quick categorization of issues by radiology subspecialty (Fig. 6A) and by examination performing site (Fig. 6B). Issue counts were readily normalized against total examination volumes, enabling quick identification of subspecialties and sites needing targeted attention in quality improvement.
Fig. 6.
Number of issues filed by radiologists in 5-month period using Image Quality Reporting and Tracking Solution (IQuaRTS).
A, Bar graph shows number of issues filed in 5-month period using IQuaRTS categorized by radiologist subspecialty. Percentages were calculated as follows: (number of examinations with issues filed in subspecialty) ÷ (number of examinations performed in subspecialty). IR = interventional radiology, MSK = musculoskeletal.
B, Bar graph shows number of issues filed in 5-month period using IQuaRTS categorized by site of examination acquisition. Percentages were calculated as follows: (number of examinations with issues filed performed at site) ÷ (number of examinations performed at site).
Issue resolution times
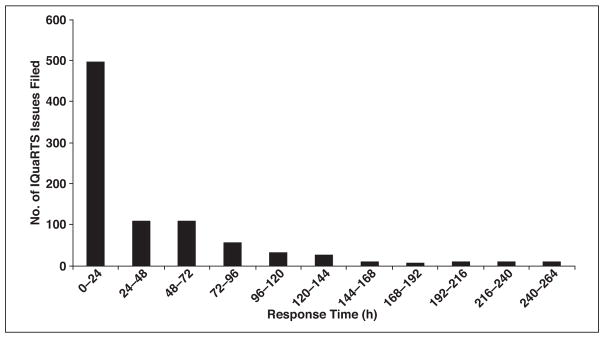
Issue resolution time was calculated as the difference between when an issue was filed and when it was closed by the quality control team member. After ticket closure, a radiologist had the opportunity to reopen a ticket if he or she was not satisfied with the resolution. The resolution time for every ticket was always taken as the last closure event time. Within the first 24 hours after issue submission, 55% of issues were resolved, and 80% of issues were resolved within 72 hours (Fig. 7).
Fig. 7.
Bar graph shows resolution times of issues filed in 5-month period using Image Quality Reporting and Tracking Solution (IQuaRTS); 80% of issues were resolved within 72 hours.
Discussion
Tools that enable timely recognition and reporting of problems should be components of any quality process in any industry. In radiology, the individuals who perform imaging examinations (technologists) and those who interpret the examinations (radiologists) are different groups who may be working in different geographic locations and at different times. The complexity of the operation, particularly in expanding radiology departments, makes the feedback process inherently difficult. There is very little published with regard to how communication between radiologists and technologists is impacted by integrated online reporting tools in radiology departments. We show that tools can be easily accessed from the PACS at the point of care and can contribute to a significant increase in radiologist-technologist feedback, which is a necessary step in a quality control program.
In the time period that the application was used, there was a 625% increase in the number of tickets filed compared with a time period using a paper process, an increase from 15.2 (mean) to 99.6 issues filed per month (p = 0.0001). Importantly, all issues filed within the application were tracked to completion, whereas issues filed using the paper process were not systematically tracked. The system, therefore, enforced a closed-loop communication. The radiologist participation rate was high (62%), probably because of the ease of use and also the relatively quick response times from the technologist quality control team members (55% of issues were resolved in the first 24 hours after submission). The knowledge that submitted issues are being reviewed and addressed encourages participation in a quality control program. The issue submission rate was 0.6% of overall examination volume. The enduring use of the application over 5 months suggests that radiologists found it to be of value and that the application was an effective communication tool.
Maintaining high standards of examination acquisition and documentation can be partly achieved with good leadership and well-enforced policies and procedures. However, many issues are detected by the radiologist after the examination has left the hands of the technologist. Some issues can be addressed immediately. For instance, a missing series from an examination may in fact have been acquired by the technologist but may not have been pushed to the PACS. Once recognized, the issue of the missing series can be corrected by a request made by the radiologist to the technologist to push the missing series, which is still available on the scanner, to the PACS. Other issues may not be so easy to address immediately but are worthwhile to document in an effort to recognize patterns and prevent the issue from arising in the future. Motion artifact, for instance, can result from the inability of a patient to hold his or her breath during an MRI examination or from the oversight of a technologist in properly coaching the patient. A pattern of multiple abdominal MRI examinations with motion artifact may help in recognizing the need to further train technologists at a given imaging facility to better instruct patients on the need for breath-holding. Establishing this pattern necessitates a reporting system that is accessible, is easy to use, and, therefore, is actually used by radiologists.
We show that a relatively low-cost set of components can be used to create a tool for radiologist-technologist feedback in a large multifacility academic medical center. We were able to use features on our PACS to enable context-passing of point-of-care examination information to our tool, which used a Web application, database, and ticketing system to record the issues, manage communications, and gather metrics. The cost was largely in developer time of approximately 100 hours. Assuming an upper level of cost of $100/h, development costs approach $10,000. Because this application is not computationally intensive, it can run on most modern, low-end computing platforms costing less than $2000. This system can be implemented in any radiology department that uses a PACS with context-passing capability.
Golnari et al. [7] conducted a study in which they assessed the impact of point-of-care feedback by purchasing and implementing a commercially available tool, also similarly integrated with the PACS in a multifacility radiology department. In that study, the issue submission rate was 0.25% of overall examination volume compared with 0.6% in our data. The modality with the highest number of issues filed was MRI, similar to our data. In that prior study, the radiologist participation rate and issue resolution times were not reported. The cost of the commercially available tool was also not reported. Cost comparisons can readily be made by obtaining quotes from that vendor [7].
Online tools have been developed at other institutions to address quality reporting needs. Kruskal et al. [8] developed a Web-based tool for recording and managing a broad list of quality issues relating not only to image acquisition, but also to all equipment, technologist, and staff issues. The scope of that tool included documentation of errors in communication, examination interpretation, diagnostic delays, and procedural complications. That study also described a significant increase in the number of issues reported in the period in which the online tools were available, as compared with a prior period. Although thorough and broad in scope, that tool required a radiologist to log in to another Website to enter details about a radiology examination of concern, a small extra step that nonetheless may be a disincentive to reporting certain issues. In our study, we focused on a narrower problem of radiologist-technologist communication. Information about the examination being interpreted (accession number, modality, site of acquisition) was passed automatically to our application from PACS, thereby reducing the amount of radiologist work needed to submit an issue. We emphasize that making issues easy to submit encourages submission, a necessary step in a quality control program. The integration of dedicated systems such as ours with a broader quality recording system such as that developed by Kruskal et al. may be the best solution to establishing a robust quality control program.
One limitation of our system and other similar systems is the ability to compare data between institutions. The issue categories that we defined were chosen on the basis of the perceived needs of our radiologists and technologists. Golnari et al. [7] defined a different set of examination categories. For the purposes of addressing quality concerns within an institution, it may be reasonable and expedient to allow interinstitutional variability in issue category definitions. However, in this age of quality metrics, practice quality improvement, pay-for-performance, and national registries and campaigns, there may be interest in harmonizing these issue categories between institutions for the purpose of interinstitutional comparison.
A second limitation to this kind of system is that it must be placed in an environment that is receptive to quality improvement. A feedback system such as this can be incorporated into a work environment that is positive, respectful, and safe. On the other hand, if not established properly, it can be perceived as punitive and threatening to job security. The same system in the first setting will be successful and in the latter setting will fail. IT tools can be no better than how they are deployed. In the deployment of this tool within our institution, we brought together radiologists and technologists in joint meetings to explain the purpose of this initiative. Issues filed were regularly reviewed in future joint meetings. We encouraged respectful language by radiologists when filing an issue and similarly respectful language by quality team leaders when replying to an issue. Importantly, we encouraged radiologists to file issues of excellence in addition to issues providing constructive feedback. Including accolades in the same system can help to mitigate ill feelings when criticisms are filed. In our system, 8% of issues filed by radiologists were issues of technical excellence.
We found that 15 radiologists (15% of participating radiologists) submitted 50% of the issues. Perhaps this subset of radiologists was more technologically adept and felt more comfortable in using the reporting system in an environment receptive to quality improvement. In addition, this subset of radiologists may have had more work hours than their peers. Future studies could explore radiologist participation rates over time.
A final limitation is that the system developed here should not be considered the entire solution to a quality improvement program. We show that the system effectively lowers the barriers to participation in a quality control program, enables robust data collection, and efficiently manages communications from the point of issue submission to resolution. Quality improvement, however, requires additional steps of data analysis, pattern identification, intervention, and impact analysis. Data analysis can be performed at low cost using functions available on many current spreadsheet applications such as Excel or can be performed using modern, but more expensive, dashboarding tools that enable real-time analysis. There are more than a dozen business intelligence tools on the market that enable dynamic data visualization. Generalized pattern identification, planning an intervention, and impact analysis, however, cannot be easily automated with IT solutions but rather require careful oversight by a quality control team.
Conclusion
Communication between radiologists and technologists is an essential component of radiology quality. Tools that can easily be accessed from the PACS at the point of care and that enforce a closed-loop communication will encourage radiologists to provide feedback about quality issues, pertaining to both technical excellence and needs for improvement. These tools can be developed at relatively low cost and can enable robust data collection and analytics. For quality improvements to be achieved, the data obtained must be overseen by a quality control team and incorporated into an established quality improvement program.
Acknowledgments
This research was funded in part through National Institutes of Health–National Cancer Institute Cancer Center Support Grant P30 CA008748.
We thank Joanne Chin for valuable assistance in the preparation and submission of this manuscript.
References
- 1.Gunderman RB. Patient communication: what to teach radiology residents. AJR. 2001;177:41–43. doi: 10.2214/ajr.177.1.1770041. [DOI] [PubMed] [Google Scholar]
- 2.Gunn AJ, Mangano MD, Choy G, Sahani DV. Rethinking the role of the radiologist: enhancing visibility through both traditional and nontraditional reporting practices. RadioGraphics. 2015;35:416–423. doi: 10.1148/rg.352140042. [DOI] [PubMed] [Google Scholar]
- 3.Johnson CD, Krecke KN, Miranda R, Roberts CC, Denham C. Quality initiatives: developing a radiology quality and safety program—a primer. RadioGraphics. 2009;29:951–959. doi: 10.1148/rg.294095006. [DOI] [PubMed] [Google Scholar]
- 4.Blackmore CC. Defining quality in radiology. J Am Coll Radiol. 2007;4:217–223. doi: 10.1016/j.jacr.2006.11.014. [DOI] [PubMed] [Google Scholar]
- 5.Swensen SJ, Johnson CD. Radiologic quality and safety: mapping value into radiology. J Am Coll Radiol. 2005;2:992–1000. doi: 10.1016/j.jacr.2005.08.003. [DOI] [PubMed] [Google Scholar]
- 6.Kohli MD, Warnock M, Daly M, Toland C, Meenan C, Nagy PG. Building blocks for a clinical imaging informatics environment. J Digit Imaging. 2014;27:174–181. doi: 10.1007/s10278-013-9645-0. [DOI] [PMC free article] [PubMed] [Google Scholar]
- 7.Golnari P, Forsberg D, Rosipko B, Sunshine JL. Online error reporting for managing quality control within radiology. J Digit Imaging. 2016;29:301–308. doi: 10.1007/s10278-015-9820-6. [DOI] [PMC free article] [PubMed] [Google Scholar]
- 8.Kruskal JB, Yam CS, Sosna J, Hallett DT, Milliman YJ, Kressel HY. Implementation of online radiology quality assurance reporting system for performance improvement: initial evaluation. Radiology. 2006;241:518–527. doi: 10.1148/radiol.2412051400. [DOI] [PubMed] [Google Scholar]


