

Abstract
Purpose
To test the hypothesis that the relationship between baseline visual field damage and the rate of progression depends upon the use of logarithmic (dB) versus linear (1/Lambert) scale.
Methods
60 eyes (60 patients) with treated, established glaucoma and at least 5 reliable 24-2 visual fields were included. Baseline visual field mean deviation (MD) in dB was transformed to 1/Lambert using standard equation. Mixed effects linear regression was used to calculate the slopes (MD rates of progression over time) with linear and non-linear scales. We tested relationship between baseline MD and MD slopes for each scale of measure.
Results
In dB scale, worse baseline visual field loss was associated with faster MD slopes (P=0.037), while the opposite effect was seen in 1/Lambert (P=0.001). For a similar rate of progression in dB/year, eyes with mild visual field damage lost more linear sensitivity over a given period of time than those with more severe baseline damage.
Conclusions
There is a significant relationship between baseline visual field severity and rates of MD progression, although the direction of this association depends on the scale sensitivity is measured. The definition of fast versus slow visual field progression should be revised and take into account that sensitivity in linear scales show a better correlation with structural loss than when conventionally measured in non-linear scale.
Keywords: glaucoma, visual fields, progression, perimetry
INTRODUCTION
Visual field evaluation is a key component of glaucoma management. It is widely used to determine disease severity and to monitor progression,1 and often dictates how clinicians tailor treatment. Standard automated perimetry (SAP) is the recommended method to test visual fields in clinical practice 2,3 and has been used as the main outcome measure of randomized clinical trials in glaucoma.4–6
In brief, thresholding SAP tests the contrast sensitivity at different areas of the island of vision using a pseudo-random algorithm to converge to the threshold sensitivity of a given test location, which ultimately represents the activity of retinal ganglion cells (RGCs) that receive the output from photoreceptors stimulated in the corresponding retinal location. Yet, there are different scales to measure contrast sensitivity. For many years, clinicians and scientists have conventionally used decibels (dB) as standard scale of measurement when calculating pointwise and global (e.g.; mean deviation, MD) sensitivity. However, dB values are calculated based upon non-linear (logarithmic) transformations of linear scales, such as apostlilbs (candela per square meter) and Lamberts (lumens per square centimeter). Hence, one should be cautious when using dB values to measure progression. For instance, a 5 dB loss from a baseline sensitivity of 30 dB is not similar to the same loss from a baseline of 10 dB (i.e.: the former means a greater loss in linear sensitivity than the latter).
It remains unclear as to whether eyes with a worse baseline MD (in dB) progress faster rates than those with less severe damage. Some studies have shown that there is no significant relationship between baseline visual field MD and rate of progression measured with in dB per year (dB/year).7,8 Other studies, however, have shown that a worse baseline MD is associated with faster rates of progression in dB/year,9,10 while another found the opposite.11 There are numerous factors that may help explain such differences, including differences in population sampling and the effects of treatment.8 This is further complicated by the use of a logarithmic scale (dB) to define the level of baseline damage and applying linear regression to measure the slopes of progression.
In the present study, our aim was to determine whether baseline MD, measured in a linear scale (1/Lambert), is a risk factor for glaucomatous visual field progression when the slopes are also measured in 1/Lamberts per year (1/L/year). We hypothesized that after converting to a linear scale, patients with baseline severe glaucoma progress at slower rates than those with less severe damage.
METHODS
In this retrospective study, we included consecutive patients diagnosed with glaucoma seen in a referral practice during the months of May and July of 2016. The study was approved by the Institutional Review Board of Columbia University Medical Center and followed the tenets of the Declaration of Helsinki.
All patients underwent complete ophthalmic examinations, including slit-lamp biomicroscopy, gonioscopy, Goldmann applanation tonometry, ultrasonic central corneal thickness (CCT) measurement, dilated stereoscopic examination, optic disc stereophotographs, and 24-2 Swedish Interactive Threshold Algorithm (SITA) standard visual field testing (Humphrey Field Analyzer II; Carl Zeiss Meditec, Inc., Dublin, California, USA). For the current study, inclusion criteria consisted of patients with established glaucoma, gonioscopically open angles, age between 40 and 80 years, refractive spherical equivalent of ≤6 diopters, no history of ocular trauma or uveitis, and no intraocular surgery at baseline except for uncomplicated cataract extraction.
Established glaucoma was defined as the presence of glaucomatous optic neuropathy associated with glaucomatous visual field abnormalities. Glaucomatous visual field abnormalities were defined when the test result revealed a glaucoma hemifield test (GHT) outside normal limits and a pattern standard deviation (PSD) with P <0.05 on at least two consecutive examinations.4 Exclusion criteria were best-corrected visual acuity worse than 20/40 or causes of visual field loss other than glaucoma and cataract. Treatment was chosen at the discretion of the physician, and included topical medications (prostaglandin analogs, beta-adrenergic antagonists, topical carbonic anhydrase inhibitors, alpha-adrenergic agonists, and cholinergic agonists) and/or laser therapy (selective or argon laser trabeculoplasty). Given that filtering surgery can abruptly impact the rate of progression,12,13 we excluded patients who underwent glaucoma surgery during the study follow-up.
Eligible patients were experienced with perimetry and had at least five reliable visual field tests prior to the baseline test used in the analyses. A visual field was considered unreliable if it had fixation losses > 30%, or false negative or false positive responses > 25%. If both eyes met the inclusion criteria, one eye was selected randomly. The total number of eyes in this study was 60.
Eligible eyes were divided into 3 groups based on the severity of their baseline MD in dB. Twelve patients were deemed “mild” with a baseline MD better than −6 dB; 25 patients were deemed “moderate” with baseline MD between −6 dB and −12 dB; and the remaining 23 patients were determined to have “severe” glaucoma with baseline MD worse than −12 dB.
Statistical analyses
MD values in logarithmic scale were converted to linear scale using the equation:14
In addition to MD values in dB and 1/Lambert, we also calculated their percentage relative to the dynamic range as follows: dynamic range change = [(visit value − floor value)/dynamic range] × 100/year. The dynamic range was estimated based upon maximum (ceiling) and minimum (floor) values of the entire range of patients’ visual field tests.
Mixed effects linear models (with unstructured covariance) were used to test the relationship between MD values (in different scales) and Time (in years). One advantage of this type of model is that it takes into account the correlation between residuals seen in longitudinal datasets, which violates the main assumptions of ordinary least squares linear regression. To test whether baseline severity was associated with the speed of progression, the coefficient and p-values of interaction terms (Group *Time) tested for differences in slopes from mild to severe cases. MD slopes (in each scale) for individual eyes were calculated based upon beast linear unbiased predictions (BLUPs) from mixed effects models. For comparisons between scales within patients, we calculated normalized (z-scores) MD slopes for each scale. Statistical analyses were performed using commercially available software (STATA, version 14; StataCorp LP, College Station, TX). Statistical significance defined at P< 0.05.
RESULTS
Sixty patients (60 eyes) with mean (standard deviation, SD) baseline MD of −11.5 (6.8) dB were included. Patients were tested with a mean of 9.63 (4.8) tests (range, 5 to 27) spanning 10.4 (4.8) years (range, 2 to 18). Their mean rate of progression was −0.42 dB/year (95%CI=−0.50 to −0.33, P<0.001) and −0.01 1/L/year (95%CI=−0.017 to −0.008, P<0.001) in logarithmic and linear scales, respectively. As expected, the average baseline MD differed significantly among severity groups (mild=-3.4 (1.5), moderate=-8.5 (1.6), severe=-18.9 (4.4) dB, P<0.001; and 0.48 (0.17), 0.14 (0.05), and 0.02 (0.01) 1/L, respectively, P<0.001, ANOVA with Bonferroni correction) (Table 1).
Table 1.
Clinical characteristics of the study sample.
| Mild (N=12) | Moderate (N=25) | Severe (N=23) | P | |
|---|---|---|---|---|
| Age (years) | 60 (12) | 62 (13) | 63 (12) | 0.72a |
| Race (African American) | 13% | 11% | 15% | 0.91b |
| Baseline MD (dB) | −3.4 (1.5) | −8.5 (1.6) | −18.9 (4.4) | <0.001a |
| CCT (microns) | 547 (37) | 535 (38) | 529 (37) | 0.28a |
| Follow-up IOP (mmHg) | 15.7 (3) | 15.2 (3) | 13.5 (2) | 0.033a |
Abbreviations: MD= mean deviation of 24-2 visual fields; CCT= central corneal thickness; IOP= intraocular pressure
One-way analysis of variance
Chi-square test
Table 2 shows the comparison of MD progression slopes in different scales among the 3 severity groups. Interestingly, while progression was faster in eyes with more severe baseline damage in logarithmic scale (β= −0.120; 95%CI= −0.234 to −0.007; P=0.037), the opposite was seen in linear scale (β=0.009; 95%CI=P=0.001).
Table 2.
Comparison of mean deviation (MD) rates of change based upon baseline severity. P-values are based upon the results of mixed effects linear models testing the interaction between group severity and time.
| Mild | Moderate | Severe | P-value | |
|---|---|---|---|---|
| MD slope (dB/year) | −0.28 (0.2) | −0.39 (0.3) | −0.54 (0.3) | 0.037 |
| MD slope (% of dB/year) | −0.88 (0.6) | −1.23 (1.0) | −1.68 (1.2) | 0.037 |
| MD slope (1/L/year) | −0.023 (0.01) | −0.015 (0.01) | −0.004 (0.004) | 0.001 |
| MD slope (% of 1/L/year) | −1.85 (1.2) | −1.25 (1.4) | −0.38 (0.6) | 0.001 |
Abbreviations: MD= mean deviation of 24-2 visual fields; L= Lambert.
Figures 1 and 2 depict the normalized MD slopes (relative to the dynamic range) of eyes with mild and severe baseline visual fields, respectively. In the eye with mild damage (baseline MD of −2.1 dB), the rate of progression based upon linear scale is steeper (faster) than that measured in logarithmic scale. In the eye with severe damage (baseline MD of −17.7 dB), the slope is steeper when measured in logarithmic scale.
Figure 1.
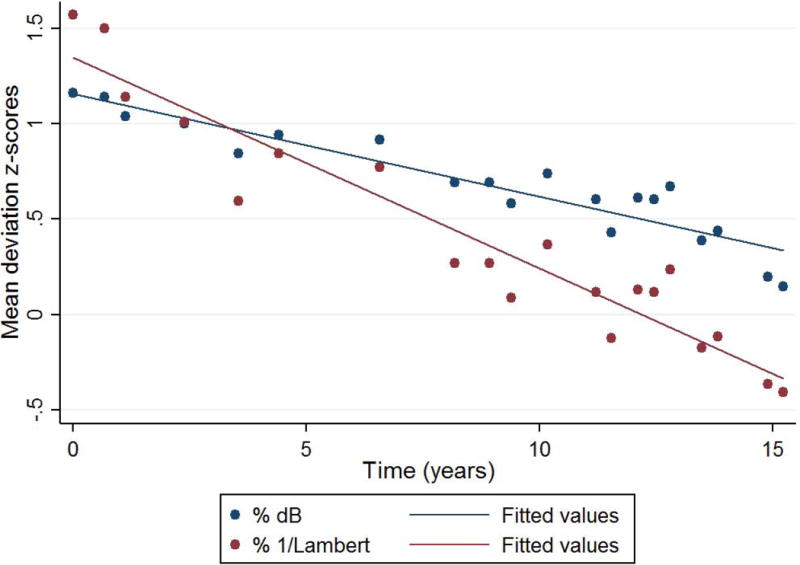
Normalized mean deviation (MD) slopes (% relative to the dynamic range) of an eye with mild baseline visual field loss (MD= −2.1 dB). Navy circles and line represent the distribution and best linear fit of values in decibel, respectively. Maroon circles and line represent 1/Lambert.
Figure 2.
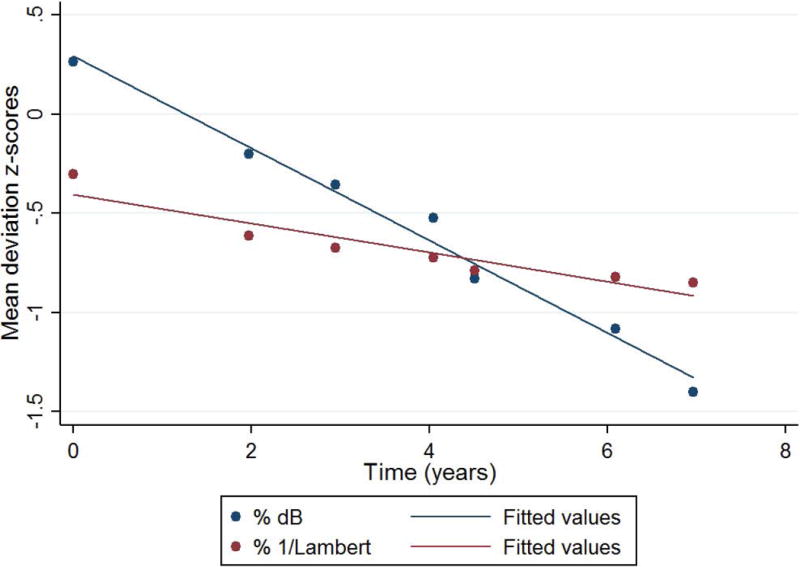
Normalized mean deviation (MD) slopes (% relative to the dynamic range) of an eye with severe baseline visual field loss (MD= −17.7 dB). Navy circles and line represent the distribution and best linear fit of values in decibel, respectively. Maroon circles and line represent 1/Lambert.
To illustrate that the role of the scale used to measure sensitivity on the definition of fast versus slow progression, Figure 3 depicts two eyes with similar rates of MD change in dB/year, −0.42 and −0.47 dB/year, both often considered slow progression. However, one eye had mild and the other severe baseline damage. When measuring in 1/Lambert/year (Figure 4), we now see a steeper slope in the eye with mild damage.
Figure 3.
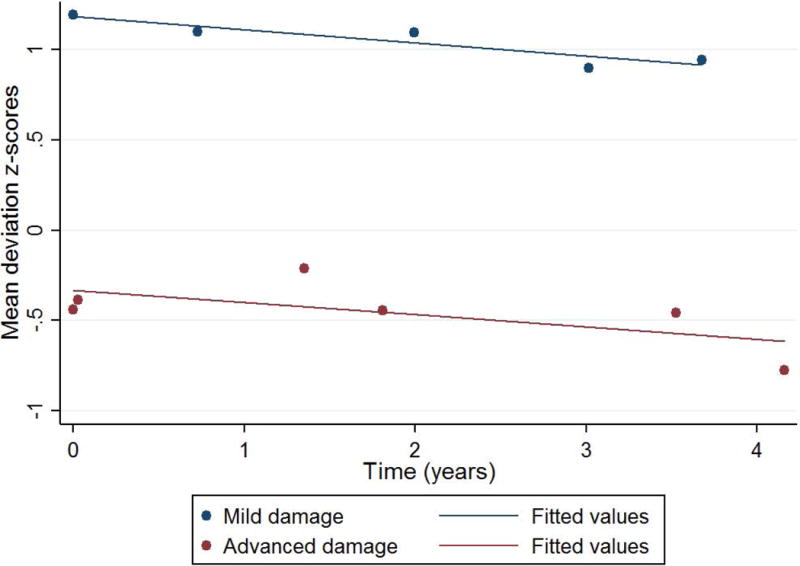
Normalized mean deviation (MD) slopes (% dB) of two eyes with similar rates of MD change in dB/year, −0.42 (navy) and −0.47 (maroon) dB/year. One eye (navy) had mild (MD=-2.2 dB) and the other (maroon) severe baseline damage (-12.5 dB).
Figure 4.
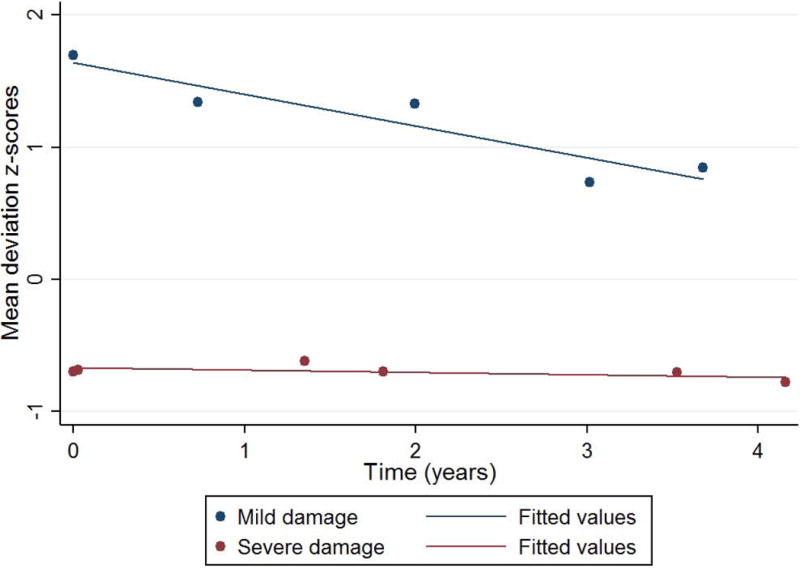
Same eyes from Figure 3, but the mean deviation values are now normalized to % 1/Lambert.
DISCUSSION
We tested the hypothesis that the relationship between baseline visual field damage and rates of progression can be influenced, at least in part, by the scale used to measure contrast sensitivities (linear vs. logarithmic). We found that eyes with worse baseline visual field progressed at faster rates when sensitivity is measured in dB (as it is conventionally measured in commercially-available perimeters). However, when sensitivity is measured in 1/Lambert (linear scale), the association is in opposite direction, that is, worse baseline damage is predictive of slower global rates of progression. Because sensitivity (in 1/Lambert) is linearly correlated with structural loss (defined with retinal nerve fiver layer [RNFL] thickness),15 the definition of fast versus slow visual field progression should be based upon measurements in linear scale. If one classifies patients into fast versus slow progression based upon structure as reference, when measuring visual field damage and progression in dB (logarithmic scale), the rate of progression is underestimated in earlier stages and overestimated in more severe stages. As an example, an apparently slow rate of MD progression of −0.5 dB/year corresponds to a much greater loss in visual field sensitivity in a patient with early glaucoma than in a patient with more severe disease during a similar follow-up time.
Glaucoma is a disease that results from the loss of RGCs and their axons (RNFL) as they converge to the optic nerve.16 It is intuitive that patients with early stage glaucoma are at risk of losing more of the absolute count of RGCs over their lifetime than patients with severe glaucoma. In fact, studies have suggested that 30 to 50% of RGCs have to be lost before there is a statistically significant loss on SAP measured in dB.17,18 Eventually, the rate of RGC loss slows down until the rate approaches zero (“floor effect’). This means that the significant losses of RGC that occur at the beginning of the disease would correlate with small changes in MD in logarithmic scale (dB), but greater changes in linear scale (1/Lambert).19
Because of the non-linear relationship between RNFL loss and visual field sensitivity deviation in dB,15,19 there has been much debate regarding the structure vs. function relationships in glaucoma.20 Abe et al. recently suggested that eyes with less severe disease at baseline had a higher chance of being detected as progressing with structural measures (optical coherence tomography, OCT) but not by SAP, whereas an increase in disease severity at baseline increased the chance that the eye would be detected as progressing with SAP but not OCT.21
Our study applies the framework described by Hood and Kardon 15 in which there is a linear relationship between RNFL thickness measured with OCT and visual field damage measured with SAP in linear scales. We did not employ OCT in the present study; nonetheless, the conversion of MD values from logarithmic to linear scales provides a proxy of RNFL structural loss measured with OCT.15 Note that we oversimplified our analysis by directly converting MD values to linear scale, instead of first converting pointwise sensitivities and then averaging them out into mean sensitivities. Although such approach is recommended when investigating structure versus function relationships,15 it should not affect the relationship between baseline MD and MD slopes in a meaningful way.
In a related study, Gardiner et al.14 compared the ability of baseline visual field indices to predict future rates of visual field progression among glaucoma patients (with MD better than −6 dB) and ocular hypertensives (normal visual fields). They analyzed six different indices, including the MD and the estimated RGC density/number based upon the Harwerth et al.17 and Garway-Heath et al.22 models. All indices were later converted to dB scale. Similar to our findings in dB, they found that visual field status was predictive of subsequent rate of progression, (i.e.: worse baseline status was associated with faster progression).
In patients with more severe baseline visual fields, escalation of therapy may have introduced bias to our analyses; that is, eyes with more severe damage were treated more aggressively, which may have resulted in slower rates of progression. Unbiased studies on untreated patients should provide a more conclusive understanding on the relationship between baseline visual field severity and future rates of progression, although such studies are impractical due to ethical reasons. The results of the Early Manifest Glaucoma Trial (EMGT) and Advanced Glaucoma Intervention Study (AGIS) illustrate the hypothesis that the relationship between baseline severity and future progression depends on the range of severity of the study sample. In the EMGT, worse baseline visual fields were associated with greater progression risk,23 whereas in the AGIS, less baseline visual field defect was associated with sustained decrease of visual field in both treatment arms.24 Regardless of these differences, our study aims to show that if the definition of “fast” and “slow” functional progression is based upon the corresponding rate of structural loss, rates of visual field change measured in linear scale provide more realistic estimates of the speed of progression and are less influenced by baseline severity. As concluded by Gardiner et al.,14 linearly scaled indices may offer benefits over current indices as logarithmic-scaled testing algorithms may complicate the understanding of the relationships between baseline severity and rates of progression.
In mild glaucoma, the rate of progression in 1/Lambert was shown to be very fast, but as glaucoma progresses to more severe stages, the rate slows down, until it becomes asymptotic, analogous to the “floor effect” described above. In fact, not only the flor effect may explain these deceleration, but also the fact that treatment usually advances as disease progresses, further slowing the rates of progression. Moreover, once threshold sensitivities reach values of 15–19 dB, visual field testing becomes more unreliable due to the asymptotic maximum response probability associated with RGC response saturation.25
Our results may have important clinical implications. When treating different glaucoma patients, physicians often determine a target rate of visual field progression. These target rates are based upon different variables, such as baseline damage and life expectancy. Our findings suggest that patients with early stage glaucoma should have a slower target rate of progression in dB/year than patients with more severe glaucoma. For example, −0.5 dB/year is normally considered to be an average to slow rate of progression.2 However, there is a significant difference in the actual loss of sensitivity in linear scales (which are correlated with RGC and RNFL loss)15,19 between patients with severe and mild glaucoma that share this same rate in dB/year. While −0.5 dB/year may be a reasonable target rate to be achieved in patients with severe glaucoma, the same rate of loss would be too fast mild glaucoma. To match a similar rate of progression (-0.5 dB/year) but in linear scales (1/Lambert/year), the target rate for a patient with early damage should be around −0.045 dB/year (Table 3). In fact, using data from the Ocular Hypertension Treatment Study (OHTS), the mean MD rate of progression decreased from −0.23 to −0.06 dB/year (P< 0.01) after treatment initiation,26 a speed of progression close to suggested above.
Table 3.
Estimates of mean deviation rates of change (in dB/year) matched for the same amount of sensitivity loss in linear scale (1/Lambert/year).
| Mild (MD>-6 dB) | Moderate (-12<MD<-6 dB) | Severe (MD<-12 dB) |
|---|---|---|
| −0.045 dB/year | −0.14 dB/year | −0.5 dB/year |
| −0.08 dB/year | −0.30 dB/year | −1.0 dB/year |
| −0.1 dB/year | −0.45 dB/year | −2.0 dB/year |
In conclusion, we found a significant relationship between baseline MD and rate of progression measured in linear and logarithmic scales, though in different directions. For a given similar rate of progression, conventionally measured in dB/year, eyes with different levels of baseline damage can have very different rates of progression that reflect their rate of loss of RGC and RNFL thickness. The concepts of slow vs. fast rates of visual field progression should be revised and preferably customized for individual patients in light of the findings described in the present study.
Acknowledgments
Supported by: National Eye Institute Grant EY025253 (CGDM); unrestricted departmental grant from Research to Prevent Blindness, New York, NY (Department of Ophthalmology, Columbia University Medical Center; and the Edith C. Blum Foundation, New York, NY.
Footnotes
Financial disclosures:
K.L: None.
C.G.D.M.: Consultant– SENSIMED AG; Grants – Carl Zeiss Meditec, Inc.;
J.M.L.: Consultant − Alcon Laboratories Inc., Allergan Inc., Carl Zeiss Meditec Inc., Dyopsis Inc., Pfizer Inc., Topcon Medical Systems Inc.
References
- 1.Vianna JR, Chauhan BC. How to detect progression in glaucoma. Progress in brain research. 2015;221:135–158. doi: 10.1016/bs.pbr.2015.04.011. [DOI] [PubMed] [Google Scholar]
- 2.Chauhan BC, Garway-Heath DF, Goni FJ, et al. Practical recommendations for measuring rates of visual field change in glaucoma. The British journal of ophthalmology. 2008;92(4):569–573. doi: 10.1136/bjo.2007.135012. [DOI] [PMC free article] [PubMed] [Google Scholar]
- 3.Spry PG, Johnson CA. Identification of progressive glaucomatous visual field loss. Survey of ophthalmology. 2002;47(2):158–173. doi: 10.1016/s0039-6257(01)00299-5. [DOI] [PubMed] [Google Scholar]
- 4.Gordon MO, Beiser JA, Brandt JD, et al. The Ocular Hypertension Treatment Study: baseline factors that predict the onset of primary open-angle glaucoma. Archives of ophthalmology (Chicago, Ill.: 1960) 2002;120(6):714–720. doi: 10.1001/archopht.120.6.714. discussion 829–730. [DOI] [PubMed] [Google Scholar]
- 5.Leske MC, Heijl A, Hyman L, Bengtsson B, Dong L, Yang Z. Predictors of long-term progression in the early manifest glaucoma trial. Ophthalmology. 2007;114(11):1965–1972. doi: 10.1016/j.ophtha.2007.03.016. [DOI] [PubMed] [Google Scholar]
- 6.Musch DC, Gillespie BW, Lichter PR, Niziol LM, Janz NK. Visual field progression in the Collaborative Initial Glaucoma Treatment Study the impact of treatment and other baseline factors. Ophthalmology. 2009;116(2):200–207. doi: 10.1016/j.ophtha.2008.08.051. [DOI] [PMC free article] [PubMed] [Google Scholar]
- 7.Fujino Y, Asaoka R, Murata H, et al. Evaluation of Glaucoma Progression in Large-Scale Clinical Data: The Japanese Archive of Multicentral Databases in Glaucoma (JAMDIG) Investigative ophthalmology & visual science. 2016;57(4):2012–2020. doi: 10.1167/iovs.15-19046. [DOI] [PubMed] [Google Scholar]
- 8.Forchheimer I, de Moraes CG, Teng CC, et al. Baseline mean deviation and rates of visual field change in treated glaucoma patients. Eye (London, England) 2011;25(5):626–632. doi: 10.1038/eye.2011.33. [DOI] [PMC free article] [PubMed] [Google Scholar]
- 9.Lee JM, Caprioli J, Nouri-Mahdavi K, et al. Baseline prognostic factors predict rapid visual field deterioration in glaucoma. Investigative ophthalmology & visual science. 2014;55(4):2228–2236. doi: 10.1167/iovs.13-12261. [DOI] [PubMed] [Google Scholar]
- 10.Rao HL, Kumar AU, Babu JG, Senthil S, Garudadri CS. Relationship between severity of visual field loss at presentation and rate of visual field progression in glaucoma. Ophthalmology. 2011;118(2):249–253. doi: 10.1016/j.ophtha.2010.05.027. [DOI] [PubMed] [Google Scholar]
- 11.Rao HL, Begum VU, Khadka D, Mandal AK, Senthil S, Garudadri CS. Comparing glaucoma progression on 24–2 and 10–2 visual field examinations. PloS one. 2015;10(5):e0127233. doi: 10.1371/journal.pone.0127233. [DOI] [PMC free article] [PubMed] [Google Scholar]
- 12.Folgar FA, de Moraes CG, Prata TS, et al. Glaucoma surgery decreases the rates of localized and global visual field progression. American journal of ophthalmology. 2010;149(2):258–264.e252. doi: 10.1016/j.ajo.2009.09.010. [DOI] [PubMed] [Google Scholar]
- 13.Caprioli J, de Leon JM, Azarbod P, et al. Trabeculectomy Can Improve Long-Term Visual Function in Glaucoma. Ophthalmology. 2016;123(1):117–128. doi: 10.1016/j.ophtha.2015.09.027. [DOI] [PubMed] [Google Scholar]
- 14.Gardiner SK, Demirel S, Johnson CA, Swanson WH. Assessment of linear-scale indices for perimetry in terms of progression in early glaucoma. Vision research. 2011;51(16):1801–1810. doi: 10.1016/j.visres.2011.06.009. [DOI] [PMC free article] [PubMed] [Google Scholar]
- 15.Hood DC, Kardon RH. A framework for comparing structural and functional measures of glaucomatous damage. Progress in retinal and eye research. 2007;26(6):688–710. doi: 10.1016/j.preteyeres.2007.08.001. [DOI] [PMC free article] [PubMed] [Google Scholar]
- 16.Weinreb RN, Khaw PT. Primary open-angle glaucoma. Lancet (London, England) 2004;363(9422):1711–1720. doi: 10.1016/S0140-6736(04)16257-0. [DOI] [PubMed] [Google Scholar]
- 17.Harwerth RS, Carter-Dawson L, Smith EL, 3rd, Barnes G, Holt WF, Crawford ML. Neural losses correlated with visual losses in clinical perimetry. Investigative ophthalmology & visual science. 2004;45(9):3152–3160. doi: 10.1167/iovs.04-0227. [DOI] [PubMed] [Google Scholar]
- 18.Quigley HA, Dunkelberger GR, Green WR. Retinal ganglion cell atrophy correlated with automated perimetry in human eyes with glaucoma. American journal of ophthalmology. 1989;107(5):453–464. doi: 10.1016/0002-9394(89)90488-1. [DOI] [PubMed] [Google Scholar]
- 19.Medeiros FA, Zangwill LM, Bowd C, Mansouri K, Weinreb RN. The structure and function relationship in glaucoma: implications for detection of progression and measurement of rates of change. Investigative ophthalmology & visual science. 2012;53(11):6939–6946. doi: 10.1167/iovs.12-10345. [DOI] [PMC free article] [PubMed] [Google Scholar]
- 20.Medeiros FA, Tatham AJ. Structure versus Function in Glaucoma: The Debate That Doesn’t Need to Be. Ophthalmology. 2016;123(6):1170–1172. doi: 10.1016/j.ophtha.2016.03.023. [DOI] [PubMed] [Google Scholar]
- 21.Abe RY, Diniz-Filho A, Zangwill LM, et al. The Relative Odds of Progressing by Structural and Functional Tests in Glaucoma. Investigative ophthalmology & visual science. 2016 Oct;57(9):421–428. doi: 10.1167/iovs.15-18940. [DOI] [PMC free article] [PubMed] [Google Scholar]
- 22.Garway-Heath DF, Caprioli J, Fitzke FW, Hitchings RA. Scaling the hill of vision: the physiological relationship between light sensitivity and ganglion cell numbers. Investigative ophthalmology & visual science. 2000;41(7):1774–1782. [PubMed] [Google Scholar]
- 23.Leske MC, Heijl A, Hussein M, Bengtsson B, Hyman L, Komaroff E. Factors for glaucoma progression and the effect of treatment: the early manifest glaucoma trial. Archives of ophthalmology (Chicago, Ill.: 1960) 2003;121(1):48–56. doi: 10.1001/archopht.121.1.48. [DOI] [PubMed] [Google Scholar]
- 24.The Advanced Glaucoma Intervention Study (AGIS): 12. Baseline risk factors for sustained loss of visual field and visual acuity in patients with advanced glaucoma. American journal of ophthalmology. 2002;134(4):499–512. doi: 10.1016/s0002-9394(02)01659-8. [DOI] [PubMed] [Google Scholar]
- 25.Gardiner SK, Swanson WH, Goren D, Mansberger SL, Demirel S. Assessment of the reliability of standard automated perimetry in regions of glaucomatous damage. Ophthalmology. 2014;121(7):1359–1369. doi: 10.1016/j.ophtha.2014.01.020. [DOI] [PMC free article] [PubMed] [Google Scholar]
- 26.De Moraes CG, Demirel S, Gardiner SK, et al. Effect of treatment on the rate of visual field change in the ocular hypertension treatment study observation group. Investigative ophthalmology & visual science. 2012;53(4):1704–1709. doi: 10.1167/iovs.11-8186. [DOI] [PMC free article] [PubMed] [Google Scholar]