Abstract
A key tenet of Feature Integration Theory and related theories such as Guided Search (GS) is that the binding of basic features requires attention. This would seem to predict that conjunctions of features of objects that have not been attended should not influence search. However, Found (1998) reported that an irrelevant feature (size) improved the efficiency of search for a color × orientation conjunction if it was correlated with the other two features across the display compared to the case where size was not correlated with color and orientation features. We examine this issue with somewhat different stimuli. We use triple conjunctions of color, orientation and shape (e.g. search for a red, vertical, oval-shaped item). This allows us to manipulate the number of features that each distractor shares with the target (Sharing) and it allows us to vary the total number of distractor types (and, thus, the number of groups of identical items; Grouping). We find these triple conjunction searches are generally very efficient – producing very shallow reaction time (RT) × set size slopes, consistent with strong guidance by basic features. Nevertheless, both of these variables, Sharing and Grouping modulate performance. These influences are not predicted by previous accounts of GS. However, both can be accommodated in a GS framework. Alternatively, it is possible, if not necessary, to see these effects as evidence for “preattentive binding” of conjunctions.
In a typical visual scene, many objects will share features with each other. There may be several big things, several blue things, several shiny things, and so forth. Consequently, looking for a specific object is likely to entail search for a conjunction of features (the big, blue, shiny thing). Conjunction searches have been a subject of considerable interest in the visual search literature for many years. In her original “Feature Integration Theory (FIT)”, Treisman classified conjunction searches as “serial” as contrasted with “parallel” feature searches (Treisman & Gelade, 1980). Central evidence for this claim came from the functions relating set size (the number of items in a search display) to reaction time (RT). For salient features (e.g. red among green or big among small), the slope of the RT × set size function was near zero, suggesting that there was no additional cost of added distractor items. For conjunction searches, in contrast, RT increased linearly with set size. Each additional distractor imposed a cost. The data were consistent with a serial search through the items at a rate of 20–40 items per second. It should be noted that the same data are also consistent with various versions of parallel models in which all items are processed at the same time (Townsend, 1971; Townsend & Wenger, 2004) but where noise or capacity limitations cause a rise in RT with set size (Palmer, 1995).
A key theoretical claim of FIT was that the features forming conjunctions could not be ‘bound’ without the application of selective attention. However, whether or not conjunction identification required serial binding, subsequent work made it clear that conjunction search did not need to be particularly inefficient. With salient component features, conjunction searches tended to produce RT × set size slopes that were intermediate between the most efficient feature searches and the least efficient basic searches in which items were big enough to be identified without requiring fixation (e.g. Ts among Ls or 2s among 5s) (Egeth, Virzi, & Garbart, 1984; Dick, Ullman, & Sagi, 1987; McLeod, Driver, Dienes, & Crisp, 1991; Nakayama & Silverman, 1986; Treisman & Sato, 1990; Wolfe, Cave, & Franzel, 1989). There is a continuum of search efficiency from highly efficient feature searches to inefficient searches for items defined by their spatial configurations (like Ts and Ls) (Wolfe, 1998).
Guided Search (GS) Theory is one approach to understanding this continuum (Eckstein, 1998; Wolfe, 1994, 2007; Wolfe, et al., 1989). GS preserves the central role for binding via selective attention. According to GS, relatively efficient conjunction search occurs because basic features can be used to guide attention to items that are more likely to be the target item. Thus, in a search for a red vertical item, attention can be guided to red items and to vertical items; the intersection of those two sets being an excellent place to look for red vertical items. The claim of FIT and GS is that the red vertical item is not bound and recognized until the item falls under the ‘spotlight’ of selective attention. Various other experimental results (Driver, McLeod, & Dienes, 1992; Duncan, 1995; Enns & Rensink, 1990; Roggeveen, Kingstone, & Enns, 2004) and various other theoretical formulations propose that features can be bound without the need to focus selective attention on the item (McElree & Carrasco, 1999; Palmer, 1995). The “Similarity” model proposed by Duncan and Humphreys put an emphasis on the role of grouping of items by similarity (Duncan & Humphreys, 1989), including the grouping of items whose similarity was based on the binding of features without attention (Humphreys, Quinlan, & Riddoch, 1989). GS argued against such preattentive binding (Wolfe, 1992).
Found (1998) put these competing claims to an interesting test. He had participants search for tilted red lines among tilted white and vertical red lines. The critical manipulation was an irrelevant variation in a third variable, size. Items were either big or small, and the size of items was either correlated with the color and orientation of items or not. In the correlated case, within a trial, all items of one conjunction type had the same size and all items of the other conjunction type had the other size. For example, red vertical items might be big while all white tilted items might be small; however, the specific relationship between size and the orientation × color varied from trial to trial. When size was uncorrelated, the size varied randomly with the orientation × color conjunctions within a trial, with the restriction that half the elements in a trial were big and half were small. In both cases, the target item were equally likely to be either big or small, thus, size was uninformative of target presence. Found reasoned that GS should not care about whether the irrelevant size variable was tied to the task relevant feature dimensions or not. If features were processed independently, prior to the arrival of attention, the contribution of size would be the same in the two conditions. However, the results showed that the strongly correlated case was more efficient. Found argued that the size correlated case had two groups of items (e.g. big red vertical and small white tilted) while the size uncorrelated case had four. The displays with more and smaller groups looked ‘noisier’ and were somewhat harder to search through. Found considers this to be consistent with a Similarity Theory in which “preattentive vision delivers bound sets of features that relate to the same segmented object” (Found, 1998, p. 1123) and not consistent with GS which would not deliver such preattentive bindings. Proulx (2007) expanded on these considerations and found that salient, task-irrelevant singleton features influence search efficiency. This led Proulx to propose that both GS and Similarity Theory understate the role of bottom-up saliency in conjunction searches (Proulx, 2007).
There is good evidence that feature conjunctions can influence behavior even for conjunction items that GS and similar serial theories assume are available only preattentively or with minimal attention. For example, Mordkoff, Yantis, & Egeth (1990) had observers look for Red X targets in displays with other items that could be red or Xs but not both. In displays of two or six items, the critical comparison was between trials with one or two Red Xs. RTs are faster when there are two (redundancy gain, see also Pashler, 1987). Importantly for the argument, the RTs are faster than would be predicted if each conjunction needed to be processed separately (Mordkoff, Yantis, Egeth, 1990). Mordkoff et al. argue that, in a redundant display, both Red Xs can be processed as conjunctions of red and X at the same time.
Converging evidence for this sort of preattentive processing of conjunctions comes from Mordkoff and Halterman’s (2008) “correlated flankers task”. In the standard flanker task, observers might be shown groups of three letters and told to hit the left key if the middle letter was an A and the right key if the middle letter was a B (C W Eriksen & Hoffman, 1973; B A Eriksen & C W Eriksen, 1974). The standard finding is that it will take a little longer to respond if the flanking letters are incongruent with the central letter (BAB and ABA) than if the flankers are congruent (AAA, BBB). In Mordkoff and Halterman’s (2008) version of the task, the target was a color shape conjunction (e.g. Red Square) and the flankers were other conjunctions that could be correlated with the target. Thus, Blue Diamond flankers might be correlated with Red Square though blue and diamond by themselves were not. These conjunctive flankers have an effect on RT to the target, indicating that the combination of blue and diamond has been registered.
There is a long running debate about the source of the flanker effect. The original hypothesis was that the flanker effect was evidence that the flanker letters were processed without attention because attention was directed to the central letter. Later work questioned the assumption that one could completely deny attention to the flankers. For instance, Lavie and Tsal (1994) argued that, if the central task was not very demanding, some attentional resources would spill over to process the flankers. Kyllingsbæk, Sy, & Giesbrecht (2011) demonstrated that this load effect on the flanker task can also be explained by a parallel model with limited processing capacity and limited visual working memory. Regardless of one’s position on this continuing debate (Tsal and Benoni, 2010; Lavie and Torralbo, 2010), results like those of Mordkoff and Halterman (2008) do indicate that, under some circumstances, the conjoint appearance of basic feature in an object can be processed with little or no attention.
Krummenacher and colleagues find evidence for coactivation of multiple features in visual search tasks (Krummenacher et al., 2001, 2002; Krummenacher, Grubert, & Müller, 2010;). As in the Mordkoff work, conjunctions of color and shape produce RTs that are too fast to be explained if the two features are not being combined in some manner. Their “dimension weighting” solution to this problem is a modification of the GS.
In this paper, we use higher order conjunctions to revisit this issue of preattentive processing of the combinations of basic features. By higher order conjunctions, we mean targets that are defined by more than two features. In the real world, most objects in a complex environment would need to be defined by multiple features. Moreover, as will be seen, higher order conjunctions give us other tools with which to address the question of conjunctive target feature guidance and preattentive effects of feature conjunctions separately. Earlier work with triple conjunctions has provided evidence for an ability to guide attention on the basis of multiple dimensions (Dehaene, 1989; Quinlan & Humphreys, 1987). Consistent with either GS or Similarity Theory, it is easier to find a triple conjunction if distractors share just one feature with the target, than if they share two (Wolfe, et al., 1989). Typically, some features seem to guide more effectively than other, with color being a frequent winner (Williams & Reingold, 2001).
The basic puzzle
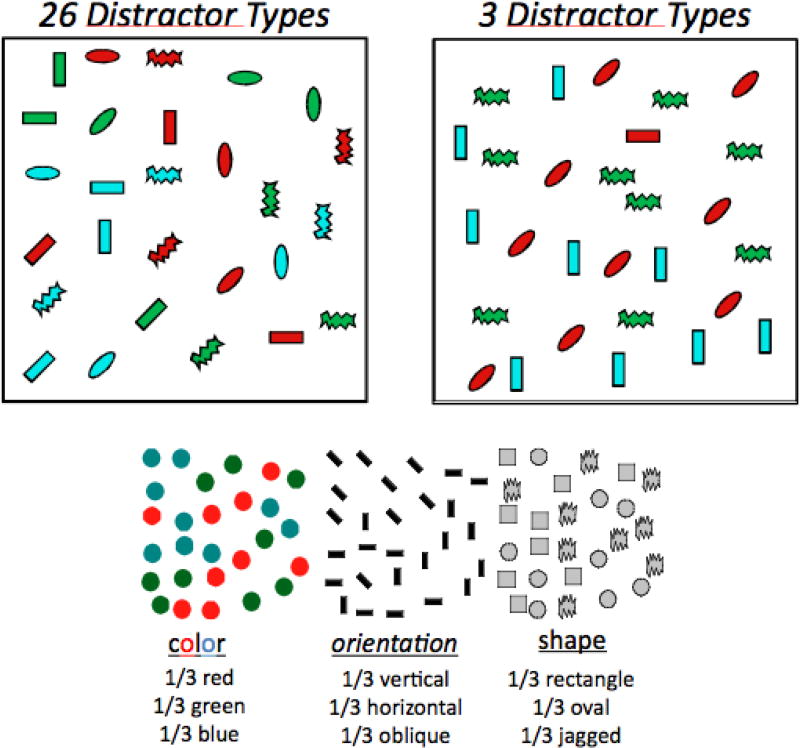
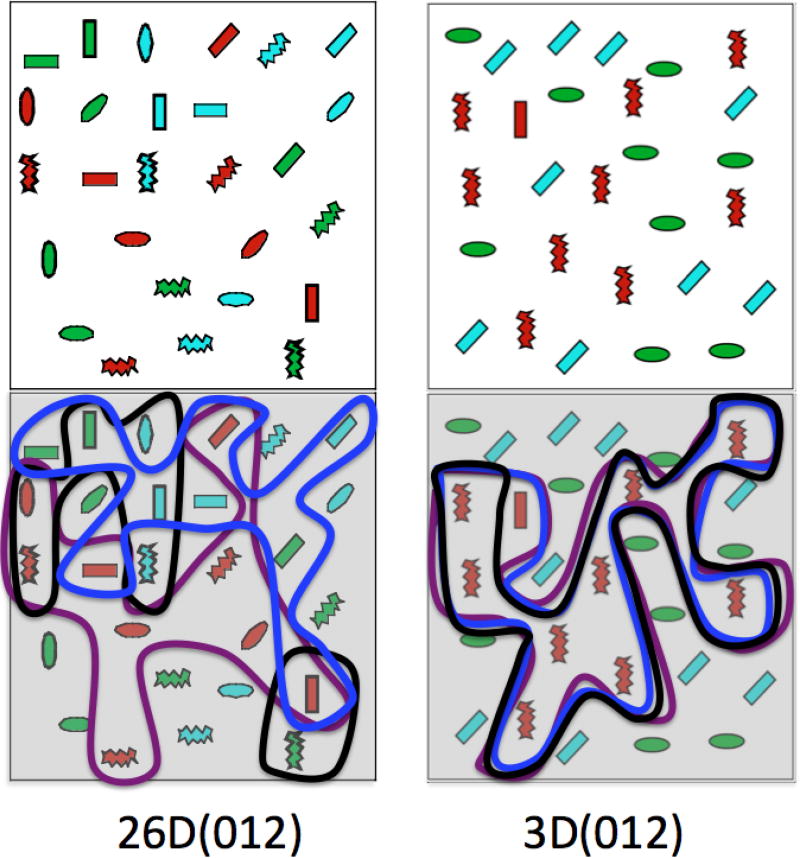
Figure 1 illustrates the basic challenge to models like GS posed by Found’s work. The target in each case is a horizontal red rectangle. This is a triple conjunction task because some distractor items are red, some are horizontal, and some are rectangles. No single feature is adequate to do the task. In each case, one third of the items have the target properties. That is, both examples contain one third red items, one third horizontal, and one third rectangles. A standard model with separate representations for each dimension would see no preattentive differences between the two conditions. The difference between the conditions lies in the combinations of the features. On the left, every combination of the three values of the three feature dimensions is present; leading to a display with a target and 26 distractors types. On the right, only three of the 26 distractor types are used. However, the distribution of the individual features is the same in both displays; each feature is represented equally often. It is probably intuitively clear that the 3 Distractor case is easier than the 26 Distractor case. Experiment 1a tests this intuition and shows that it can be supported by data.
Figure 1.
It seems intuitively clear (and will be shown empirically below) that it is harder to find a red, horizontal rectangle in the left image than in the right, even though both sets of stimuli have 1/3 red items, 1/3 horizontal items, and 1/3 rectangular shapes.
Experiment 1a
In seven experiments, we examine guidance of attention in visual search for targets defined by 3 or 6 features. We look for and find evidence that cannot be explained by guidance by representations of independent stimulus attributes and we consider whether these findings require a mechanism of preattentive binding. In Experiment 1a, we provide empirical support for the impression that triple conjunctions are easier to find when there are fewer types of distractor items.
Participants
Thirteen paid volunteers (four women) participated in the experiment. Age information was available for 12 out of the 13 participants, for these participants the age range was 19 to 47. The participants had normal or corrected to normal 20/25 vision, no history of eye or muscular disorders, and no color vision deficits when tested on Ishihara’s tests for color blindness (Ishihara, 1987). All participants gave informed consent prior to participation. One participant was excluded from the data analysis due to excessive miss rates. The miss rates of this participant exceeded the mean miss rate across all other participants by over two standard deviations.
Apparatus
The stimuli were presented on Apple Macintosh OS X 10.5.8 computers. The experiments were run using the Psychophysics toolbox in MatLab 7.5.0 (R2007b). Each computer was connected to a 20” CRT screen, and the screen resolution was 1280 × 960 pixels with a refresh rate of 85 Hz. Participants were freely viewing the screen at a distance of approximately 60 centimeters. Responses were collected using a standard U.S. Apple keyboard.
Stimuli
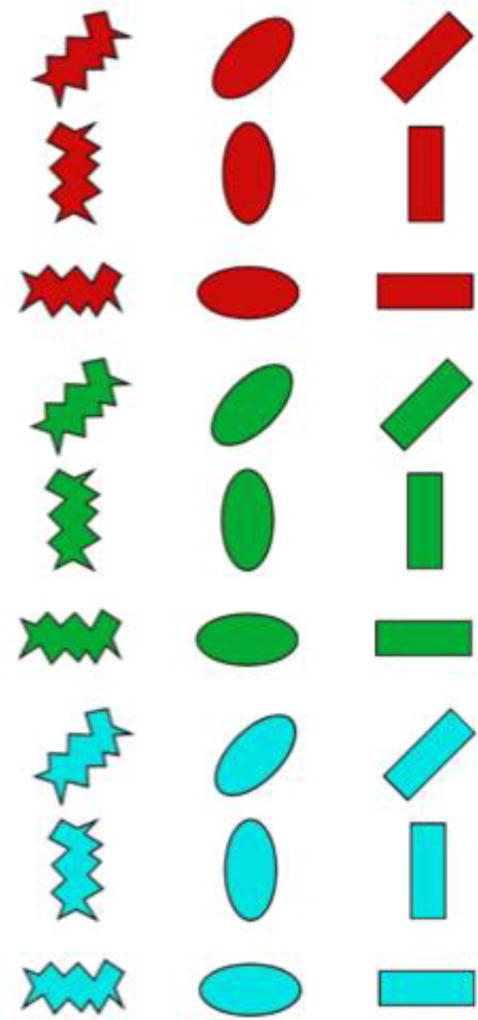
The stimulus set consisted of elements that had one of three features in each of the three feature dimensions color, shape, and orientation. A stimulus element could be red (RGB: 200, 0, 0), green (RGB: 0, 170, 45) or blue (RGB: 0, 230, 230); vertical (0°), oblique (45°) or horizontal (90°); rectangular, oval or jagged. There were thus 27 possible types of feature conjunctions (see Figure 2 for the basic stimulus set).
Figure 2.
The 27 items defined by 3 colors X 3 shapes X 3 orientations.
In Experiment 1a, all participants searched for the same target: a red, vertical rectangle. Four distractor sets were used. In the first distractor set, all of the possible conjunction types, excluding the target, made up the set (as the first display in Figure 1). We call this the 26 conjunction (26D) set. Distractor sets two and three each consisted of three conjunction types. These two conditions differed in how many features each distractor type shared with the target. In one of the three-distractor conditions, the distractors were red, vertical ovals (sharing two features with the target); blue horizontal rectangles (one shared feature); and green, oblique zigzag shapes (no shared features). This condition will be designated 3D(012). In the other three-distractor condition, the distractors were red, oblique ovals; green, vertical zigzag shapes; and blue, horizontal rectangles. Each distractor shared one feature with the target; hence, this condition is designated 3D(1). The fourth and last distractor set in Experiment 1a was a 5D set and consisted of a red, vertical zigzag shape (share 2); a red, vertical oval (share 2); a green, oblique rectangle (share 1); a blue, horizontal zigzag shape (share none); a blue, horizontal oval (share none). In the 26D and 3D sets, the proportions of basic features remain the same: one third of the items having each color, each orientation, and each shape. In the 5D set there were fewer representations of green, rectangular, and oblique than of the other features. Importantly, in all conditions, the distractors shared one feature with the target on average.
Display set size was 27 on half the trials and 54 on the other half. These set sizes were picked so that all 26 distractors plus a target could be presented on a single trial. When distractor sets were subsets of the full set, distractors were repeated in a display. Equal (or almost equal) numbers of each distractor were presented on each trial. When the number of distractors did not divide evenly into the set size (in the 5D condition), the required additional distractors were drawn at random without replacement from the current distractor set.
The stimuli were presented on a white background (RGB: 255, 255, 255) in an eight × eight matrix, with a diameter of 950 pixels and centered on the screen. The stimulus elements were randomly presented in the 64 tiles of the matrix. Each element was placed in the center of a randomly chosen unoccupied tile and jittered a few pixels in order to avoid alignment of elements.
Procedure
Participants were instructed to look for the target, defined by three target features (i.e., the red, vertical rectangle), and to respond as quickly and accurately as possible as to whether the target element was present or absent. The target remained the same across the whole experiment. Responses were made by pressing the predetermined “present” or “absent” key on the keyboard. The two response keys were marked by a red and a blue sticker on top of the A key and the L key, respectively. Participants were instructed to place each of their index fingers on top of each of the two keys. Targets were present on half the trials.
Each trial followed the same sequence of events. First, the description of the three target features appeared in the center of the screen for 500 msec accompanied by a warning beep. This was followed by a stimulus display that remained present on screen until the participant responded. After the response, a screen showing the trial number, accuracy feedback, and the reaction time for that trial was displayed for 500 msec. If an error response was made, three error beeps would sound, concurrent with the presentation of the feedback screen. After the feedback, the next trial was initiated after a 1000 msec delay.
Participants started the experiment by completing 10–30 practice trials and 900 experimental trials with presentations of all display types intermixed pseudo-randomly.
Data Analysis
Reaction time (RT) data were trimmed by removing “outlier” trials with reaction times more than three standard deviations greater than the mean of that participant. Trials with RTs below 200 msec were also removed from the analysis.
RT data and accuracy data were examined separately by repeated-measures analyses of variance (ANOVA) with factors: distractor condition and set size. In the following, Greenhouse-Geisser corrected p-values are reported where Mauchly’s test revealed that sphericity could not be assumed. The analyses were carried out separately for target-present and target-absent trials. For the RTs, we were particularly interested in whether the distractor sets significantly influenced search efficiency. Hence, when the general RT ANOVA revealed a significant interaction between set size and distractor condition, the relevant distractor conditions were compared by post-hoc ANOVAs or Student’s t-tests. Post-hoc p-values were Bonferroni-Holm corrected. For the error data, our primary interest was to ensure that speed-accuracy trade-offs were not contributing substantially to reaction time differences for the various distractor conditions. Therefore, when the error rate ANOVA revealed a significant effect of distractor set, the error rates were further investigated. For all ANOVAs generalized eta square (ges) is reported for effect sizes.
Results & Discussion
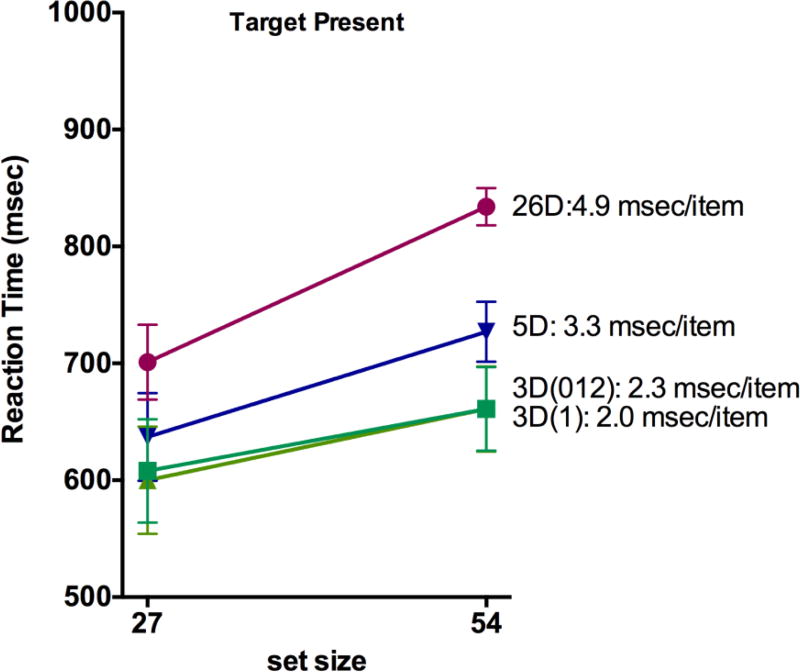
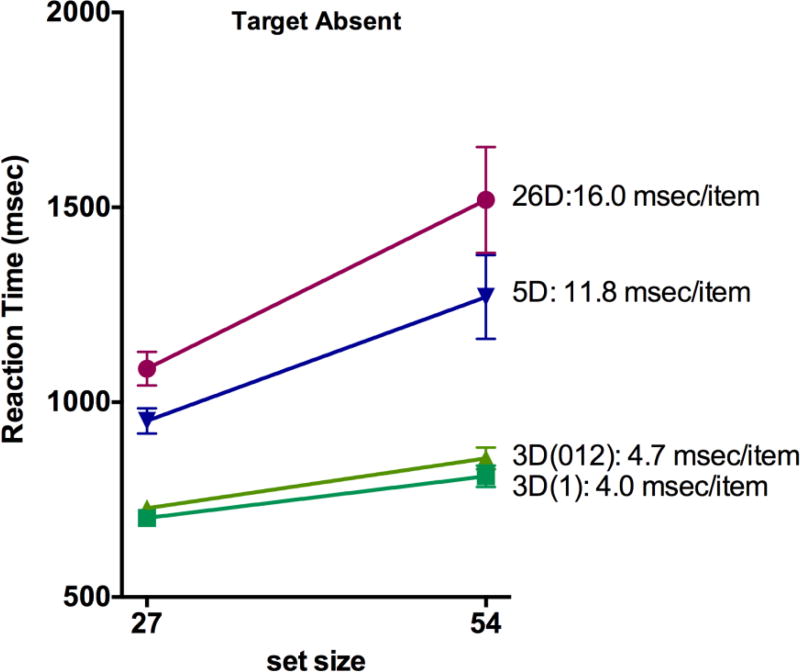
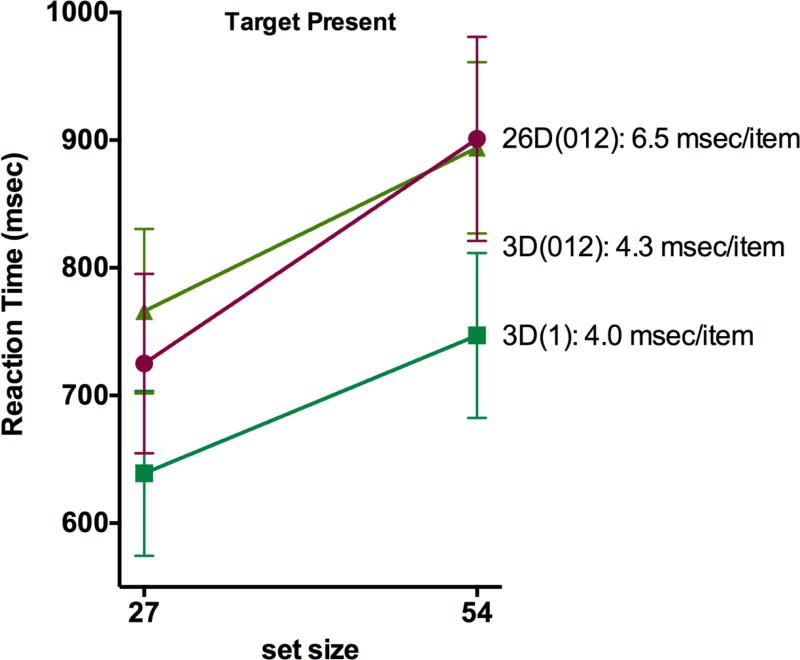
Using the outlier procedure described above, 2.1 % of the trials were removed from further analysis. Mean RTs are shown in Figure 3. First, they confirm that triple conjunction searches are very efficient when the target shares an average of one feature with the distractors. Note that all target-present slopes are less than 5 msec/item. Second, the results show reliable differences between the conditions, even though the feature maps should be equivalent in four of the five conditions (the 5D condition had slightly fewer green, oblique, and rectangular items).
Figure 3.
Mean RTs for Experiment One. Error bars are +/− 1 within-observer s.e.m. using the method of Cousineau (2005), corrected as suggested by Morey (2008, Cousineau & O’Brian, 2014). In some cases, error bars fall within the graphed datapoint.
Reaction times
The reaction time ANOVAs revealed that the effects of distractor condition and the interaction between distractor condition and set size were significant, for both target present and absent trials. In general, reaction times and search efficiency increased when the number of conjunction types in the distractor sets increased. For the target present trials, the two 3D - 26D slope comparisons were significant, as was the 5D – 3D(1) comparison. For the target absent trials, all slope comparisons, except the 3D(1) – 3D(012) comparison, were significant. The results thus indicate that the searches were more efficient when fewer conjunction types were present, and that this pattern is more pronounced for the target-absent trials.
Error rates
There were 255 errors out of the 5602 target-present trials that were not removed by the outlier procedure, and 115 error trials out of the 5337 target-absent trials. Investigations of the error rates revealed no significant effects for the target-present trials. For the target-absent trials, there was a significant main effect of distractor set (see Table 2), however, none of the separate distractor type comparisons revealed any significant effects. Numerically, the error rates followed the pattern suggested by the RTs, with higher error rates for the 26D condition (5,6 % errors), intermediate for the 5D condition (1.7 %) and lowest for the 3D conditions (< 0.1 %). The error rate analyses thus do not suggest a speed-accuracy trade-off.
Table 2.
Error rate analysis of variance for Experiments 1a, 1b, 2, 3, 6, and 7. Only significant effects are reported. GGe denotes the Greenhouse-Geisser epsilon and is reported when significant; ges denotes generalized eta squared.
| Experiment | Target | F | df | GGe | p | ges | |
|---|---|---|---|---|---|---|---|
| 1A | Absent | Distractor | 5.12 | 3, 33 | .37 | .040* | .16 |
| 1B | Present | Distractor | 4.49 | 2, 24 | n.s. | .022* | .11 |
| Set size | 8.31 | 1, 12 | n.s. | .014* | .07 | ||
| Absent | Distractor | 7.78 | 2, 24 | .51 | .016* | <.01 | |
| 2 – 8 pp | Present | Distractor | 10.71 | 4, 28 | n.s. | <.001*** | .31 |
| 2 – all pp | Present | Set Size | 7.20 | 1, 10 | n.s. | .023* | .01 |
| Distractor | 11.74 | 4, 40 | .42 | <.001*** | .24 | ||
| Absent | Distractor | 4.76 | 4, 40 | .36 | .35* | .04 | |
| 3 | Present | Distractor | 6.03 | 3, 36 | n.s. | .002** | .08 |
| Set size | 5.42 | 1, 12 | n.s. | .038* | .06 | ||
| Absent | Distractor | 7.38 | 3, 36 | .42 | .012* | .15 | |
| Set size | 5.24 | 1, 12 | n.s. | .041* | .03 | ||
| 6 | Present | Distractor | 36.03 | 3, 30 | .42 | <.001*** | .53 |
| Set size | 8.49 | 1, 10 | n.s. | .015* | .06 | ||
| Distractor × Set size | 4.15 | 3, 30 | n.s. | .014* | .08 | ||
| Absent | Distractor × Set size | 6.03 | 3, 30 | n.s. | .002** | .08 | |
| 7 | Present | Distractor | 21.35 | 4, 36 | n.s. | <.001*** | .37 |
| Set size | 39.42 | 1, 9 | n.s. | <.001*** | .10 |
corresponds to significance below .05 level,
corresponds to significance below .01 level,
corresponds to significance below .001 level.
Experiment 1b – replication
The results of Experiment 1a clearly indicate that the efficiency of search cannot be explained entirely by the activity in individual feature maps or their linear sum. If that were the case, there should be no difference between 26D and 3D searches. Even though all of these searches are very efficient, the 3D searches are easier than the 26D case.
In Experiment 1a, all participants searched for the same red horizontal rectangle. Moreover, replication is good practice. Accordingly, Experiment 1b is a replication of Experiment 1a with modest modifications. The 5D condition was dropped and the target conjunction varied between participants.
Method
Participants
Thirteen paid volunteers participated in the experiment (11 women), age range 20 – 51 years. All gave informed consent.
Target
The target conjunction was chosen randomly from the set of 27 stimulus elements for each participant and remained the same for the whole experiment for that participant.
Distractor conditions
The 26D(012), 3D(1), and 3D(012) distractor conditions of Experiment 1a were used. In Experiment 1b, the 3D distractor sets differed from participant to participant, being tied to the identity of the target.
Procedure
Participants started the experiment with 24 practice trials and continued with 600 experimental trials. After the practice trials, participants were informed of their average reaction time and error percentage, and instructed to be both fast and accurate. After every 100 trials, participants were encouraged to take a short break and informed of their average reaction time and error rate.
Results and discussion
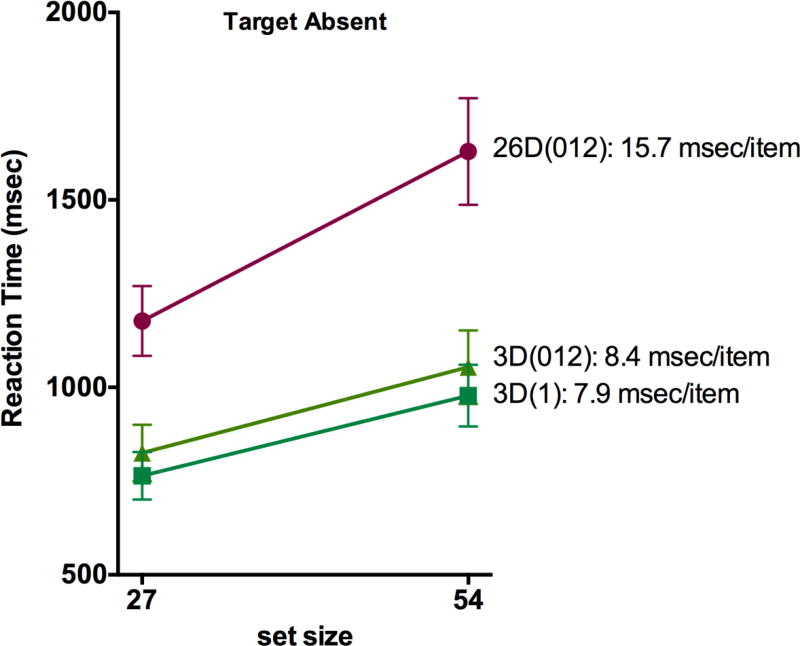
The outlier procedure resulted in a loss of less than 1.5 % of the trials. Figure 4 presents the participants’ mean reaction times for the three different distractor conditions as a function of set size for target-present and target-absent trials, respectively. As can be seen (cf. Figure 4 and Table 4), the basic pattern of results is similar to Experiment 1a with 26D being harder than 3D. In addition, we see a reaction time difference between 3D(1) and 3D(012) conditions; however there is no significant effect on search slopes. The differences, seen here, between 3D(012) and 3D(1) will be of interest in later experiments and were only very weakly seen in Experiment 1a. The fragility of these differences may be a floor effect. Both 3D(012) and 3D(1) are very efficient searches.
Figure 4.
Mean RTs for Experiment 1b. Error bars are +/− 1 within-observer s.e.m. using the method of Cousineau (2005), corrected as suggested by Morey (2008, Cousineau & O'Brien, 2014). In some cases, error bars fall within the graphed datapoint.
Table 4.
Reaction time analysis for Experiment 1a. GGe refers to Greenhouse-Geisser epsilon and is reported when significant, ges denotes generalized eta squared.
| Target present | Target absent | |||||||
|
|
||||||||
| Reaction time ANOVAs | ||||||||
|
| ||||||||
| Effect | F | GGe | p | ges | F | GGe | p | ges |
| Distractor cond (2, 24) | 38.87 | .65 | < .001*** | .086 | 48.60 | .51 | <.001*** | .293 |
| Set size (1, 12) | 61.01 | n.s. | < .001*** | .167 | 71.19 | n.s. | <.001*** | .192 |
| Distractor × Set (2, 24) | 7.86 | .97 | .003** | .001 | 17.21 | .70 | <.001*** | .026 |
|
| ||||||||
| Reaction time – distractor type main effect | ||||||||
|
|
||||||||
| Comparison | F(1,12) | p | ges | F(1,12) | p | ges | ||
|
| ||||||||
| 26D(012) – 3D(012) | 48.95 | <.001*** | .12 | 55.98 | <.001*** | .32 | ||
| 3D(012) - 3D(1) | 69.29 | <.001*** | .05 | 105.07 | <.001*** | .02 | ||
|
| ||||||||
| Slope – distractor type × set size interaction | ||||||||
|
|
||||||||
| Comparison | F(1,12) | p | ges | F(1,12) | p | ges | ||
|
| ||||||||
| 26D(012) – 3D(012) | 10.00 | .008** | .01 | 26.09 | <.001*** | .03 | ||
| 3D(012) - 3D(1) | 0.08 | .784 | <.01 | 0.16 | .694 | <.01 | ||
Note:
corresponds to significance below .01 level.,
corresponds to significance below .001 level.
Error rates
For the target-present trials, there were 351 error-trials, out of the 3805 trials not discarded as outliers. There was a main effect of distractor condition and set size (see Table 2), but no significant post-hoc comparisons. For the target-absent trials, participants made the wrong response in only 70 trials, out of the 3779 target-absent trials that were not discarded as outliers. For these 70 trials, there was a significant main effect of distractor condition, and comparisons revealed that errors occurred more often in the 3D(1) condition compared to the 26D(012) condition (see Table 3, mean difference .049). No other effects reached significance.
Table 3.
Error rate comparisons variance for Experiments 1b, 2, 3, 6, and 7. Only significant effects are reported.
| Experiment | Target | Comparison | F | df | p | ges |
|---|---|---|---|---|---|---|
| 1B | Absent | 3D(1) – 26D(012) | 7.81 | 1, 12 | .032* | .20 |
| 2 – 8 pp | Present | Subset – 26D | 21.78 | 1, 7 | .009** | .46 |
| Subset – 5D | 18.46 | 1, 7 | .010* | .61 | ||
| Subset – 3D(012) | 18.95 | 1, 7 | .010* | .60 | ||
| Subset – 3D(1) | 9.45 | 1, 7 | .018* | .48 | ||
| 2 – all pp | Present | Subset – 26D | 12.56 | 1, 10 | .009** | .48 |
| Subset – 5D | 20.44 | 1, 10 | .004** | .59 | ||
| Subset – 3D(012) | 17.07 | 1, 10 | .006** | .57 | ||
| Subset – 3D(1) | 13.22 | 1, 10 | .009** | .51 | ||
| 3 | Present | 3D(1) – 12D(1) | 12.42 | 1, 12 | .013* | .21 |
| Absent | 12D(012) – 12D(1) | 8.95 | 1, 12 | .034* | .32 | |
| 6 | Present | 3D(2) – 3D(012) | 35.43 | 1, 10 | <.001*** | .63 |
| 3D(1) – 3D(2) | 42.80 | 1, 10 | <.001*** | .65 | ||
| 7 | Present | 5D(3) – 5D(4) | 9.85 | 1, 9 | .048* | .33 |
Note: All p-values are Bonferroni-Holm corrected.
corresponds to significance below .05 level,
corresponds to significance below .01 level,
corresponds to significance below .001 level.
Discussion of Experiments 1a and 1b
Overall, the results of Experiments 1a and 1b suggest that search efficiency is influenced by the mix of distractor types in this triple conjunction search, even though the distribution of features is the same in all conditions (with small differences in the 5D condition). This result is in general agreement with the results of Found (1998; see also Mordkoff et al., 1990; Mordkoff & Halterman, 2008; Krummenacher et al., 2001, 2002; Takeda, Phillips, & Kumada, 2007). Consistent with previous work, these are highly efficient triple conjunction searches. A standard Guided Search account would propose that this efficiency arises from the intersection of three sources of guidance. Using the target of Experiment 1a, attention would be guided to red, to vertical, and to rectangular shapes. Guidance of this sort, however, should be the same for all conditions and would not explain the differences between conditions. Similarly, it is not obvious how dimension weighting (Krummenacher et al. 2001, 2002) would explain these effects. Why, then, do the results differ?
One possible account for these differences occurs to almost everyone who introspects about these stimuli. Looking at Figure 1, might the 3D condition be easier because participants can select the red group and then look for a unique item in that subset? Participants certainly can search through subsets (e.g. Egeth, Vizri, & Garbart, 1984). This subset search strategy would be effective in the 5D and 3D conditions; but not in the 26D condition. The subset search strategy would be most efficient for the 3D(1) condition for which subsets defined by any of the target features would allow for target identification based on any of the two other target features. For the 3D(012) and the 5D conditions, the efficiency of the subset strategy would depend on the feature defining the subset. Experiment 2 tests this subset search hypothesis.
Experiment 2
In Experiment 2, we investigated whether the differences in search efficiency we observed in Experiments 1a and 1b were caused by the adoption of a subset search strategy. To test this, we constructed a new distractor condition and had participants do a search task that could only be completed by use of a subset search. The distractor set contained 19 different conjunction types: all the possible blue and green conjunction types (cf. Figure 2) and, crucially, only one of the red conjunction types. This red element was repeated nine times thereby creating a group of similar red elements among the heterogeneous blue and green elements. On half the trials, a single instance of a second type of red element was present. This was the target item. The participants were requested to report whether there was an oddball in the red subset; thus, the only way to solve the task was to use a subset search strategy.
Method
Participants
The same 13 volunteers as in Experiment 1a were tested. The task turned out to be very difficult and 5 participants missed the target on more than 20% of the trials. To be sure we were not analyzing search patterns derived from unconventional search termination strategies, we analyzed reaction times both including and excluding these participants. For the analysis excluding the 5 participants with high miss errors, age information was available for 7 of 8 participants: range 20 to 46 years old; four were men.
Distractor set
Only one type of distractor condition was used, the red Subset distractor condition. All of the 18 blue and green conjunction types were present in the distractor set. Furthermore, on each trial, one of the nine red conjunction types was randomly chosen and repeated nine times, forming a group of similar red elements.
Target
On each target-present trial, one of the remaining eight red conjunction types was randomly chosen to be the oddball target.
Procedure
The participants were instructed to report whether an oddball was present among the group of similar red items. Participants started the experiment by completing 30 practice trials. The practice trials continued directly into the 300 experimental trials.
Results and discussion
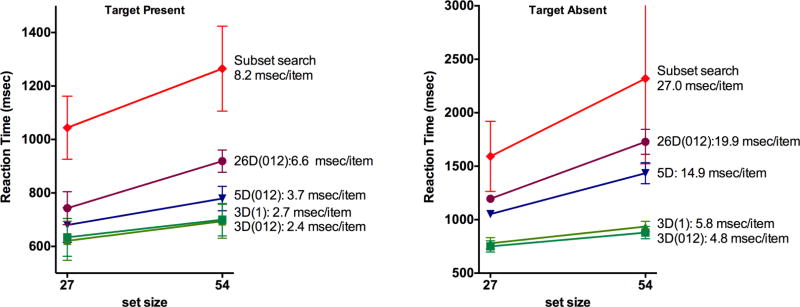
Less than one percent of the trials were removed by the outlier procedure. Figure 5 reproduces the data of Experiment 1a for the 8 participants with reasonable error rates in Experiment 2. The diamonds in Figure 5 depicts the mean reaction times for those 8 participants as a function of display size for the subset search of Experiment 2. It should be clear that the subset search condition is notably slower than the slowest of the conditions from Experiment 1a.
Figure 5.
RT × set size functions for the 8 participants with acceptable error rates in the subset search condition of Experiment 2 shown with the conditions of Experiment 1a for the same participants for comparison.
Reaction times
Reaction times in the Subset condition of Experiment 2 were compared with reaction times in the distractor conditions of Experiment 1a by repeated-measures analyses of variance for all the participants and the eight participants whose miss rates were acceptable, respectively (cf. Table 5). All effects were significant and further explored by planned comparisons.
Table 5.
Reaction time ANOVAs and search slope comparisons for the subset condition compared to all conditions of Experiment 1a. The analyses are reported for all participants of Experiment 2, and for the 8 participants who had reasonable miss error rates in Experiment 2. Search slope comparisons are paired for each participant. GGe refers to Greenhouse-Geisser epsilon and is reported when significant, ges denotes generalized eta squared, d refers to Cohen’s d.
| Target present | Target absent | ||||||||
|
|
|||||||||
| General ANOVAs | |||||||||
|
|
|||||||||
| Participants | Effects | F | GGe | p | ges | F | GGe | p | ges |
|
| |||||||||
| All | Set Size (1, 10) | 46.28 | n.s. | <.001*** | .08 | 22.68 | n.s. | <.001*** | .09 |
| Distractor (4, 40) | 43.38 | .31 | <.001*** | .45 | 21.64 | .28 | <.001*** | .37 | |
| Set Size × Distractor (4, 40) | 9.86 | .48 | .001** | .02 | 15.21 | .31 | .001** | .04 | |
|
|
|||||||||
| F | GGe | p | ges | F | GGe | p | ges | ||
|
|
|||||||||
| 8 | Set Size (1, 7) | 42.37 | n.s. | <.001*** | .11 | 24.85 | n.s. | .002** | .16 |
| Distractor (4, 28) | 30.67 | .28 | <.001*** | .50 | 23.99 | n.s. | .001** | .47 | |
| Set Size × Distractor (4, 28) | 8.45 | .47 | .004** | .03 | 14.40 | n.s. | <.001*** | .06 | |
|
|
|||||||||
| Slope – distractor type × set size interaction | |||||||||
|
|
|||||||||
| Comparisons | F(1, 10) | p | ges | F(1, 10) | p | ges | |||
|
| |||||||||
| All | Subset – 26D | 4.28 | .065 | .03 | 12.30 | .008** | .03 | ||
| Subset – 5D | 8.31 | .033* | .07 | 15.59 | .008** | .07 | |||
| Subset – 3D(1) | 17.93 | .007** | .11 | 16.04 | .008** | .11 | |||
| Subset – 3D(012) | 12.36 | .017* | .09 | 17.46 | .008** | .10 | |||
|
|
|||||||||
| F(1, 7) | p | ges | F(1, 7) | p | ges | ||||
|
|
|||||||||
| 8 | Subset – 26D | 1.20 | .310 | .01 | 7.97 | .026* | .03 | ||
| Subset – 5D | 7.40 | .072 | .07 | 16.57 | .019* | .73 | |||
| Subset – 3D(1) | 18.06 | .015* | .08 | 14.27 | .021* | .16 | |||
| Subset – 3D(012) | 8.25 | .072 | .08 | 11.74 | .022* | .09 | |||
Note:
corresponds to significance below .01 level,
corresponds to significance below .01 level and,
corresponds to significance below .001 level.
The reaction times for the subset condition were significantly higher than for all the distractor conditions of Experiment 1a. For the target-present trials, the mean RT difference between conditions ranged from 321 msec to 459 msec for the 8 low-error participants (324 to 497 msec for all participants), F(1, 7) statistic ranged from 19.90 to 34.01 for the 8 low-error participants (F(1, 10) ranging from 38.00 to 50.02 for all participants), and all p-values were below .004, and all ges >.65. A similar pattern was apparent for the target-absent trials. Here the mean RT difference ranged from 494 to 1141 msec for the 8 participants (555 to 1116 msec for all participants), F(1, 7) ranged from 11.35 to 24.27 (F[1, 10] for all participants ranged from 13.00 to 22.44) and all p-values below .015 and all ges > .45.
Comparisons revealed that the subset search slopes were significantly higher than the slopes for almost all other distractor conditions, when considering all participants (for target-present trials, the comparison with the 26D condition was only trending toward significance). When only looking at the 8 participants who had reasonable error rates, the differences weakened. All comparisons were significant for the target-absent trials; however, for the target-present trials, only the comparison with the 3D(1) condition was significant; the 3D(012) and 5D comparisons trended toward significance. Overall, search in the subset condition was slower and less efficient than the 5D and 3D conditions of Experiment 1a, for which a subset search strategy would have been possible.
Error rates
Looking at the errors for the 8 participants with reasonable miss rates, there were 95 errors out of the 1193 target present trials and 15 errors out of the 1183 target-absent trials that were not removed as outliers. The error rate data did not indicate that the increase in search slopes for the subset condition was caused by a change in speed-accuracy settings (cf. Tables 2 and 3). Overall, error rates were higher in the subset condition for target-present trials, whether or not the participants with the high error rates were included in the analyses.
In general, the analyses suggested that participants were substantially worse at the performing the subset search than any of the distractor conditions of Experiment 1a. Participants had a tendency to miss the targets in the subset search, whether or not the participants with the high miss error rates were included in the analyses. Overall, the results from Experiment 2 clearly suggest that the participants were not applying a subset search strategy in Experiments 1a and 1b. Although a slight reaction time cost might have been expected due to the cost of using a variable conjunction target in Experiment 2 compared to a constant conjunction target in Experiment 1a (< 100 ms cf. Kristjansson, Wang, & Nakayama, 2002), the subset costs we found were substantially larger than this (> 300 ms). The subset searches were significantly slower and less efficient than the distractor conditions for which a subset search strategy would have been possible. For the target-absent trials, the subset search was even less efficient than the 26D condition. Thus, though introspection often suggests a subset search strategy in conjunction searches, the data suggest that subset searches are slower and/or less efficient than what we assume to be “guided” searches for targets defined by specified features. A similar conclusion was reached by Friedman-Hill and Wolfe (1995) who performed a comparable experiment with 2-dimesional conjunctions.
Discussion Experiments 1 and 2
The number of distractor types and their similarity with the target influences the slopes and intercepts of RT × set size functions even when the distribution of basic features is held constant (i.e., the 26D, 3D(012), and 3D(1) conditions). In the visual search literature, RT × set size slopes are taken to reflect the efficiency of the search process itself while changes in the intercept reflect non-search processes; including the initial stages of visual processing or relatively late, decision processes. Looking at Figure 5, for example, the slope of the 26D condition is elevated relative to the 3D conditions. This presumably reflects some slowing of search. The intercept is elevated for the 26D Absent trials. In this experiment, observers are probably slightly more reluctant to commit to an “absent” response in the ‘noisier’ 26D condition. Both aspects of these results demonstrate that performance on these tasks can be influenced by something beyond the distribution of basic features. The massive, ~300 msec elevation of the intercept in the subset condition presumably reflects the two-step nature of that task: get the subset, then examine the subset for the target. The fact that this is so much slower than the normal triple conjunction tasks is strong evidence that observers do not do two-step subset searches in the 3D, 5D and 26D conditions.
How, then, should we explain the differences between the conditions? The results are inconsistent with linearly summed guidance from three, independent feature maps as in standard GS. It is not obvious how a dimension weighting account (Krummenacher, 2001, 2002) would explain this pattern of results nor is it clear why a parallel coactivation account (Mordkoff et al, 1990) would produce, for example, slower RTs for the 26D conditions. This is not to say that any of these approaches is inconsistent with the results; only that each of the approaches would need to consider how to accommodate those results.
Two forms of interaction seem plausible.
Factor 1: Target-distractor similarity or “Sharing”: Returning to Figure 1, if the target is a red, horizontal, smooth rectangle; the distractors can share either zero, one, or two features with that target. In the three distractor-type example in Figure 1, each distractor shares just one feature with the target (e.g. the red tilted ovals share only redness with red vertical rectangles). It is known that search would be harder if the number of shared features was increased (Wolfe et al, 1989). In the 26 distractor condition, some distractors share two features with the target, some one, and others zero. The average is one shared feature. However, if the effects of sharing are not linear, the presence of distractors sharing two features might explain why the targets are harder to find in the 26D condition. Experiment 1a did not provide strong support for this hypothesis since conditions 3D(012) and 3D(1) produced very similar results even though 3D(012) has a mix of distractors sharing 0, 1, & 2 features while 3D(1) has distractors sharing just 1 feature with the target. However, as noted above, the failure to find a difference between these conditions might be a floor effect since 3D(1) and 3D(012) are both very efficient searches.
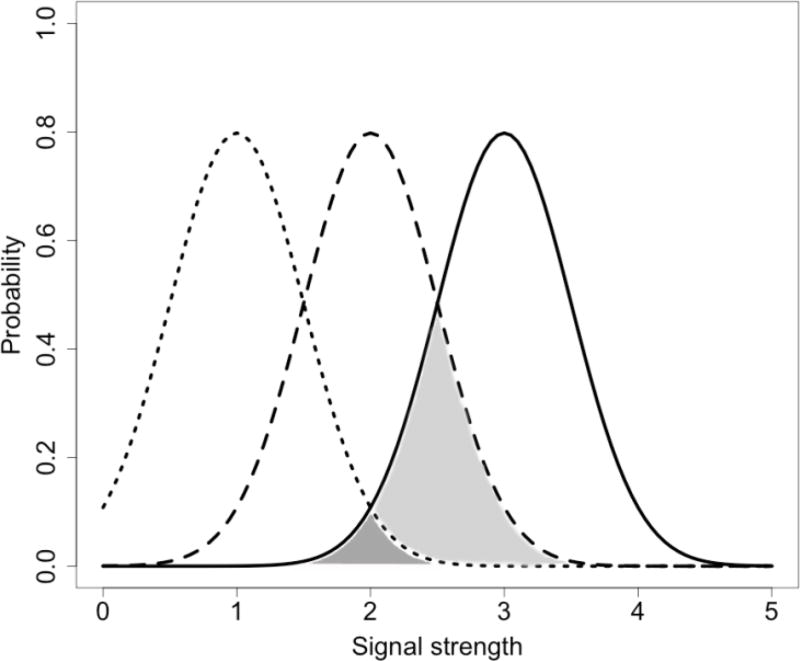
Factor 2: The number of element types in the displays or “Grouping”: For each feature dimension there are three groups of features (e.g. red, green, blue groups). In the 3D conditions, these three groups have exactly the same spatial distribution for each feature dimension. In the 26D condition, on the other hand, the three groups are never aligned across feature dimensions. In Guided Search and related models, activity from feature maps is pooled into a cross-feature, attentional “priority” map (Serences & Yantis, 2006). Attention is guided to peaks of activity in that map. Some studies have reported evidence of feature co-activation prior to selection (e.g., Weidner & Müller, 2009, 2013), suggesting that this pooling in not necessarily additive. From a bottom-up perspective, the 3D condition, with its aligned groups, might be less ‘noisy’ than a 26D condition, with unaligned groups. This point is graphically illustrated in Figure 15, later in this paper.
Experiments 1a and 1b are consistent with a role for a grouping factor, but the topic requires further testing. Experiment 3 examines the relative contributions of grouping and sharing by using conditions where the sharing variable might not be lost to a floor effect.
Figure 15.
Three hypothetical distributions of signal strength for elements with varying average signal strength. As can be seen, the overlap between the distribution with the highest average (the solid line) and the other distributions quickly drops. In this example, although the distances between the distribution averages are linear, the overlaps between distributions are not. The probability that a signal drawn from the low average distribution (dotted line) is higher than a signal drawn from the high average distribution (full line) is less than half the probability that a signal drawn from the medium average distribution (striped line) is higher than a signal from the high average distribution (compare dark grey and light grey area respectively).
Experiment 3
Experiment 3 repeats the most efficient and least efficient conditions of Experiments 1a and 1b. These are the 26D condition with all distractor types present and the 3D(1) in which 3 distractor types are present, each sharing one feature with the target. Experiment 3 introduces two new, intermediate conditions with 12 types of distractors. In the 12D(1) condition, all distractors share exactly one feature with the target, similar to the 3D(1) set. In the 12D(012) condition, the distractors share zero, one, or two features with the target. In the 26D condition, the distractors also share zero, one, or two features with the target. Note that, as before, all of these stimulus conditions have equivalent representations in separate feature maps. On average in each condition, one third of the items are red, one third - blue, and one third - green. The same holds for the distributions of orientation and shape. Thus, the only changes between the distractor conditions are with respect to the conjunctions of the features, implemented in the number of groups and the sharing distributions.
Method
Participants
Thirteen participants (3 men) served as paid volunteers in this experiment. Their ages ranged from 19 to 45 years. All gave informed consent.
Distractor conditions
Four different distractor conditions were used, as described above. The exact stimulus elements were randomly drawn on each trial, for all the distractor sets for which this was possible (i.e., not the 26D(012), and the 12D(1) sets where all appropriate stimuli were needed on each trial). Importantly, in all four distractor conditions all features were equally represented across displays.
Target
The participants searched for a red, vertical rectangle.
Procedure
The experiment started with 32 practice trials – two trials in every condition (4 distractor set × 2 set sizes × 2 target present/absent). Each participant served in 800 experimental trials, yielding 50 observations per condition per participant.
Results and discussion
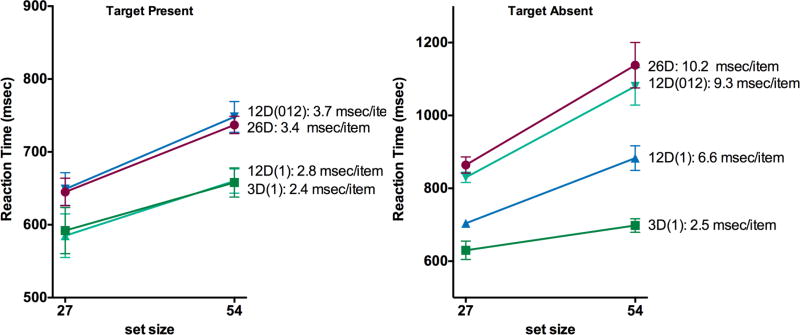
Less than 2 % of the trials were removed by the outlier procedure. Figure 6 presents the participants’ mean reaction times and number of errors for the four different distractor conditions as a function of set size for target-present and target-absent trials. The results replicate the earlier results and now add a clear difference between 12D(1) and 12D(012) conditions.
Figure 6.
RT × set size functions for the conditions of Experiment 3. Error bars are +/− 1 within-observer s.e.m. using the method of Cousineau (2005) corrected as suggested by Morey (2008, Cousineau & O'Brien, 2014). The first number in the condition label gives the number of distractors. The parenthetical numbers state if the distractors all differ by 1 feature from the target (1) or by 0,1,or 2 features (012).
Reaction times
The ANOVA for the target-present reaction times revealed a main effect of distractor condition F(3, 36) = 25.43, GGe = 0.43, p < .001, ges = .09, and set size F(1, 12) = 26.81, p < .001, ges = .10, but no significant interaction. Further analyses of the reaction times based on sharing and groups confirmed what is evident from Figure 6; Sharing influenced the reaction times significantly – the 12D(012) condition were significantly higher than the reaction times for the 12D(1) condition, F(1, 12) = 25.04, p < .001, ges = .41, mean difference = 84.62 ms, whereas, in this case, grouping had no significant effect on the reaction times. The 12D(012) condition did not differ significantly from the 26D(012) condition, F(1, 12) = 7.21, p = .825, ges < .01, mean difference = −5.23 ms, nor did the 12D(1) condition differ significantly from the 3D(1) condition, F(1, 12) = 0.03, p = .870, ges = 0.41, mean difference = 1.17 ms.
Analyses of the target-absent reaction times revealed significant main effects of distractor condition F(3, 36) = 40.49, GGe = 0.38, p < .001, ges = .24, and set size F(1, 12) = 31.55, p < .001, ges = .14, and a significant interaction between the two F(3, 36) = 20.79, p < .001, ges = .03. Reaction time comparisons based on sharing and grouping revealed significant effects of both factors – the 26D(012) condition were significantly slower than the 12D(012) condition (grouping), F(1, 12) = 7.39, p = .019, ges = 0.06, mean difference = 42.18 ms; the 12D(1) condition were significantly slower than the 3D(1) condition (grouping), F(1, 12) = 21.24, p = .001, ges = .48, mean difference = 130.49 ms; and the 12D(012) condition were significantly slower than the 12D(1) condition (sharing), F(1, 12) = 79.66, p < .001 ges = .52, mean difference = 153.53 ms. The comparisons of the target-absent slopes were not as consistent and revealed significant differences between the 12D(012) and 12D(1) conditions: F(1, 12) = 17.82, p = .002, ges = .04; and the 12D(1) and 3D(1) conditions: F(1, 12) = 20.60, p = .002, ges = .14. However, the 26D(012) and 12D(012) conditions did not differ significantly from each other: F(1, 12) = 0.56, p = .469, ges < 0.01.
Error rates
There were 386 error-trials, out of the 5,174 target-present trials not discarded as outliers, and of the 5056 target-absent trials, 109 were errors. Analysis of variance revealed significant main effect of distractor condition and set size for both target-present and –absent trials, but no interaction (cf. Table 2). Comparisons based on sharing and grouping revealed that the miss error rates were significantly higher in the 3D(1) condition compared to the 12D(1) condition. False alarm error rates were significantly higher for the 12D(012) condition compared to the 12D(1) condition (cf. Table 3).
Discussion
On the face of it, the results from Experiment 3 might seem to be at odds with the findings of Experiments 1a and 1b. In Experiments 1a and 1b, there is no evidence for an effect of shared feature in the comparison between conditions 3D(012) and 3D(1). In Experiment 3, there is clear evidence that 12D(012) is harder and 12D(1). Indeed, in Experiment 3, at least for the target present trials, all of the difference between the 26D and 3D conditions might be explained by the sharing factor. The 3D(1) and 12D(1) target-present results are essentially identical, though they differ in grouping. This conclusion is somewhat challenged by the absent trials where 12D(1) is more difficult than 3D(1) – evidence for an effect of grouping. We speculate that, like Experiments 1a and 1b, Experiment 3 suffers from a floor effect. In Experiment 3, the 12D(1) and 3D(1) conditions may produce the same results because those searches are about as fast and efficient as they can be. In Experiments 1a and 1b, it is the 3D(1) and 3D(012) conditions that are maximally fast and efficient. Both sharing and grouping can be seen when the tasks are made a little more difficult.
Experiment 4
The interpretation of the preceding experiments is complicated by some rather high miss error rates. Comparisons between conditions may be contaminated by speed-accuracy trade-offs. Thus, in Experiment 4, we replicated important conditions using a localization task. A target was present on every trial, and the participants marked the location of the target with a mouse click. This strongly discourages errors.
Method
Participants
Twelve paid participants (five men) took part in the experiment; their age range was 19 – 55. All gave informed consent.
Distractor conditions
The five different distractor conditions of Experiments 1b and 3 were replicated in Experiment 4: 26D(012), 12D(012), 3D(012), 12D(1), and 3D(1). The conditions were intermixed within a block of trials.
Target
For each participant, a target was randomly drawn from the stimulus set. The target element remained the same across the experiment.
Procedure
The participants’ task was to find the target and click on it with a computer mouse as fast as possible. The target was present on all trials. An arrow indicated the mouse position on the screen and always appeared in the center of the screen when the trial started. Participants were allowed an error margin of 20 pixels outside the target element when they made the click. Each participant served in 500 experimental trials, equaling 50 observations per data point. The participants started the experiment with a short training session of 30 trials.
Results and discussion
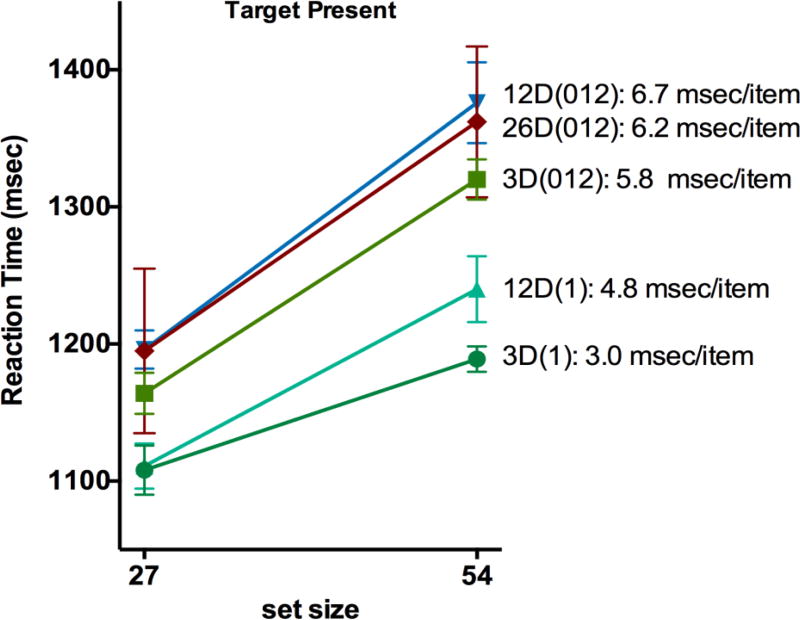
Trials with reaction times more than three standard deviations from the mean of that participant or faster than 500 milliseconds were counted as outliers and removed from further analysis. Out of the 6000 trials that were completed by the 12 participants 98 were removed as outliers. Participants’ mean reaction times for the five different distractor conditions are depicted as a function of set size in Figure 7 and show effects of both grouping and sharing.
Figure 7.
RT × set size functions for the five conditions of Experiment 4. Error bars are +/− 1 within-observer s.e.m., calculated by the Cousineau-Morey method (Morey, 2008; Cousineau & O’Brian, 2014).
Reaction times
The ANOVA revealed significant main effects of set size F(1, 11) = 37.77, p < .001, ges < .01, and distractor condition F(4, 44) = 48.12, GGe = 0.57, p < .001, ges = .06, and it revealed a significant interaction F(4, 44) = 2.93, p = .025, ges = .01. Instead of comparing the individual distractor conditions, we further analyzed the data by a 2 × 2 × 2 repeated measures ANOVA with factors: set size (27 or 54), sharing (1 or 012), and groups (3D or 12D), leaving out the 26D(012) distractor condition. This analysis revealed a main effect of set size, F(1, 11) = 29.41, p < .001, ges = .08; sharing, F(1, 11) = 174.63, p < .001, ges = .05; and groups F(1, 11) = 9.47, p = .010, ges = .06. The interaction set size × sharing was significant, F(1, 11) = 8.04, p = .016, ges = .01. No other interactions were significant.
Error rates
Across all participants, there were 33 error trials (less than 0.6 % of the trials) among the 5902 trials not removed by the outlier procedure. An ANOVA of these errors revealed no systematic patterns – none of the effects were significant.
Discussion
Experiment 4 again confirmed the basic result that the distribution of distractor features influences visual search even if the distribution of the individual features is the same. Because the results are broadly similar to those of the previous experiments, Experiment 4 indicates the previous results were not driven by differences in speed-accuracy trade-offs.
In this version of the experiment, both sharing and the number of conjunction groups had an effect on the time it took participants to locate the target, though only the sharing factor affected search efficiency.
Experiment 5 – Accuracy Measures
In Experiment 4, performance was pushed away from the floor effects of the previous experiments by forcing the participants to localize a target on every trial. This approach eliminates speed-accuracy trade-offs but imposes a high decision criterion. In Experiment 5, we go one step further and present stimuli briefly, thereby letting criterion vary freely, driving performance away from high accuracy and allowing us to see if evidence for sharing and grouping are found in brief presentations. These temporal constraints are of interest since a number of studies suggest that similarity effects develop gradually as stimulus presentation time passes (Lamberts, 1998; Verghese & Nakayama, 1994). Similarly, some aspects of attentional guidance to feature conjunctions appear to be time dependent (Kunar, Flusberg, Horowitz, Wolfe, 2007; Kunar, Flusberg, & Wolfe, 2008). By looking at performance at very short exposure durations, we are able to investigate whether the grouping and sharing effects come in to play at distinct points in time of the processing and if either of the effects takes precedence over the other.
Method
Participants
Ten paid participants (three men) volunteered for the experiment; their age range was 18 – 54. All gave informed consent.
Apparatus
For Experiment 5, the stimuli were presented on an Apple iMac OS X 10.6.8 computer, and the experiment were run using the Psychophysics toolbox in MatLab 7.4.0 (R2007a).
Stimuli
The following distractor conditions were used: 12D(012), 12D(1), 3D(012), and 3D(1). Due to the brief exposure durations, the stimulus presentation matrix was reduced to a seven × seven matrix with a diagonal of 680 pixels: the set size was either 12 or 36.
Target
For each participant, a target was randomly drawn from the stimulus set. The target element remained the same across the experiment.
Procedure
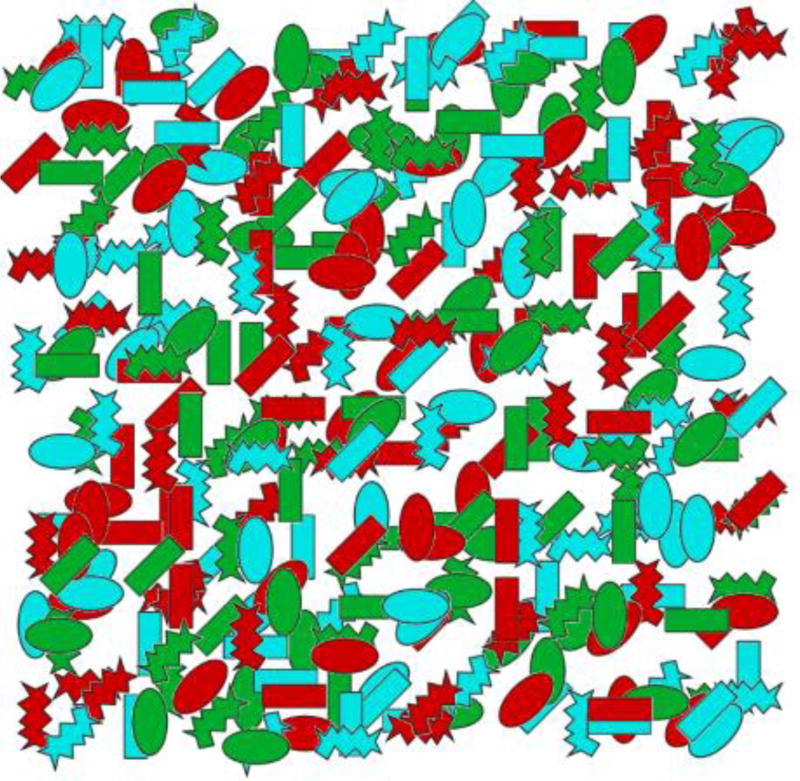
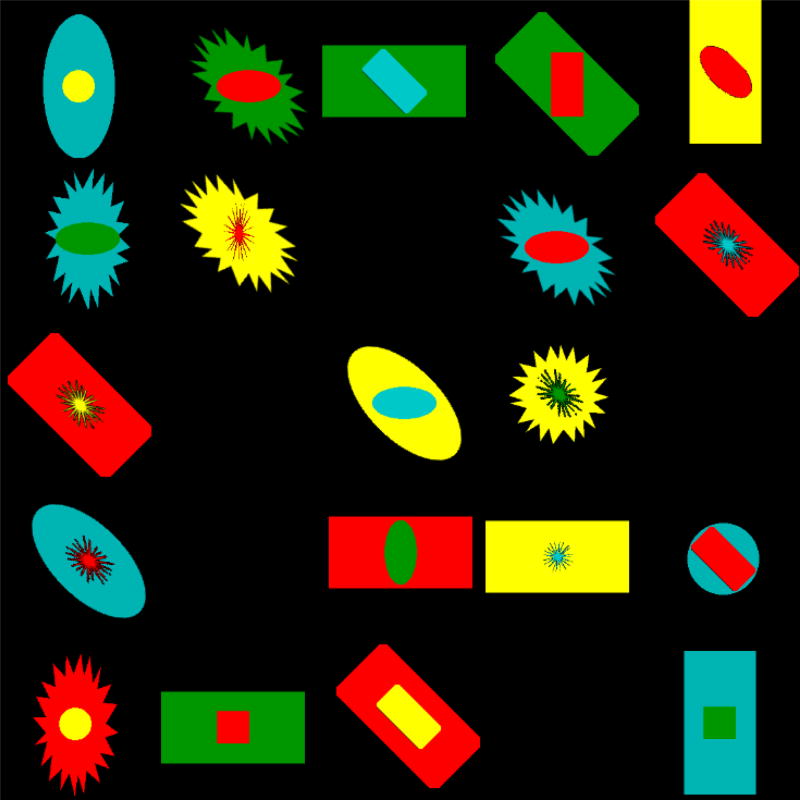
The participants’ task was to report whether the target was present or absent. Stimulus displays were presented briefly and were post-masked by a pattern mask that covered the stimulus presentation matrix (see Figure 8). On half the trials, the exposure duration was 110 milliseconds, on the other half of the trials it was 200 milliseconds. The participants started the experiment with an extensive training session of 400 trials to get used to the very short exposure durations. After the training session, participants continued into the 1600 experimental trials.
Figure 8.
Example of the mask used in Experiment 5.
Results and discussion
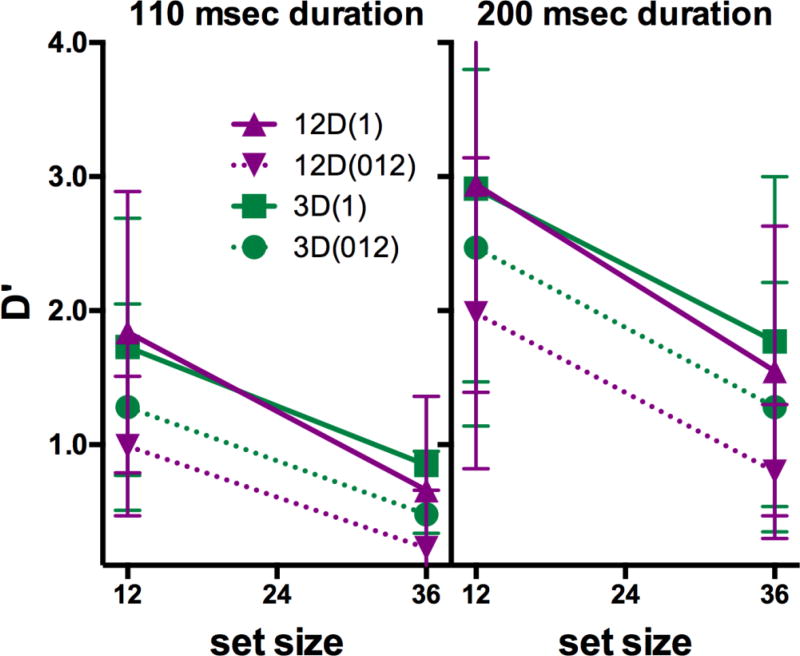
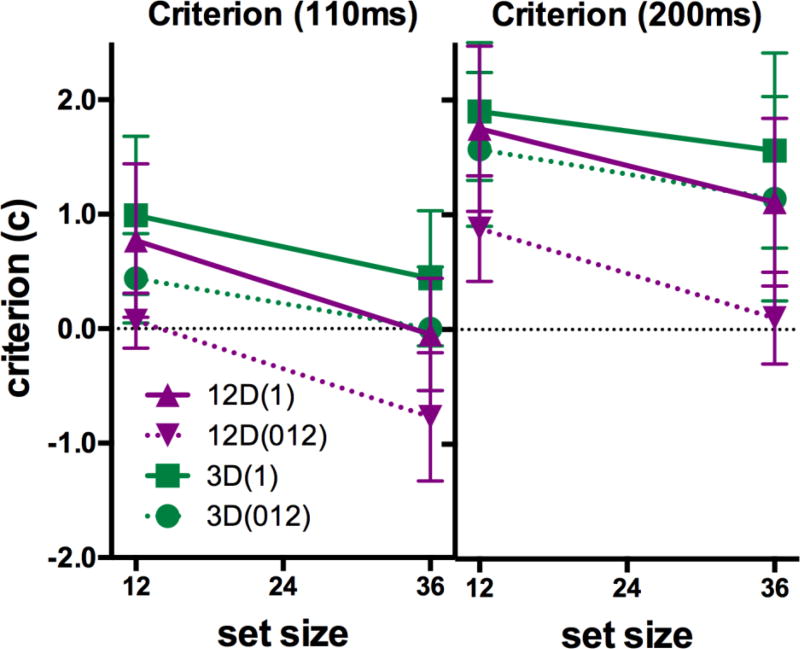
Based on the accuracy data, D’ and criteria (Green & Swets, 1966) were computed for each participant at each exposure duration, set size and distractor condition. The computed D’-values are depicted in Figure 9 and criteria are shown in Figure 10. Figure 9 shows a similar pattern in accuracy to the pattern of RTs in, for example, Figure 7 (remembering higher D’ and lower RTs are the markers of better performance). It is interesting to note that the criteria (Figure 10) broadly follow the pattern shown in D’ (Figure 9). As the task gets harder, criteria become more liberal with participants more inclined to guess that a target might be present. These patterns were investigated separately for D’ and criterion using repeated-measures ANOVAs with factors: set size, exposure duration, sharing, and groups.
Figure 9.
D’ values for the four conditions of Experiment 5. Note that worse performance is lower on these graphs.
Figure 10.
Criterion values for the four conditions of Experiment 5.
D’
The ANOVA revealed that all main effects were significant (cf. Table 6). Exposure duration did not have a significant influence on any of the two conjunctive effects. Interestingly, the interaction Sharing × Groups were also significant. Comparisons revealed that groups had no significant influence when all distractors shared one feature with the target (3D(1) vs. 12D(1) see Table 6, see also Figure 9). However, the number of groups did influence D’ when the number of features shared varied (3D(012) vs. 12D(012)). The sharing distribution, on the other hand, had a significant influence on D’ irrespective of the number of groups in the displays.
Table 6.
ANOVA’s and comparisons of computed D’ and criteria for Experiment 5. Comparisons are based on the sharing distribution and the number of conjunctive groups. Ges denotes generalized eta squared, d refers to Cohen’s d.
| D’ | Criteria | |||||
|
|
||||||
| General ANOVAs | ||||||
|
|
||||||
| Effect | F(1, 9) | p | ges | F(1, 9) | p | ges |
|
| ||||||
| Set size | 67.74 | <.001*** | .26 | 79.54 | <.001*** | .22 |
| Exposure duration | 32.85 | <.001*** | .22 | 110.40 | <.001*** | .45 |
| Sharing | 23.13 | <.001*** | .10 | 38.27 | <.001*** | .24 |
| Groups | 10.93 | .009** | .02 | 54.03 | <.001*** | .18 |
| Sharing × Groups | 5.99 | .037* | .01 | 11.95 | .007** | .03 |
| Set size × Exposure | 14.29 | .004** | .01 | |||
| Set size × Sharing × Groups | 6.99 | .027* | <.01 | |||
| Groups × Set size | 6.25 | .034* | .02 | |||
| Exposure × Sharing × Groups | 5.93 | .038* | .01 | |||
|
| ||||||
| Distractor main effects | ||||||
|
|
||||||
| Comparison – distractor type | F(1, 9) | p | ges | F(1, 9) | p | ges |
|
| ||||||
| 12D(1) – 3D(1) | 0.58 | .467 | <.01 | 35.26 | <.001*** | .11 |
| 12D(012) – 3D(012) | 14.58 | .008** | .30 | 35.60 | <.001*** | .33 |
| 12D(012) – 12D(1) | 19.01 | .005** | .16 | 31.22 | <.001*** | .39 |
| 3D(012) – 3D(1) | 21.09 | .005** | .05 | 51.90 | <.001*** | .06 |
Note: All post hoc p-values are Bonferroni-Holm corrected.
corresponds to significance below .001 level,
corresponds to significance below .01 level,
corresponds to significance below .05 level.
Criteria
Similar to the D’ analysis, the ANOVA for the criteria revealed that all main effects were significant. Comparisons based on sharing and groups revealed that both components had significant effects across all the sharing and group combinations (see Table 6).
Discussion
The results of Experiment 5 demonstrated that the effects of both grouping and sharing can be seen in accuracy data at very short exposure durations of 110 and 200 milliseconds. The effects do not appear to develop over the time ranged here investigated and neither come into play before the other. However, the effects of grouping are statistically reliable only when the sharing varies from 0 to 2 features. This is interesting since, for these short exposure durations, it cannot be argued that the conditions with 1 shared feature are at ceiling. The results thus suggest that the sharing factor may be, in some sense, dominant over grouping.
Experiment 6
Experiment 6 returns to RT measures to explore the causes of the sharing effect. Specifically, the significant effect of sharing distribution on search efficiency in the previous experiments suggests that a linear increase in the number of features that a distractor shares with the target does not produce a linear increase in the probability that the distractor will attract attention in the course of search. We hypothesize that items sharing 0 or 1 feature with the target are similarly unlikely to be attended while items sharing 2 features are significantly more disruptive. In order to test this hypothesis, Experiment 6 compares searches where all the distractors share 0 features with the target to those where all distractors share 1 feature with the target and those where all distractors share 2 features with the target.
There are four conditions in Experiment 6. Two of these are replications of distractor conditions from previous experiments: 3D(1) where each of the three distractors share 1 feature with the target and 3D(012) where one of the three distractors shares no features with the target, another shares 1 feature, and the third shares two features. The third condition is 3D(0), where all distractors share no features with the target, making this a particularly easy feature search because the target is unique in color, shape, and orientation. The final condition is 3D(2), where each distractor shares 2 features with the target. In all cases, the target is a red, vertical rectangle. Note that in this experiment it is not the case that the distribution of features is the same across conditions. In 3D(1) and 3D(012), as before, 1/3rd of items are red, green, and blue and so one. In 3D(0), the target features are unique in the display. In 3D(2), 2/3rds of the items are red, 2/3rds vertical, and 2/3rds rectangular. The purpose of the experiment is to examine the function relating shared features to search efficiency and to see where 3D(012) lies on that function.
Method
Participants
15 participants (6 men) took part in the experiment; their age range was 18 – 49. All were paid and gave informed consent.
Procedure
Participants were tested on four blocks of trials corresponding to the 3D(0), 3D(1), 3D(2), & 3D(012) conditions, described above. There were 20 practice trials and 200 experimental trials. Targets were present on 50% of trials and participants gave a forced-choice, present-absent response via the keyboard.
Results and discussion
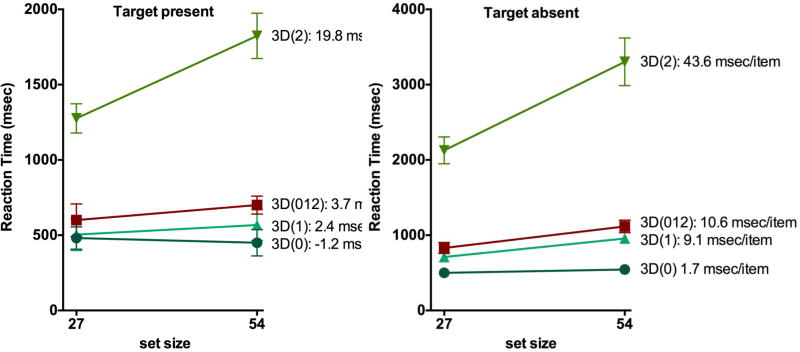
Two participants were removed because their data sets were incomplete. Two others were removed for excessive errors (> 25% in some conditions). The remaining 11 participants had an age range of 20 – 49 years and four were men. Trials with reaction times more than three standard deviations from the mean or faster than 150 msec were counted as outliers and removed from further analysis (1.5% of trials. Note, the lower cutoff of 150 msec was used here because blocks of 3D(0) trials produce very fast RTs meaning that 200 msec RTs are more likely to be real responses). Participants’ mean reaction times for the four different conditions are depicted as a function of set size in Figure 11. It is clear that distractors that share two features with the target are far more disruptive than distractors sharing one feature or no features.
Figure 11.
RT × set size functions for the conditions of Experiment 6. Error bars are within-observer s.e.m., calculated by using the Cousineau-Morey method (Cousineau & O’Brian, 2014; Morey, 2008). All conditions have 3 distractor types, differing in how many features each distractor shares with the target.
Reaction times
The target-present reaction times revealed a significant effect of distractor condition, F(3, 30) = 28.73, GGe = 0.38, p < .001, ges = .48, and set size, F(1, 10) = 39.87, p < .001, ges = .034, together with a significant interaction F(3, 30) = 17.81, GGe = .65, p < .001, ges = .06. Comparisons of the reaction times (see Table 7) revealed that the 3D(012) condition was not significantly slower than the 3D(1) condition, though trending toward significance. The 3D(012) condition was faster than the 3D(2) condition, confirming the extra cost of distractors sharing two features with the target. Regarding search efficiency, the 3D(012) slope was only significantly different from the 3D(2) slope not from the 3D(1) slope. However, as discussed earlier these searches were very fast and likely susceptible to floor effects.
Table 7.
Post hoc ANOVA comparisons for RTs in Experiment 6.
| Target present | Target absent | |||||
|
|
||||||
| Reaction time – distractor type main effect | ||||||
|
|
||||||
| Comparison | F(1, 10) | p | ges | F(1, 10) | p | ges |
|
| ||||||
| 3D(0) – 3D(012) | 21.60 | .003** | .45 | 27.79 | < .001*** | .69 |
| 3D(1) - 3D(012) | 5.72 | .076 | .21 | 3.45 | .093 | .16 |
| 3D(2) - 3D(012) | 27.33 | .002** | .69 | 56.61 | < .001*** | .81 |
| 3D(0) – 3D(1) | 1.74 | .217 | .13 | 32.31 | < .001*** | .58 |
| 3D(1) – 3D(2) | 26.15 | .002** | .70 | 58.00 | < .001*** | .81 |
|
| ||||||
| Slope – distractor type × set size interaction | ||||||
|
|
||||||
| Comparison | F(1, 10) | p | ges | F(1, 10) | p | ges |
|
| ||||||
| 3D(0) – 3D(012) | 2.16 | .345 | .09 | 18.02 | .005** | .14 |
| 3D(1) - 3D(012) | 0.28 | .610 | <.01 | 0.20 | .665 | <.01 |
| 3D(2) - 3D(012) | 15.15 | .012* | .12 | 21.21 | .004** | .22 |
| 3D(0) – 3D(1) | 7.74 | .058 | .06 | 13.99 | .008** | .13 |
| 3D(1) – 3D(2) | 24.52 | .003** | .12 | 22.61 | .004** | .21 |
Note: All post hoc p-values are Bonferroni-Holm corrected.
corresponds to significance below .001 level,
corresponds to significance below .01 level,
corresponds to significance below .05 level.
A similar pattern of results were evident for the target-absent trials: distractor condition F(3, 30) = 56.69, GGe = .39, p < .001, ges = .60, set size, F(1, 10) = 64.32, p < .001, ges = .09, and a significant interaction F(3, 30) = 23.82, GGe = 0.44, p < .001, ges = .09. For the target-absent trials, reaction time comparisons revealed the same pattern as the target present trials. Participants were significantly slower at quitting the search in the 3D(012) condition compared to the 3D(0) condition and trending toward significance when compared to the 3D(1) condition, but faster compared to the 3D(2) condition. While the target-absent slopes for the 3D(012) condition did not differ significantly from the 3D(1) slopes, they were significantly lower than for the 3D(2) condition.
Error rates
Out of the 5676 no-outlier target-present trials there were 417 errors. The target-present error rate ANOVA revealed a significant effect of distractor condition and set size together with a significant interaction (cf. Table 2). Participants made significantly more errors in the 3D(4) condition compared to the 3D(3) condition (cf. Table 3). No other comparisons were significant. For the 5649 no-outlier target-absent trials there were only 66 false alarms. There was a significant interaction between set size and distractor condition. The main effects did not reach significance.
Discussion
As is clear from Figure 11, the relationship of search efficiency to number of shared features is distinctly non-linear. The 3D(0) condition is more efficient than 3D(1) but 3D(2) is much less efficient than 3D(1). This function explains why 3D(012) is somewhat slower than 3D(1), though not significant in this experiment. The harm to performance produced by distractors sharing 2 features with the target outweighs the benefits produced by distractors sharing no features with the target. The same account would explain the difference between the 12D(1) and 12D(012) conditions of Experiments 3, 4, and 5. The interaction between a target of one type and different mixtures of distractors is systematic but not trivial to model. Obviously, we cannot just average the number of shared features. If so, conditions where all items shared 1 feature with the target would be the same as the (012) conditions. Nor can we simply average the slopes of the 3D(0), 3D(1), and 3D(2) conditions to get the 3D(012) result. Experiment 7 reinforces this point by extending the results to 6-dimensional conjunctions.
Experiment 7
At the outset of this paper, we noted that most objects in the real world would be defined by conjunctions of multiple features. In the experiments to this point, we extended the usual two-dimensional conjunctions to three dimensions. In Experiment 7, we go to six dimensions to provide evidence that the rules that apply to simpler conjunctions continue to apply as the conjunctions become more complex. In particular, this allows us to examine the effects of the number of shared features over a wider range than hitherto possible.
Method
Participants
Ten participants (five women) volunteered for the experiment; their age range was 18 – 47. All were paid and gave informed consent.
Stimulus set
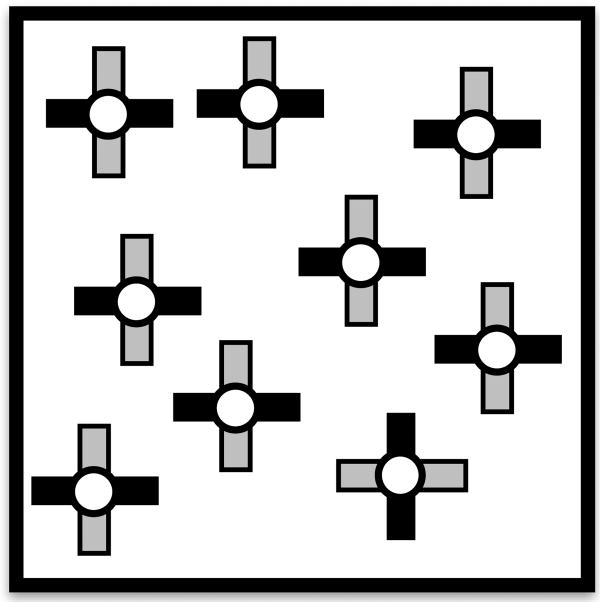
Examples of the stimuli are shown in Figure 9. These stimuli take advantage of the fact that it is possible to guide attention to features of the whole object and, at the same time, to features of a part (Bilsky & Wolfe, 1995; Wolfe, Friedman-Hill, & Bilsky, 1994). Thus, while search for a conjunction of two colors is inefficient (Wolfe, Yu, Stewart, Shorter, Friedman-Hill, & Cave, 1990), search for an object defined by the conjunction of the whole and the color of a part, is much more efficient. In Experiment 7, as shown in Figure 12, each stimulus element consisted of two components – a smaller figure (part) embedded within a larger figure (whole). The whole and the part of an element each varied in shape, orientation, and color – similar to the stimuli of the preceding experiments. Here colors could be red, green, yellow and blue. Orientations were vertical, horizontal, oblique and unoriented (all sides of the shape having equal length). Shapes were rectangular, oval, and jagged. The whole and the part always had two different colors. The orientation and shape features could be the same for the whole and the part of a stimulus element. The background color of the stimulus display was black (RGB: 0, 0, 0). This yields a set of over 2000 possible items.
Figure 12.
Six-dimensional conjunctions used in Experiment 7. Each item had a color, orientation, and shape and a part with its own color, orientation, and shape. The target is a yellow vertical rectangle, with a red, oblique, oval part. Though it may not be obvious, in this example, each distractor shares exactly 2 features with the target.
Distractor conditions
Five different distractor conditions were used in this experiment. For all five conditions, the distractor set consisted of six different types of conjunction elements. In the first condition, all distractors shared exactly one feature with the target. In the second condition, all distractors shared exactly two features with the target; and so on until the fifth distractor condition in which all the distractors each shared exactly five features with the target. Thus the distractor conditions of the present experiment were: 6D(1), 6D(2), 6D(3), 6D(4), and 6D(5). The features that the distractors of a given condition shared with the target were evenly distributed among the distractors. That is, for the 6D(1) condition each distractor shared a different feature with the target out of the possible six features. Note, the experimental setup did not allow for equal distribution of the 11 individual features among the parts and the wholes. As feature sharing increased, the number of different features that were represented in the displays decreased. In the example given in Figure 12, the target is a yellow, vertical rectangle with a red, oblique, vertical part. Each item shares 2 features with the target. Thus, the item directly below the target shares the “rectangular” feature of the whole and the “red” feature of the part.
Target
For each participant, a target was randomly drawn from the stimulus set. The target element remained the same across the experiment.
Procedure
The participants’ task was to report whether the target was present or absent. The target was present on half the trials, and the set size was 18 on half the trials and 36 on the other half. The experiment was blocked by distractor condition. Each block began with 30 practice trials and continued directly into 300 experimental trials. The order of the blocks was randomized across participants.
Results and discussion
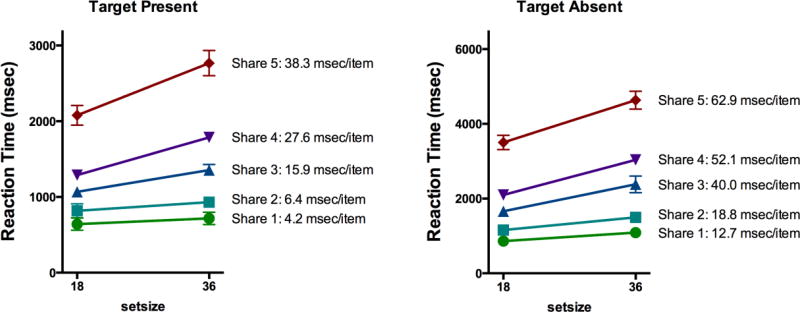
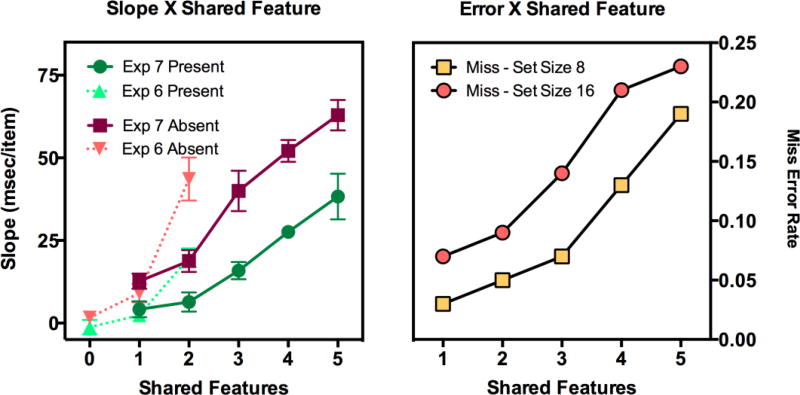
3.6% of the trials were discarded as outliers. The mean reaction times for the remaining trials are depicted for each distractor condition as a function of set size in Figure 13. Slopes and error rates are plotted as a function of the number of shared features in Figure 13. The basic result is clear. Search becomes slower, less efficient, and less accurate as the number of shared features increases. Search is very efficient if distractors share only 1 or 2 features with the target. By the time targets differ in only one feature, the search is quite difficult. The search slopes of 27.6 msec/item for target present and 38.3 msec/item for target absent trials undoubtedly underestimate the true inefficiency of the 6D(5) condition since miss errors also rise markedly with the number of shared features. Miss errors are 19% for set size 18 and 23% for set size 36 in the 6D(5) condition.
Figure 13.
RT × set size functions for Experiment 7. Error bars are +/− 1 within-observer s.e.m. using the method of Cousineau (2005), corrected as susggested by Morey (2008, Cousineau & O’Brian, 2014).
Reaction times
Analysis of the reaction time for the target present trials revealed significant effects of distractor condition, F(4, 36) = 73.26, GGe = 0.45, p < .001, ges = .80; set size, F(1, 9) = 104.63, p < .001, ges = .22; and a significant interaction F(4, 36) = 15.78, GGe = 0.36, p < .001, ges = .12. Similarly, the target absent trials revealed significant effects of distractor condition, F(4, 36) = 75.91, GGe = 0.46, p < .001, ges = .80; set size, F(1, 9) = 133.93, p < .001, ges = .28; and a significant interaction F(4, 36) = 28.43, p < .001, ges = .09. In general, reaction times and search slopes increased with number of features the distractors shared with the target. (For all reaction time comparisons based on one step, e.g., share 1 vs share 2, this increase was highly significant in every step for both target present and absent trials F(1, 9) = 13.54 to 128.18, all ps ≤ .005, ges > .50; the decrease in search efficiency was only significant in two of the one-step comparisons for the target present trials 6D(2)-6D(3): F(1, 9) = 10.26, p=.032, ges = .07; 6D(3)-6D(4): F(1, 9) = 36.71, p < .001, ges = .21; and in one step for the target absent trials 6D(2)-6D(3): F(1, 9) = 17.19, p =.010, ges = 0.9).
Error rates
Miss error rates are plotted in Figure 14 and clearly co-vary with slope. On average participants made 12.1% miss errors and 1.3% false alarm errors across the experimental conditions. For the target-present trials there was a significant main effect of Distractor Condition and Set Size on the miss error rates (see Table 2). Miss errors increased with set size and with the number of shared features. The interaction was not significant. None of the effects were significant for the target-absent (false alarm) error rates.
Figure 14.
Slopes (left panel) and miss error rates (right panel) as a function of number of shared features in Experiment 7. Dotted lines in left panel show data from Experiment 6 for comparison. Error bars are +/− 1 within-observer s.e.m. using the method of Cousineau (2005), corrected by Morey (2008, see also Cousineau & O’Brian, 2014).
Discussion
The results of Experiment 7 extend the investigation of the sharing factor from the earlier experiments. When the number of features that are shared with the target is relatively low (≤ 3), the shared features have an accelerating, nonlinear influence on search efficiency (see Figure 14, right graph). This is in broad agreement with Duncan and Humphrey’s (1989) observation that search difficulty increases as target-distractor (T-D) similarity increases. The other tenet of similarity theory is that search becomes easier as distractor-distractor (D-D) similarity increases. For the present experiment, D-D similarity actually increases as the number of T-D shared features increases. For example, when the target shared 5 features with the distractors, a red target would necessarily be presented in a field with mostly red distractors. Apparently, in the present experiment, the T-D costs overwhelm the D-D benefits. Thus, more dramatic increases in search slopes might be expected if distractor feature distribution could be held constant across conditions.
In the Guided Search model (Wolfe et al., 1989; Wolfe, 1994), the efficiency of search depends on what proportion of the distractors on a given trial have greater ‘activation’ than the targets. In the present experiment, we can imagine the target as the sum of 6 random, positive signals. A distractor from the 6D(5) set would be the sum of 5 such signals, a distractor from the 6D(4) set would be the sum of 4, and so on. A range of variations on this simple model produces results that are qualitatively similar to the results in Figure 14.
The non-linear effects of TD similarity can be seen by comparing the slope results of Experiment 6 (dashed lines in Figure 14a) with those from Experiment 7 (solid lines). Note that the results are rather similar when targets share 1 feature with the distractor, whether it is one of three (Experiment 6) or one of six (Experiment 7). However, when they share 2 features, search is more difficult in Experiment 6 than in Experiment 7, presumably because a distractor with 2 of 3 target features is markedly more similar to the target than a distractor with 2 of 6 target features.
General Discussion
To briefly summarize, across all our experiments we found evidence that conjunctive variations of features influence search difficulty. Experiments 1a and 1b confirmed that triple conjunction search is influenced by the mix of features in the distractors in the search display. Search is somewhat harder when there are more distractor types in the displays, even if those search displays have the same feature content. Experiment 2 shows that this is not a result of a “subset search” strategy. Experiments 1a, 1b, and 2 support the role of a “grouping” factor, that the number of different conjunctions in a display influences search. Displays with just three groups of distractors are easier to search than displays with 26 groups. Experiments 3 and 4 demonstrate the importance of the “sharing” factor - how many features a distractor shares with the target. Experiment 5 confirms that these effects are in play even at very short exposure durations and suggests that feature sharing may be a stronger driver of performance than grouping. Experiment 6 shows that the impact of shared features is non-linear. Sharing two of three features with the target is markedly worse than sharing one while sharing no features is only a bit better than sharing one. Finally, Experiment 7 extends this result to six-dimensional conjunctions, showing a non-linear function relating search efficiency to number of shared features.
Extending Guided Search
How do the findings, presented here, change our understanding of the guidance of attention in visual search for conjunctions? In the Guided Search model (GS), the slope of the RT × set size function (at least, for target present trials) reflects the average proportion of distractors that are selected before the target is selected (Wolfe, 1994, 2007; Wolfe et al., 1989). In GS, that selection is based on a combination of bottom-up, stimulus-driven activation (salience) and top-down, user-driven activation. Thus, a red item among green items has high bottom-up salience regardless of the identity of the target. If the target is known to be, for example, a red, vertical, rectangular item, all red items, all vertical items, and all rectangular items will receive some top-down activation based on the features they share with the target. Top-down and bottom-up activation are summed across features into a “priority” map (Serences & Yantis, 2006). The relative priority of the target produces the efficiency of search. This could be calculated in various ways but one useful proposal comes from Moran, Zehetleitner, Müller, and Usher (2013) who suggest that
The results of the experiments reported here show that probability of selecting a target cannot be a simple linear function of the number of target features that are present in the displays. If it were linear, the slope for 3D(2) would be roughly twice that for 3D(1) because the sum of all priorities in 3D(2) would be twice that for 3D(1) and, consequently, the probability of selecting a target on the current step would be reduced by half. Moreover, the sum of priorities would be the same in 3D(1) and 3D(012) conditions. Instead, the data suggest that distractors that share 2 out of 3 features with the target have a high probability of having a larger activation than the target element. Distractors that share 1 out of 3 features with the target have a much lower probability of having larger activation than the target element; yet, not quite as low as distractors sharing zero features. The results are in line with a signal detection account of the selection process (see fig. 15), similar to earlier proposals for target selection in GS (Wolfe, 1994). Here selection priority is determined by signal strength, which is computed as the sum of target feature signals, bottom-up signals plus some Gaussian noise. In this case, there will be a high probability of selecting a distractor when the distribution of the distractor signal overlaps with the body of the target signal distribution as illustrated in figure 15. The influence of distractors quickly drops and then levels off when only the tail of target and distractor signal distributions overlap. As noted above, this non-linear probability function would account for the difference between 3D(1) and 3D(012).
The forgoing gives an account of the sharing effect but it would not explain the grouping effects since the priority calculations, just described, operate at the level of isolated items in the display. However, as Proulx (2007) pointed out, there may have been an overreliance on top-down signals in previous accounts of conjunction search effects. Indeed, looking closer at the bottom-up signals that feed into the overall priority map, we can account for the grouping effects in the present studies. Firstly, it is known that bottom-up salience is dependent on neighborhood effects. Thus, a green item is salient if surrounded by red. The same green is less salient if surrounded by yellow, even if the red items are present elsewhere in the display (Nothdurft, 1993). This is cartooned in Figure 16. The figure shows examples of 3D(012) and 26D(012) trials. The figure shows the boundaries of the sets of red, vertical, and rectangular objects in both cases. In this experiment, these boundaries will often be locations with high local contrast and thus with high bottom-up salience. Note that there are other boundaries that could be drawn: blue vs green, jagged vs. oval, and so forth. It should be clear that the 26D condition produces a much ‘noisier’ landscape of bottom-up saliency than does the 3D condition. Note that all of these local contrasts between items should be thought of as noise. They do not help the participant to find the target. The target is found by guiding attention to red, to vertical, and to rectangles. In 3D(012), on the right of Figure 15, the local contrasts in each feature line up with each other. In 26D(012), they do not line up. If we assume the sum of three, aligned local contrasts is less than three times as attention-grabbing as a single-feature local contrast, then the 26D(012) condition would be “noisier” than the 3D(012). A similar observation is noted by Rosenholtz and colleagues in relation to visual scene complexity (Rosenholtz, Li, & Nakano, 2007). When feature covariance is high, scenes appear less cluttered, and a larger range of target feature-combinations are salient; thus, giving a plausible account of the basic grouping effect, in these experiments.
Figure 16.
In the 3D(012) conditions, groups of items, based on features line up across different attributes. Thus, red, jagged, and vertical groups are similar. In the 26D(012) condition, this is not the case.
Preattentive Binding
The original motivation for this work was to examine the mechanisms that could lead to the conjunctive effects on search efficiency that were reported by Found (1998). Our results support the claim that conjunctive feature variation can influence search efficiency. However, following the argument, laid out above, this does not need to imply preattentive feature binding. The grouping and sharing effects allow the results to be explained within the context of a model like Guided Search that does not permit preattentive binding. At the same time, it must be noted that the current results do not rule out the possibility of preattentive binding. Certainly, there is evidence for preattentive interactions between separate dimensions like color and orientation. For example, Houck and Hoffman (1986) showed that a McCollough effect (McCollough, 1965) could be obtained with stimuli that were largely unattended. In the McCollough effect, participants adapt to orthogonal colored gratings; e.g., red verticals and green horizontals. This produces an orientation contingent color aftereffect. Vertical black and white gratings will now appear tinged green while horizontal gratings will appear pink. If no interaction between color and orientation occurs without attention, this should not happen if the stimuli are unattended, but it does happen.
In a quite different task, the presence of a combination of two feature dimensions can be responded to more quickly than would be predicted by independent processing of those dimensions (e.g., Krummenacher et al., 2001, 2002; Mordkoff & Danek, 2011; Mordkoff, Yantis, & Egeth, 1990; Weidner & Müller, 2013). Specifically, violations of Miller’s race model inequality (Miller, 1982) suggest that cross-dimensional target signals are combined, or co-activate, prior to selection. We have not done it, but it seems likely that a non-linear effect of sharing features could be incorporated into Mordkoff’s coactivation work or into the Krummenacher et al. Dimension Weighting account in order to accommodate the sharing factor in the triple conjunction experiments, reported here. Grouping effects, while not a specific part of these accounts, are not antithetical to them either.
There is some debate regarding the interpretation of the conjunction detections that violate Miller’s race model inequality. Mordkoff, Yantis, & Egeth (1990), among others, have argued that violation of the race model inequality implies that features for more than one object can be bound in parallel (see also Mordkoff & Danek, 2011). On the other hand, several results suggest that the pre-selective co-activation does not entail recognition (e.g., Weidner & Müller, 2013). Krummenacher, Grubert, and Müller (2010), for example, found that the race model inequality was not violated for single-element redundant target trials, thereby indicating that co-activations are separate from recognition processes. In general, it seems quite clear that different dimensions interact at early stages of neural processing in the visual system (Seymour, Clifford, Logothetis, & Bartels, 2010). This can be taken as evidence for preattentive binding (e.g., Mordkoff & Halterman, 2008). Others have used similar results to argue that the whole idea of binding is an “ill-posed” problem (DiLollo, 2012). However, if binding is thought of as a required step on route to object recognition, then co-occurrence (and co-activation) is not the same as binding though the distinction can be hard to see in many laboratory tasks (Krummenacher et al., 2010; Wolfe, 2012). For example, a standard search for a red vertical line among red horizontal and green vertical distractors could be performed based on either binding or co-occurrence of features because one could find a red vertical on the basis of the place where red and vertical co-occurred or by finding a pre-attentively bound red vertical object. The distinction between co-occurrence and binding is clearer, when visual search tasks are devised in which the same features co-occur in the targets and distractors, differing only in the arrangement of those features. Under these conditions, search tends to be markedly inefficient and the evidence for preattentive binding becomes hard to find (Wolfe & Bennett, 1997). Thus, in Figure 17, search for the plus with a gray horizontal component is inefficient because, we would argue, prior to the arrival of attention, all of these items are black and gray and vertical and horizontal. All the bags of features are the same. Co-occurrence is not enough to do the task.
Figure 17.
Stimuli where preattentive binding does not appear to happen. Find the plus with black vertical and gray horizontal components (from Wolfe and Bennett, 1997)
In conclusion, search for higher-order conjunctions can be very efficient. This efficiency can be explained by proposing very effective guidance of attention to target items on the basis of top-down knowledge of the target features. The simplest accounts of this guidance are inadequate as Found (1998) noted 16 years ago. It is possible that these deviations from simplicity reflect preattentive binding of conjunctions. However, it is not necessary to invoke binding without attention. A non-linear effect of the number of shared features and/or a non-linearity in bottom-up, local salience can also account for these effects.
Table 1.
Reaction time analysis for Experiment 1a. GGe refers to Greenhouse-Geisser epsilon and is reported when significant, ges denotes generalized eta squared.
| Target present | Target absent | |||||||
|
|
||||||||
| ANOVA | ||||||||
| Effects | F | GGe | p | ges | F | GGe | p | ges |
|
| ||||||||
| Set size (1, 11) | 28.14 | n.s. | <.001*** | .08 | 21.79 | n.s. | <.001*** | .10 |
| Distractor set (3, 33) | 27.08 | .50 | <.001*** | .14 | 28.85 | .36 | <.001*** | .28 |
| Set size × Distractor (3, 33) | 7.54 | n.s. | <.001*** | .01 | 14.62 | .44 | <.001*** | .03 |
|
| ||||||||
| Reaction time – distractor type main effect | ||||||||
| Comparison | F(1,11) | P | ges | F(1,11) | P | ges | ||
|
| ||||||||
| 26D – 5D | 25.71 | .014* | .44 | 52.81 | <.001*** | .63 | ||
| 26D – 3D(012) | 32.49 | <.001*** | .60 | 33.30 | <.001*** | .65 | ||
| 26D – 3D(1) | 35.08 | <.001*** | .63 | 33.80 | <.001*** | .67 | ||
| 5D – 3D(012) | 12.86 | .014* | .31 | 19.55 | .002** | .52 | ||
| 5D – 3D(1) | 11.89 | .014* | .33 | 21.68 | .002** | .56 | ||
| 3D(012) – 3D(1) | 0.59 | .459 | .01 | 5.87 | .034* | .08 | ||
|
| ||||||||
| Slope – distractor type × set size interaction | ||||||||
| Comparison | F(1,11) | P | ges | F(1,11) | P | Ges | ||
|
| ||||||||
| 26D – 5D | 4.41 | .177 | .05 | 13.79 | .012* | .04 | ||
| 26D – 3D(012) | 14.65 | .018* | .10 | 17.33 | .002** | .65 | ||
| 26D – 3D(1) | 13.68 | .020* | .14 | 16.46 | .010* | .15 | ||
| 5D – 3D(012) | 2.27 | .320 | .03 | 14.29 | .012* | .10 | ||
| 5D – 3D(1) | 9.26 | .044* | .07 | 11.69 | .014* | .09 | ||
| 3D(012) – 3D(1) | 0.18 | .684 | .01 | 0.46 | .510 | .01 | ||
Note: All post-hoc comparison p-values are Bonferroni-Holm corrected.
corresponds to significance below .05 level,
corresponds to significance below .01 level,
corresponds to significance below .001 level.
References
- Bilsky AA, Wolfe JM. Part-whole information is useful in size × size but not in orientation × orientation conjunction searches. Perception and Psychophysics. 1995;57(6):749–760. doi: 10.3758/bf03206791. [DOI] [PubMed] [Google Scholar]
- Cousineau D. Confidence intervals in within-subject designs: A simpler solution to Loftus and Masson’s method. Tutorials in Quantitative Methods for Psychology. 2005;1(1):42–45. [Google Scholar]
- Cousineau D, O’Brian F. Error bars in within-subject designs: A comment on Baguley (2012) Behavior Research Methods. 2014 doi: 10.3758/s13428-013-0441-z. In Press. [DOI] [PubMed] [Google Scholar]
- Dehaene S. Discriminability and dimensionality effects in visual search for featural conjunctions: a functional pop-out. Perception and Psychophysics. 1989;46(1):72–80. doi: 10.3758/bf03208076. [DOI] [PubMed] [Google Scholar]
- Dick M, Ullman S, Sagi D. Parallel and serial processes in motion detection. Science. 1987;237:400–402. doi: 10.1126/science.3603025. [DOI] [PubMed] [Google Scholar]
- DiLollo V. The feature- binding problem is an ill-posed problem. Trends in Cognitive Sciences. 2012;16(6):317–321. doi: 10.1016/j.tics.2012.04.007. [DOI] [PubMed] [Google Scholar]
- Driver J, McLeod P, Dienes Z. Motion coherence and conjunction search: implications for guided search theory. Perception and Psychophysics. 1992;51(1):79–85. doi: 10.3758/bf03205076. [DOI] [PubMed] [Google Scholar]
- Duncan J. Target and nontarget grouping in visual search. Perception and Psychophysics. 1995;57(1):117–20. doi: 10.3758/bf03211854. [DOI] [PubMed] [Google Scholar]
- Duncan J, Humphreys GW. Visual search and stimulus similarity. Psychological Review. 1989;96(3):433–58. doi: 10.1037/0033-295x.96.3.433. [DOI] [PubMed] [Google Scholar]
- Eckstein MP. The lower visual search efficiency for conjunctions is due to noise and not serial attentional processing. Psychological Science. 1998;9(2):111–118. [Google Scholar]
- Egeth HE, Virzi RA, Garbart H. Searching for conjunctively defined targets. Journal of Experimental Psychology: Human Perception and Performance. 1984;10:32–39. doi: 10.1037//0096-1523.10.1.32. [DOI] [PubMed] [Google Scholar]
- Enns JT, Rensink RA. Influence of scene-based properties on visual search. Science. 1990;247(4943):721–723. doi: 10.1126/science.2300824. [DOI] [PubMed] [Google Scholar]
- Eriksen BA, Eriksen CW. Effects of noise letters upon the identification of a target letter in a nonsearch task. Perception & Psychophysics. 1974;16:143–149. [Google Scholar]
- Eriksen CW, Hoffman JE. The extent of processing of noise elements during selective encoding from visual displays. Perception & Psychophysics. 1973;14:155–160. [Google Scholar]
- Found A. Parallel coding of conjunctions in visual search. Perception and Psychophysics. 1998;60(7):1117–27. doi: 10.3758/bf03206162. [DOI] [PubMed] [Google Scholar]
- Friedman-Hill SR, Wolfe JM. Second-order parallel processing: Visual search for the odd item in a subset. Journal of Experimental Psychology: Human Perception and Performance. 1995;21(3):531–551. doi: 10.1037//0096-1523.21.3.531. [DOI] [PubMed] [Google Scholar]
- Green DM, Swets JA. Signal detection theory and psychophysics. New York: Wiley; 1966. [Google Scholar]
- Guest D, Lamberts K. The time course of similarity effects in visual search. Journal of Experimental Psychology: Human perception and performance. 2011;37(6):1667–88. doi: 10.1037/a0025640. [DOI] [PubMed] [Google Scholar]
- Houck MR, Hoffman JE. Conjunction of color and form without attention. Evidence from an orientation-contingent color aftereffect. Journal of Experimental Psychology: Human Perception and Performance. 1986;12:186–199. doi: 10.1037//0096-1523.12.2.186. [DOI] [PubMed] [Google Scholar]
- Humphreys GW, Quinlan PT, Riddoch MJ. Grouping processes in visual search: Effects with single and combined-feature targets. Journal of Experimental Psychology: General. 1989;118(3):258–279. doi: 10.1037//0096-3445.118.3.258. [DOI] [PubMed] [Google Scholar]
- Kunar MA, Flusberg SJ, Wolfe JM. Time to guide: Evidence for delayed attentional guidance in contextual cueing. Visual Cognition. 2008;16(6):804–825. doi: 10.1080/13506280701751224. [DOI] [PMC free article] [PubMed] [Google Scholar]
- Kunar MA, Flusberg SJ, Horowitz TS, Wolfe JM. Does contextual cuing guide the deployment of attention? Journal of Experimental Psychology: Human Perception and Performance. 2007;33(4):816–28. doi: 10.1037/0096-1523.33.4.816. [DOI] [PMC free article] [PubMed] [Google Scholar]
- Kristjánsson A, Wang DL, Nakayama K. The role of priming in conjunctive visual search. Cognition. 2002;85:37–52. doi: 10.1016/s0010-0277(02)00074-4. [DOI] [PubMed] [Google Scholar]
- Krummenacher J, Grubert A, Müller HJ. Inter-trial and redundant-signals effects in visual search and discrimination tasks: Separable pre-attentive and post-selective effects. Vision Research. 2010;50:1382–1395. doi: 10.1016/j.visres.2010.04.006. [DOI] [PubMed] [Google Scholar]
- Krummenacher J, Müller HJ, Heller D. Visual search for dimensionally redundant pop-out targets: Evidence for parallel-coactive processing of dimensions. Perception & Psychophysics. 2001;63:907–917. doi: 10.3758/bf03194446. [DOI] [PubMed] [Google Scholar]
- Krummenacher J, Müller HJ, Heller D. Visual search for dimensionally redundant pop-out targets: Parallel-coactive processing of dimensions is location-specific. Journal of Experimental Psychology: Human Perception & Performance. 2002;28:1303–1322. [PubMed] [Google Scholar]
- Kyllingsbaek K, Sy J, Giesbrecht B. Understanding the allocation of attention when faced with varying perceptual load in partial report: A computational approach. Neuropsychologia. 2011;49:1487–1497. doi: 10.1016/j.neuropsychologia.2010.11.039. [DOI] [PubMed] [Google Scholar]
- Lamberts K. The Time Course of Categorization. Journal of Experimental Psychology: Learning, Memory, and Cognition. 1998;24(3):695–711. [Google Scholar]
- Lavie N, Torralbo A. Dilution: A theoretical burden or just load? A reply to Tsal and Benoni (2010) Journal of Experimental Psychology: Human Perception and Performance. 2010;36(6):1657–1664. doi: 10.1037/a0020733. [DOI] [PMC free article] [PubMed] [Google Scholar]
- Lavie N, Tsal Y. Perceptual load as a major determinant of the locus of selection in visual attention. Perception and Psychophysics. 1994;56(2):183–197. doi: 10.3758/bf03213897. [DOI] [PubMed] [Google Scholar]
- McCollough C. Color adaptation of edge-detectors in the human visual system. Science. 1965;149:1115–1116. doi: 10.1126/science.149.3688.1115. [DOI] [PubMed] [Google Scholar]
- McElree B, Carrasco M. The temporal dynamics of visual search: evidence for parallel processing in feature and conjunction searches. Journal of Experimental Psychology: Human Perception and Performance. 1999;25(6):1517–1539. doi: 10.1037//0096-1523.25.6.1517. [DOI] [PMC free article] [PubMed] [Google Scholar]
- McLeod P, Driver J, Dienes Z, Crisp J. Filtering by movement in visual search. Journal of Experimental Psychology: Human Perception and Performance. 1991;17(1):55–64. doi: 10.1037//0096-1523.17.1.55. [DOI] [PubMed] [Google Scholar]
- Moran R, Zehetleitner MH, Mueller HJ, Usher M. Competitive Guided Search: Meeting the challenge of benchmark RT distributions. Journal of Vision. 2013;13 doi: 10.1167/13.8.24. #24. [DOI] [PubMed] [Google Scholar]
- Mordkoff JT, Danek RH. Dividing attention between color and shape revisited: Redundant targets coactivate only when parts of the same perceptual object. Attention, Perception, and Psychophysics. 2011;73:103–112. doi: 10.3758/s13414-010-0025-2. [DOI] [PubMed] [Google Scholar]
- Mordkoff JT, Halterman R. Feature integration without visual attention: evidence from the correlated flankers task. Psychonomic Bulletin Review. 2008;15(2):385–389. doi: 10.3758/pbr.15.2.385. [DOI] [PubMed] [Google Scholar]
- Mordkoff JT, Yantis S, Egeth HE. Detecting conjunctions of color and form in parallel. Perception & Psychophysics. 1990;48(2):157–168. doi: 10.3758/bf03207083. [DOI] [PubMed] [Google Scholar]
- Morey RD. Confidence Intervals from Normalized Data: A correction to Cousineau (2005) Tutorial in Quantitative Methods for Psychology. 2008;4(2):61–64. [Google Scholar]
- Nakayama K, Silverman GH. Serial and parallel processing of visual feature conjunctions. Nature. 1986;320:264–265. doi: 10.1038/320264a0. [DOI] [PubMed] [Google Scholar]
- Nothdurft H-C. Saliency effects across dimensions in visual search. Vision Research. 1993;33(5/6):839–844. doi: 10.1016/0042-6989(93)90202-8. [DOI] [PubMed] [Google Scholar]
- Palmer J. Attention in visual search: Distinguishing four causes of a set size effect. Current Directions in Psychological Science. 1995;4(4):118–123. [Google Scholar]
- Pashler H. Detecting conjunctions of color and form: Reassessing the serial search hypothesis. Perception & Psychophysics. 1987;41(3):191–201. doi: 10.3758/bf03208218. [DOI] [PubMed] [Google Scholar]
- Proulx MJ. Bottom-up guidance in visual search for conjunctions. Journal of Experimental Psychology: Human perception and performance. 2007;35(1):48–56. doi: 10.1037/0096-1523.33.1.48. [DOI] [PubMed] [Google Scholar]
- Quinlan PT, Humphreys GW. Visual search for targets defined by combinations of color, shape, and size: An examination of the task constraints on feature and conjunction searches. Perception and Psychophysics. 1987;41:455–472. doi: 10.3758/bf03203039. [DOI] [PubMed] [Google Scholar]
- Roggeveen AB, Kingstone A, Enns JT. Influence of inter-item symmetry in visual search. Spatial Vision. 2004;17(4–5):443–64. doi: 10.1163/1568568041920159. [DOI] [PubMed] [Google Scholar]
- Rosenholtz R, Li Y, Nakano L. Measuring visual clutter. Journal of Vision. 2007;7(2):1–22. doi: 10.1167/7.2.17. [DOI] [PubMed] [Google Scholar]
- Serences JT, Yantis S. Selective visual attention and perceptual coherence. Trends in Cognitive Sciences. 2006;10(1):38–45. doi: 10.1016/j.tics.2005.11.008. [DOI] [PubMed] [Google Scholar]
- Seymour K, Clifford CW, Logothetis NK, Bartels A. Coding and binding of color and form in visual cortex. Cerebral Cortex. 2010;20(8):1946–1954. doi: 10.1093/cercor/bhp265. [DOI] [PubMed] [Google Scholar]
- Takeda Y, Phillips S, Kumada T. A conjunctive feature similarity effect for visual search. Quarterly Journal of Experimental Psychology. 2007;60(2):186–90. doi: 10.1080/17470210601063142. [DOI] [PubMed] [Google Scholar]
- Townsend JT. A note on the identification of parallel and serial processes. Perception and Psychophysics. 1971;10:161–163. [Google Scholar]
- Townsend JT, Wenger MJ. The serial-parallel dilemma: A case study in a linkage of theory and method. Psychonomic Bulletin & Review. 2004;11(3):391–418. doi: 10.3758/bf03196588. [DOI] [PubMed] [Google Scholar]
- Tsal Y, Benoni H. Diluting the burden of load: Perceptual load effects are simply dilution effects. Journal of Experimental Psychology: Human Perception and Performance. 2010;36(6):1645–1656. doi: 10.1037/a0018172. [DOI] [PubMed] [Google Scholar]
- Treisman A, Gelade G. A feature-integration theory of attention. Cognitive Psychology. 1980;12:97–136. doi: 10.1016/0010-0285(80)90005-5. [DOI] [PubMed] [Google Scholar]
- Treisman A, Sato S. Conjunction search revisited. Journal of experimental psychology: Human perception and performance. 1990;16(3):459–478. doi: 10.1037//0096-1523.16.3.459. [DOI] [PubMed] [Google Scholar]
- Verghese P, Nakayama K. Stimulus discriminability in visual search. Vision Research. 1994;34(18):2453–2461. doi: 10.1016/0042-6989(94)90289-5. [DOI] [PubMed] [Google Scholar]
- Weidner R, Müller HJ. Dimensional weighting of primary and secondary target-defining dimensions in visual search for singleton conjunction targets. Psychological Research. 2009;73:198–211. doi: 10.1007/s00426-008-0208-9. [DOI] [PubMed] [Google Scholar]
- Weidner R, Müller HJ. Dimensional weighting in cross-dimensional singleton conjunction search. Journal of Vision. 2013;13(3):1–22. doi: 10.1167/13.3.25. 25. [DOI] [PubMed] [Google Scholar]
- Williams DE, Reingold EM. Preattentive guidance of eye movements during triple conjunction search tasks: The effects of feature discriminability and saccadic amplitude. Psychonomic Bulletin & Review. 2001;8(3):476–488. doi: 10.3758/bf03196182. [DOI] [PubMed] [Google Scholar]
- Wolfe JM. "Effortless" texture segmentation and "parallel" visual search are not the same thing. Vision Research. 1992;32(4):757–763. doi: 10.1016/0042-6989(92)90190-t. [DOI] [PubMed] [Google Scholar]
- Wolfe JM. Guided Search 2.0: A revised model of visual search. Psychonomic Bulletin and Review. 1994;1(2):202–238. doi: 10.3758/BF03200774. [DOI] [PubMed] [Google Scholar]
- Wolfe JM. What can 1 million trials tell us about visual search? Psychological Science. 1998;9(1):33–39. [Google Scholar]
- Wolfe JM. Guided Search 4.0: Current Progress with a model of visual search. In: Gray W, editor. Integrated Models of Cognitive Systems. New York: Oxford; 2007. pp. 99–119. [Google Scholar]
- Wolfe JM. The binding problem lives on: Comment on Di Lollo. Trends in Cognitive Sciences. 2012 doi: 10.1016/j.tics.2012.04.013. in press. [DOI] [PMC free article] [PubMed] [Google Scholar]
- Wolfe JM, Bennett SC. Preattentive Object Files: Shapeless bundles of basic features. Vision Research. 1997;37(1):25–43. doi: 10.1016/s0042-6989(96)00111-3. [DOI] [PubMed] [Google Scholar]
- Wolfe JM, Cave KR, Franzel SL. Guided search: an alternative to the feature integration model for visual search. Journal of Experimental Psychology: Human Perception and Performance. 1989;15(3):419–33. doi: 10.1037//0096-1523.15.3.419. [DOI] [PubMed] [Google Scholar]
- Wolfe JM, Friedman-Hill SR, Bilsky AB. Parallel processing of part/whole information in visual search tasks. Perception and Psychophysics. 1994;55(5):537–550. doi: 10.3758/bf03205311. [DOI] [PubMed] [Google Scholar]
- Wolfe JM, Yu KP, Stewart MI, Shorter AD, Friedman-Hill SR, Cave KR. Limitations on the parallel guidance of visual search: Color × color and orientation × orientation conjunctions. Journal of Experimental Psychology: Human Perception and Performance. 1990;16(4):879–892. doi: 10.1037//0096-1523.16.4.879. [DOI] [PubMed] [Google Scholar]


