Abstract
Introduction:
To compare mean best-corrected visual acuity (BCVA), retinal sensitivity (RS), and bivariate contour ellipse area (BCEA) in patients with adult-onset foveomacular vitelliform dystrophy (AOFVD) and healthy subjects (HSs), reporting also functional disease-related changes in the different stages of the AOFVD disease.
Materials and Methods:
In this observational cross-sectional study, a total of 19 patients (30 eyes; 12 female and 7 male) with AOFVD were enrolled, and 30 patients (30 eyes; 16 female and 14 male) were recruited as age-matched control group (74.36 ± 9.17 years vs. 71.83 ± 6.99 years respectively, P = 0.11). All patients underwent a complete ophthalmologic examination, fundus autofluorescence and fluorescein angiography, spectral-domain optical coherence tomography and microperimetry (MP)-1 analysis. The data collection included mean BCVA, mean RS measured by means of MP-1, BCEA, and central retinal thickness.
Results:
All the functional parameters (BCVA, RS, and BCEA) were significantly worse in AOFVD group than HS. Subgroup analysis showed that the most significant functional changes, quantified by mean BCVA, RS, and BCEA, were in the atrophic stage (P = 0.03, P = 0.01, and P = 0.001, respectively). All the functional parameters were well correlated in the different stages.
Conclusions:
This study further confirms the good visual prognosis in the AOFVD eyes. Fixation stability measurement using BCEA demonstrates good evaluation of visual performance integrating traditional functional parameters. It may also serve for further rehabilitative purposes in atrophic eyes.
Keywords: Adult-onset foveomacular vitelliform dystrophy, bivariate contour ellipse area, fixation, microperimetry
Adult-onset foveomacular vitelliform dystrophy (AOFVD), first described by Gass[1] in 1974, is characterized by a yellow, solitary, round or oval subretinal macular lesion that resembles juvenile-onset vitelliform macular dystrophy and Best's disease. Further studies showed that AOFVD was a heterogeneous group of disorders displaying variability in the size shape, pigmentary changes, and distribution of the lesions (lesion often centered by a pigmented spot) and a number of different terms and abbreviations for this disease.[2,3]
Clinicopathological studies showed a massive accumulation of lipofuscin pigments within the macular retinal pigment epithelium (RPE) and loss of the RPE and photoreceptor cell layer with infiltration of pigment containing macrophages in the central area.[4,5,6,7] Recently, spectral-domain optical coherence tomography (SD-OCT) studies confirmed the hypothesis that the location of the yellowish material is under the sensory retina and above the RPE.[8,9,10]
Fundus-related perimetry, also known as microperimetry (MP), has been used to evaluate macular sensitivity and retinal fixation in patients with various macular diseases.[11,12,13] The most commonly used fundus perimeter device is the MP-1 microperimeter (Nidek Technologies, Japan). The widely accepted description of the stability and location of fixation is based on Fujii et al.'s original classification.[14] Various studies have demonstrated that a bivariate contour ellipse area (BCEA) can describe the locus of fixation in normal and affected individuals.[15,16,17,18,19,20] The area of this ellipse gives an indication of fixation stability, with larger areas corresponding to poorer fixation stability. This method is considered superior than conventional three-step Fujii's classification in quantifying fixation.[21]
The purpose of this study was to compare mean best-corrected visual acuity (BCVA), retinal sensitivity (RS), and BCEA in patients with AOFVD and healthy subjects (HSs), to analyze patients with AOFVD to evaluate functional disease-related changes, also in relation to the different stages of AOFVD disease; and finally to correlate mean BCEA with mean RS and mean BCEA in the different stages.
Materials and Methods
In this observational cross-sectional study, 30 eyes of 19 patients (12 females and 7 males) with AOFVD were enrolled. Thirty eyes of 30 patients (14 males and 16 females) volunteer HS were enrolled as control group.
All participants gave written informed consent before enrollment. Institutional Board Approval was obtained from Ethics Committee of our institution, and the research conformed to the Declaration of Helsinki.
Inclusion criteria were patients in all stages of AOFVD disease diagnosed by means of fundus autofluorescence (FAF), fluorescein angiography (FA), and SD-OCT; age ≥50 years; normal or subnormal electrooculogram findings; normal electroretinogram findings and color vision. We excluded patients who had a history of vitreoretinal disease; history of intravitreal corticosteroid injection, anti-vascular endothelial growth factor injection and photodynamic therapy; refractive errors more than ±6 diopters (D); amblyopia; history of intraocular surgery within 6 months. Exclusion criteria were the same for both groups.
All patients underwent a complete ophthalmologic examination, including BCVA using the Snellen chart, biomicroscopy of the anterior segment, Goldmann applanation tonometry, dilated fundus examination with indirect ophthalmoscopy and SD-OCT scans (Spectralis OCT, Heidelberg, Germany), in a pattern of 20° × 15° raster scans, consisting of 19 high-resolution line scans using a volumetric software protocol. Central retinal thickness (CRT) was measured using standard protocols of the Heidelberg software.
FA and FAF (Spectralis, Heidelberg, Germany) were performed in all patients, to exclude the presence of choroidal neovascularization.
MP-1 analysis (MP-1, Nidek Technologies, Japan) was performed in all patients using a red cross of 2° such as a fixation target, white background illumination of 4 asb (1.27 cd/m2), Goldmann III stimuli, with a projection time of 200 ms, customized grid of 45 stimuli around 10°, centered on the fovea. We used a 4-2 staircase strategy and the initial projecting sensitivity was fixed at 8 dB. Patients underwent brief training at the beginning of each MP. The stability of fixation was quantified by calculating a BCEA encompassing 68% of fixation points (±1 standard deviation [SD]), using the formula previously developed by Timberlake et al.[16]
Patients with AOFVD were divided into four groups depending on the clinical stage of the disease, as proposed for typical Best disease (1) vitelliform stage; (2) pseudohypopyon stage; (3) vitelliruptive stage; and (4) atrophic stage; based on the overall appearance of the yellowish material. We also divided patients into two groups on the basis of the absence/presence of hyporeflective spaces previously assimilated to subretinal fluid.[9]
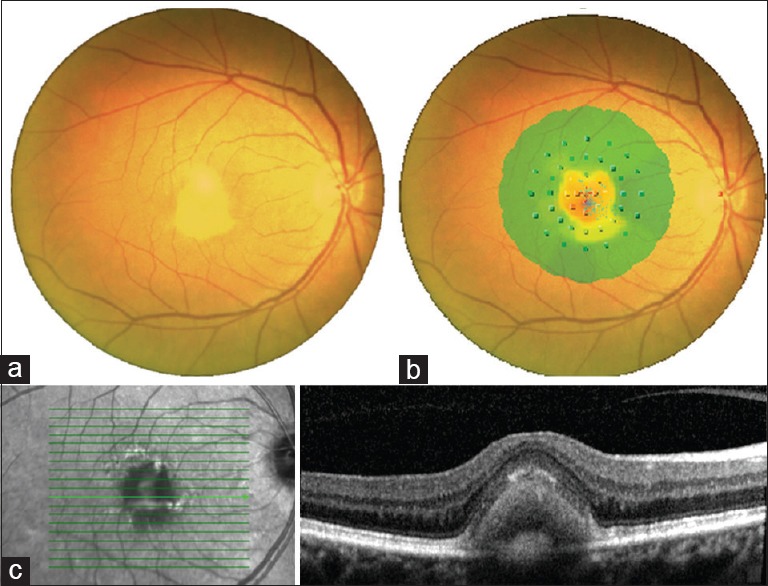
The data collection included mean BCVA, mean RS measured by means of MP-1, BCEA, and CRT [Fig. 1].
Figure 1.

Fundus photograph showing typical well-circumscribed yellow lesion (a), superimposition with microperimetric interpolated map (b) and spectral-domain optical coherence tomography scan showing highly reflective material between outer nuclear layer and retinal pigment epithelium (c)
Statistical analysis
All quantitative data were expressed as mean ± SD. The normality of distributions was verified by Shapiro–Wilk normality test. BCEA (deg2) was normalized by logarithmic transformation (Shapiro–Wilk test, P < 0.05). The BCVA was analyzed using the individual logarithm of the minimum angle of resolution (logMAR) acuity data points, converting from decimal unit. To compare HSs and AOFVD group a one-tailed unpaired t-test was performed. All patients were then stratified by stage of the disease to analyze differences between groups using a univariate analysis of variance with Tukey's post-hoc test. Pearson's correlation test was performed for comparisons. P <0.05 was considered statistically significant, and P < 0.001 was considered to be highly statistically significant. All calculations were carried out using the SPSS software (version 19; SPSS Inc., Chicago, IL, USA).
Results
A total of 19 patients (30 eyes; 12 female and 7 male) with AOFVD were enrolled, and 30 patients (30 eyes; 16 female and 14 male) were recruited as an age-matched control group (74.36 ± 9.17 years vs. 71.83 ± 6.99 years respectively, P = 0.11). Eleven patients (57.89%) had bilateral disease.
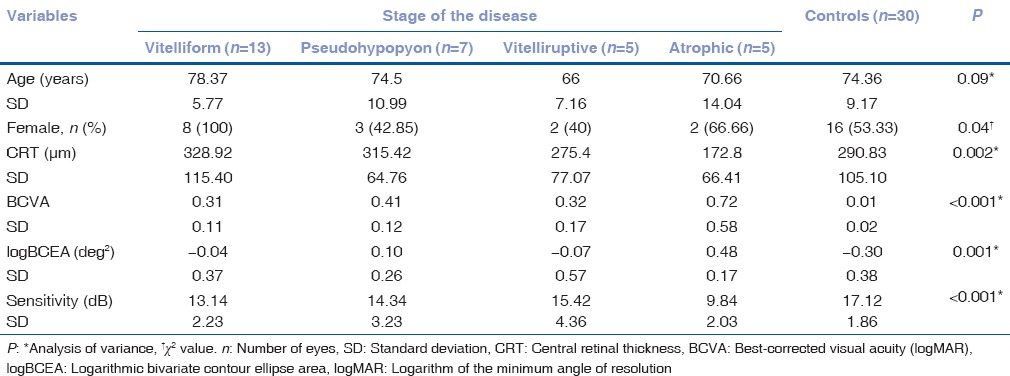
Mean BCVA (−0.41 ± 0.35 vs. 0.01 ± 0.02 logMAR, P < 0.001) and RS (13.43 ± 3.23 dB vs. 17.12 ± 1.86 dB, P < 0.001) in AOFVD group were overall reduced respect to control group. Moreover, mean logarithmic BCEA (logBCEA) was significantly higher in AOFVD group than HSs (0.07 ± 0.40 deg2 vs. −0.29 ± 0.38 deg2, P < 0.001).
We conducted a subgroup analysis of AOFVD patients according to the stage of the disease. The main characteristics of the subgroups are summarized in Table 1.
Table 1.
Main characteristics of the adult-onset foveomacular vitelliform dystrophy subgroups and controls

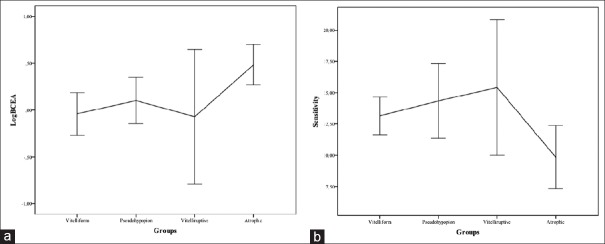
Post hoc analysis showed a significant reduction of logBCEA between vitelliform and atrophic subgroups (mean difference: 0.52 ± 0.12 deg2, P = 0.03). Moreover, we found a significant reduction in RS between pseudohypopyon and atrophic subgroups (mean difference: 4.50 ± 1.71 dB, P = 0.03) and between vitelliruptive and atrophic subgroups (mean difference: 5.58 ± 1.85 dB, P = 0.01) [Fig. 2].
Figure 2.
(a) Mean logarithmic bivariate contour ellipse area (deg2) and (b) retinal sensitivity (dB) in adult-onset foveomacular vitelliform dystrophy
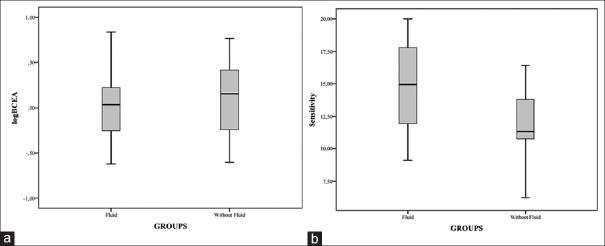
The subgroups analysis regarding subretinal fluid demonstrated that the mean logBCEA did not change significantly between groups (−0.07 deg2, 95% confidence interval [CI]: −0.38–0.25, P = 0.62). Instead mean RS significantly increased in the group without intraretinal fluid (2.68 dB, 95% CI: 0.26–5.09, P = 0.03) [Fig. 3].
Figure 3.
(a) Mean logarithmic bivariate contour ellipse area (deg2) and (b) retinal sensitivity (dB) in adult-onset foveomacular vitelliform dystrophy patients with or without subretinal fluid
The relationship between BCVA and BCEA was significant for each stage of the disease; increasing in logMAR visual acuity lead to BCEA enlargement in vitelliform (r = 0.36, P = 0.001), pseudohypopyon (r = 0.28, P = 0.002), vitelliruptive (r = 0.32, P = 0.001), and atrophic stages (r = 0.41, P < 0.001). Similar relationship was found between RS and BCVA in vitelliform (r = −0.43, P = 0.001), pseudohypopyon (r = −0.19, P = 0.03), and atrophic stages (r = −0.30, P < 0.001) but not in vitelliruptive stage (r = −0.05, P = 0.06).
Discussion
In this observational study, we analyzed the functional disease related-changes in patients with AOFVD. We evaluated BCVA, RS, and fixation stability using BCEA analysis at different stages of disease to investigate the effect of morphological features on retinal function.
Not surprisingly, in the AOFVD group, all the functional parameters are significantly reduced when compared to the HSs. The most significant functional decay occurs in the atrophic stage, confirming findings previously reported.[22,23,24] Variable degrees of visual dysfunction were described, but usually, AOFVD patients have a good preservation of visual acuity.[3]
In this study, we first reported the analysis of fixation stability using BCEA in the AOFVD eyes. It demonstrated a good relationship with BCVA at each stage of the disease, confirming its ability to reflect visual function and disease-related functional changes. Similar results were obtained with RS that negatively correlated with BCVA, but not in vitelliruptive stage. The negative correlation is easily explained with the use of logMAR acuity to quantify BCVA. However, we can speculate that RS and BCEA are both useful methods to analyze visual function among different AOFVD stages.
BCEA is a methodology used to quantify fixation stability, based on the SD of the horizontal and vertical eye movements, which is represented by a bivariate normal ellipse that enclosed fixation points. Using logBCEA, an interval variable has several advantages: it contains more information than the three-step grading scale, its variability is independent of the magnitude, and its quantitative expression is useful for statistical analyses in clinical trials.[16,21] Moreover, the Fujii's classification has significant limitations: it does not make allowances for the typical elliptical nature of fixation distributions[25] or for the multimodal fixation patterns frequently exhibited by people with macular disease.[26,27,28,29] It cannot differentiate between a subject who has good fixation within two discrete, yet spatially distant, retinal loci and one who has genuinely poor fixation, and is very poorly related to any parameter of reading.
The natural course of the AOFVD lesion includes vitelliform collapse and outer retinal atrophy. The progression in the atrophic stage usually takes years to develop.[2,3,22] It is also well known that patients with progressive central scotoma use self-adaptive strategies to use peripheral retina in place of damage fovea.[26] Low vision rehabilitation is effective in such cases, especially to maintain and optimize reading ability.[30,31,32] In our opinion, BCEA collection has a dual implication; it not only can integrate visual function evaluation but also can identify patients who need visual rehabilitation to improve visual performance as well as the quality of life.
The accumulation of subretinal fluid and increase in choroidal thickness are related to inflammatory or damaged RPE attempts to remove waste products, water and acid product of metabolism.[33,34] In our series, the presence of subretinal fluid did not influence visual function, but conversely, visual function was more affected in eyes without fluid. Vitelliform and atrophic are both “without fluid” stages, thus this finding may further corroborate the visual function decline in atrophic eyes.
The main limitation of the present study is the small sample size, even if AOFVD is not a frequent disease. Moreover, we took into account morphological stages solely but not microstructural alterations.
Conclusions
Our findings further confirm that AOFVD patients have a good functional prognosis, because fixation stability, RS and visual acuity remain relatively unaffected until the late stage of the disease. Moreover, fixation stability measurement using BCEA allows a good quantification of visual performance, detecting functional decline among AOFVD stages. Its use may integrate traditional parameters, ensuring an evaluation of possible candidates to any visual rehabilitation strategies.
Further studies will need to determine the effectiveness of visual rehabilitation strategies in the AOFVD eyes, to confirm the importance to add BCEA in visual assessment.
Financial support and sponsorship
Nil.
Conflicts of interest
There are no conflicts of interest.
References
- 1.Gass JD. A clinicopathologic study of a peculiar foveomacular dystrophy. Trans Am Ophthalmol Soc. 1974;72:139–56. [PMC free article] [PubMed] [Google Scholar]
- 2.Querques G, Forte R, Querques L, Massamba N, Souied EH. Natural course of adult-onset foveomacular vitelliform dystrophy: A spectral-domain optical coherence tomography analysis. Am J Ophthalmol. 2011;152:304–13. doi: 10.1016/j.ajo.2011.01.047. [DOI] [PubMed] [Google Scholar]
- 3.Renner AB, Tillack H, Kraus H, Kohl S, Wissinger B, Mohr N, et al. Morphology and functional characteristics in adult vitelliform macular dystrophy. Retina. 2004;24:929–39. doi: 10.1097/00006982-200412000-00014. [DOI] [PubMed] [Google Scholar]
- 4.Patrinely JR, Lewis RA, Font RL. Foveomacular vitelliform dystrophy, adult type. A clinicopathologic study including electron microscopic observations. Ophthalmology. 1985;92:1712–8. doi: 10.1016/s0161-6420(85)34097-6. [DOI] [PubMed] [Google Scholar]
- 5.Jaffe GJ, Schatz H. Histopathologic features of adult-onset foveomacular pigment epithelial dystrophy. Arch Ophthalmol. 1988;106:958–60. doi: 10.1001/archopht.1988.01060140104034. [DOI] [PubMed] [Google Scholar]
- 6.Dubovy SR, Hairston RJ, Schatz H, Schachat AP, Bressler NM, Finkelstein D, et al. Adult-onset foveomacular pigment epithelial dystrophy: Clinicopathologic correlation of three cases. Retina. 2000;20:638–49. doi: 10.1097/00006982-200011000-00009. [DOI] [PubMed] [Google Scholar]
- 7.Arnold JJ, Sarks JP, Killingsworth MC, Kettle EK, Sarks SH. Adult vitelliform macular degeneration: A clinicopathological study. Eye (Lond) 2003;17:717–26. doi: 10.1038/sj.eye.6700460. [DOI] [PubMed] [Google Scholar]
- 8.Puche N, Querques G, Benhamou N, Tick S, Mimoun G, Martinelli D, et al. High-resolution spectral domain optical coherence tomography features in adult onset foveomacular vitelliform dystrophy. Br J Ophthalmol. 2010;94:1190–6. doi: 10.1136/bjo.2009.175075. [DOI] [PubMed] [Google Scholar]
- 9.Freund KB, Laud K, Lima LH, Spaide RF, Zweifel S, Yannuzzi LA. Acquired vitelliform lesions: Correlation of clinical findings and multiple imaging analyses. Retina. 2011;31:13–25. doi: 10.1097/IAE.0b013e3181ea48ba. [DOI] [PubMed] [Google Scholar]
- 10.Benhamou N, Souied EH, Zolf R, Coscas F, Coscas G, Soubrane G. Adult-onset foveomacular vitelliform dystrophy: A study by optical coherence tomography. Am J Ophthalmol. 2003;135:362–7. doi: 10.1016/s0002-9394(02)01946-3. [DOI] [PubMed] [Google Scholar]
- 11.Midena E, Vujosevic S, Convento E, Manfre’ A, Cavarzeran F, Pilotto E. Microperimetry and fundus autofluorescence in patients with early age-related macular degeneration. Br J Ophthalmol. 2007;91:1499–503. doi: 10.1136/bjo.2007.119685. [DOI] [PMC free article] [PubMed] [Google Scholar]
- 12.Yamaike N, Kita M, Tsujikawa A, Miyamoto K, Yoshimura N. Perimetric sensitivity with the micro perimeter 1 and retinal thickness in patients with branch retinal vein occlusion. Am J Ophthalmol. 2007;143:342–4. doi: 10.1016/j.ajo.2006.09.034. [DOI] [PubMed] [Google Scholar]
- 13.Grenga P, Lupo S, Domanico D, Vingolo EM. Efficacy of intravitreal triamcinolone acetonide in long standing diabetic macular edema: A microperimetry and optical coherence tomography study. Retina. 2008;28:1270–5. doi: 10.1097/IAE.0b013e31817d5d1c. [DOI] [PubMed] [Google Scholar]
- 14.Fujii GY, de Juan E, Jr, Sunness J, Humayun MS, Pieramici DJ, Chang TS. Patient selection for macular translocation surgery using the scanning laser ophthalmoscope. Ophthalmology. 2002;109:1737–44. doi: 10.1016/s0161-6420(02)01120-x. [DOI] [PubMed] [Google Scholar]
- 15.Robert MS. Effect of target size, luminance, and color on monocular fixation. J Opt Soc Am. 1965;55:1158–64. [Google Scholar]
- 16.Timberlake GT, Sharma MK, Grose SA, Gobert DV, Gauch JM, Maino JH. Retinal location of the preferred retinal locus relative to the fovea in scanning laser ophthalmoscope images. Optom Vis Sci. 2005;82:177–85. doi: 10.1097/01.opx.0000156311.49058.c8. [DOI] [PubMed] [Google Scholar]
- 17.Crossland MD, Culham LE, Rubin GS. Fixation stability and reading speed in patients with newly developed macular disease. Ophthalmic Physiol Opt. 2004;24:327–33. doi: 10.1111/j.1475-1313.2004.00213.x. [DOI] [PubMed] [Google Scholar]
- 18.Dunbar HM, Crossland MD, Rubin GS. Fixation stability: A comparison between the Nidek MP-1 and the Rodenstock scanning laser ophthalmoscope in persons with and without diabetic maculopathy. Invest Ophthalmol Vis Sci. 2010;51:4346–50. doi: 10.1167/iovs.09-4556. [DOI] [PubMed] [Google Scholar]
- 19.Crossland MD, Dunbar HM, Rubin GS. Fixation stability measurement using the MP1 microperimeter. Retina. 2009;29:651–6. doi: 10.1097/IAE.0b013e318196bd65. [DOI] [PubMed] [Google Scholar]
- 20.Tarita-Nistor L, González EG, Markowitz SN, Steinbach MJ. Fixation characteristics of patients with macular degeneration recorded with the mp-1 microperimeter. Retina. 2008;28:125–33. doi: 10.1097/IAE.0b013e3180ed4571. [DOI] [PubMed] [Google Scholar]
- 21.Grenga PL, Fragiotta S, Meduri A, Lupo S, Marenco M, Vingolo EM. Fixation stability measurements in patients with neovascular age-related macular degeneration treated with ranibizumab. Can J Ophthalmol. 2013;48:394–9. doi: 10.1016/j.jcjo.2013.04.006. [DOI] [PubMed] [Google Scholar]
- 22.Chen KC, Jung JJ, Curcio CA, Balaratnasingam C, Gallego-Pinazo R, Dolz-Marco R, et al. Intraretinal hyperreflective foci in acquired vitelliform lesions of the macula: Clinical and histologic study. Am J Ophthalmol. 2016;164:89–98. doi: 10.1016/j.ajo.2016.02.002. [DOI] [PubMed] [Google Scholar]
- 23.Querques G, Bux AV, Prato R, Iaculli C, Souied EH, Delle Noci N. Correlation of visual function impairment and optical coherence tomography findings in patients with adult-onset foveomacular vitelliform macular dystrophy. Am J Ophthalmol. 2008;146:135–42. doi: 10.1016/j.ajo.2008.02.017. [DOI] [PubMed] [Google Scholar]
- 24.Parodi MB, Iacono P, Pedio M, Pece A, Isola V, Fachin A, et al. Autofluorescence in adult-onset foveomacular vitelliform dystrophy. Retina. 2008;28:801–7. doi: 10.1097/IAE.0b013e31816f859d. [DOI] [PubMed] [Google Scholar]
- 25.Sansbury RV, Skavenski AA, Haddad GM, Steinman RM. Normal fixation of eccentric targets. J Opt Soc Am. 1973;63:612–4. doi: 10.1364/josa.63.000612. [DOI] [PubMed] [Google Scholar]
- 26.Crossland MD, Culham LE, Kabanarou SA, Rubin GS. Preferred retinal locus development in patients with macular disease. Ophthalmology. 2005;112:1579–85. doi: 10.1016/j.ophtha.2005.03.027. [DOI] [PubMed] [Google Scholar]
- 27.Déruaz A, Whatham AR, Mermoud C, Safran AB. Reading with multiple preferred retinal loci: Implications for training a more efficient reading strategy. Vision Res. 2002;42:2947–57. doi: 10.1016/s0042-6989(02)00354-1. [DOI] [PubMed] [Google Scholar]
- 28.Lei H, Schuchard RA. Using two preferred retinal loci for different lighting conditions in patients with central scotomas. Invest Ophthalmol Vis Sci. 1997;38:1812–8. [PubMed] [Google Scholar]
- 29.Whittaker SG, Budd J, Cummings RW. Eccentric fixation with macular scotoma. Invest Ophthalmol Vis Sci. 1988;29:268–78. [PubMed] [Google Scholar]
- 30.Nguyen NX, Weismann M, Trauzettel-Klosinski S. Improvement of reading speed after providing of low vision aids in patients with age-related macular degeneration. Acta Ophthalmol. 2009;87:849–53. doi: 10.1111/j.1755-3768.2008.01423.x. [DOI] [PubMed] [Google Scholar]
- 31.McCabe P, Nason F, Demers Turco P, Friedman D, Seddon JM. Evaluating the effectiveness of a vision rehabilitation intervention using an objective and subjective measure of functional performance. Ophthalmic Epidemiol. 2000;7:259–70. doi: 10.1076/opep.7.4.259.4173. [DOI] [PubMed] [Google Scholar]
- 32.Hirata M, Tsujikawa A, Matsumoto A, Hangai M, Ooto S, Yamashiro K, et al. Macular choroidal thickness and volume in normal subjects measured by swept-source optical coherence tomography. Invest Ophthalmol Vis Sci. 2011;52:4971–8. doi: 10.1167/iovs.11-7729. [DOI] [PubMed] [Google Scholar]
- 33.Foulds WS. The choroidal circulation and retinal metabolism – An overview. Eye (Lond) 1990;4(Pt 2):243–8. doi: 10.1038/eye.1990.35. [DOI] [PubMed] [Google Scholar]
- 34.Grenga PL, Fragiotta S, Cutini A, Meduri A, Vingolo EM. Enhanced depth imaging optical coherence tomography in adult-onset foveomacular vitelliform dystrophy. Eur J Ophthalmol. 2016;26:145–51. doi: 10.5301/ejo.5000687. [DOI] [PubMed] [Google Scholar]


