Figure 4.

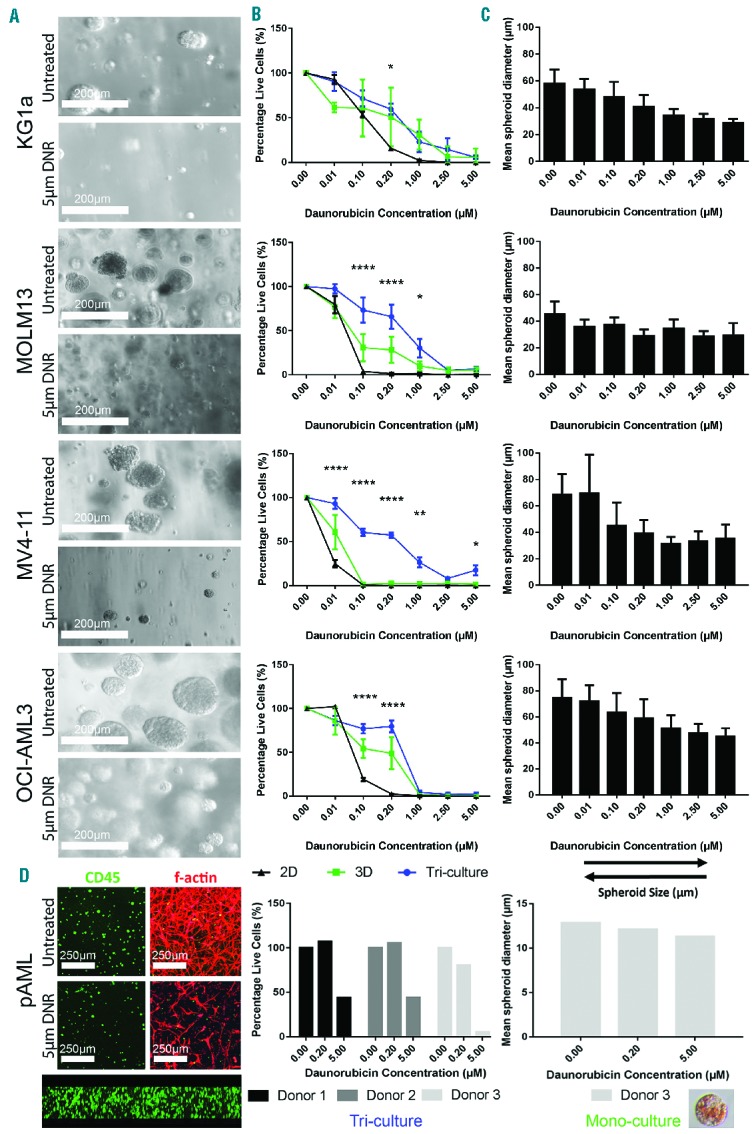
Treatment of three-dimensional mono-cultures and tri-cultures with daunorubicin. (A) Light microscope images of AML cell lines untreated and treated with 5 μM (daunorubicin) DNR at day 7 after treatment. (B) AML cells lines were treated with daunorubicin for 24 h as 2D or 3D mono-cultured, or 3D tri-cultures. Graphs display mean ± SEM. (C) Mean spheroid diameter of 3D mono-cultures after treatment with daunorubicin (± SD). (D) pAML cells from a patient with AML were cultured as 3D mono-cultures (left confocal images) or 3D tri-cultures (right confocal images). Confocal cross-section (bottom confocal image) shows homogeneous distribution of AML mono-culture throughout hydrogel. Mono-cultures (right graph) and tri-cultures (left graph) were treated with two concentrations of daunorubicin. Graphs show only the means. Cell line experiments were performed at least three times in triplicate (n=3–4). pAML experiments were performed once in triplicate (n=1). Three photographs per technical replicate were utilized for ImageJ spheroid measurements as a minimum. Insert in (D) shows daunorubicin uptake into a pAML spheroid (lower right). *Indicates statistical significance between 2D cultures and 3D tri-cultures: *P<0.05, **P<0.01, ***P<0.001, ****P<0.0001.
