

Multiple myeloma is an incurable plasma cell neoplasm for which novel agents have improved outcomes but therapeutic resistance is inevitable. Infusional cytotoxic chemotherapy is an effective cytoreductive strategy for aggressive relapse but is not curative.1 The autophagy pathway is a lysosome-dependent degradative pathway frequently activated in tumor cells treated with chemotherapy or radiation that mediates therapeutic resistance2 (Online Supplementary Figure S1) as it is a reversible adaptive response that allows cancer cells to survive therapy-induced apoptosis.3 Autophagy inhibition with hydroxychloroquine, which blocks the clearance of autophagic vesicles,4 can augment the cytotoxicity of proteasome inhibitors,5 DNA damaging chemotherapy including cyclophosphamide,6,7 and inhibitors of the mechanistic target of rapamycin (mTOR).8 A series of clinical trials combining the autophagy inhibitor hydroxychloroquine with autophagy-inducing chemotherapy5,9 has been generally safe, but levels of autophagy induction have been relatively modest. We sought to improve the efficacy of this approach in myeloma by using two agents that induce autophagy through different mechanisms. Since the phosphatidylinositide 3-kinase (PI3K)-AKT-mTOR signaling pathway both serves as a potential resistance mechanism to cytotoxic chemotherapy in myeloma10 and when inhibited, induces autophagy,11 we hypothesized that adding rapamycin to standard alkylating agent cyclophosphamide would ‘doubly’ induce autophagy, providing an improved platform for the addition of an autophagy inhibitor. We conducted a safety pilot and phase I study with the primary objective to determine the maximum tolerated dose (MTD) of hydroxychloroquine and safety of the 4-drug combination.
Adults with relapsed or refractory multiple myeloma were eligible for the study if they had received prior lenalidomide, bortezomib (Table 1). Full eligibility criteria are provided in the Online Supplementary Appendix. This was a 2-stage study: the 1st stage was an open label single center pilot study (July 2011–June 2012; Abramson Cancer Center, clinicaltrials.gov identifier: 01396200) to establish the safety of adding rapamycin and hydroxychloroquine individually to backbone chemotherapy (n=6). The 2nd stage was a single center (January 2013-September 2014; Knight Cancer Institute, clinicaltrials.gov identifier: 01689987) dose escalation phase I trial with 4 hydroxychloroquine dose levels: 400, 600, 800 and 1200 mg (n=18). The treatment schema displays the chemotherapy sequence which was designed to induce maximal mTOR inhibition (Figure 1A) (rapamycin half life = 60 hours) to chemo-sensitize cells to cyclophosphamide and dexamethasone and allow for measurement of autophagy and mTOR signaling after each component of therapy was added. Dose-limiting toxicity (DLT) was defined as grade 3 or 4 toxicity occurring during the first two cycles. MTD is defined as the highest dose at which 0 of 6 or 1 of 6 subjects experience a DLT. The secondary and tertiary efficacy end points are defined in the Online Supplementary Appendix.
Table 1.
Baseline demographics, disease characteristics, prior treatment regimens, exposure and refractoriness to treatment regimens in subjects from the pilot and phase I clinical trials.
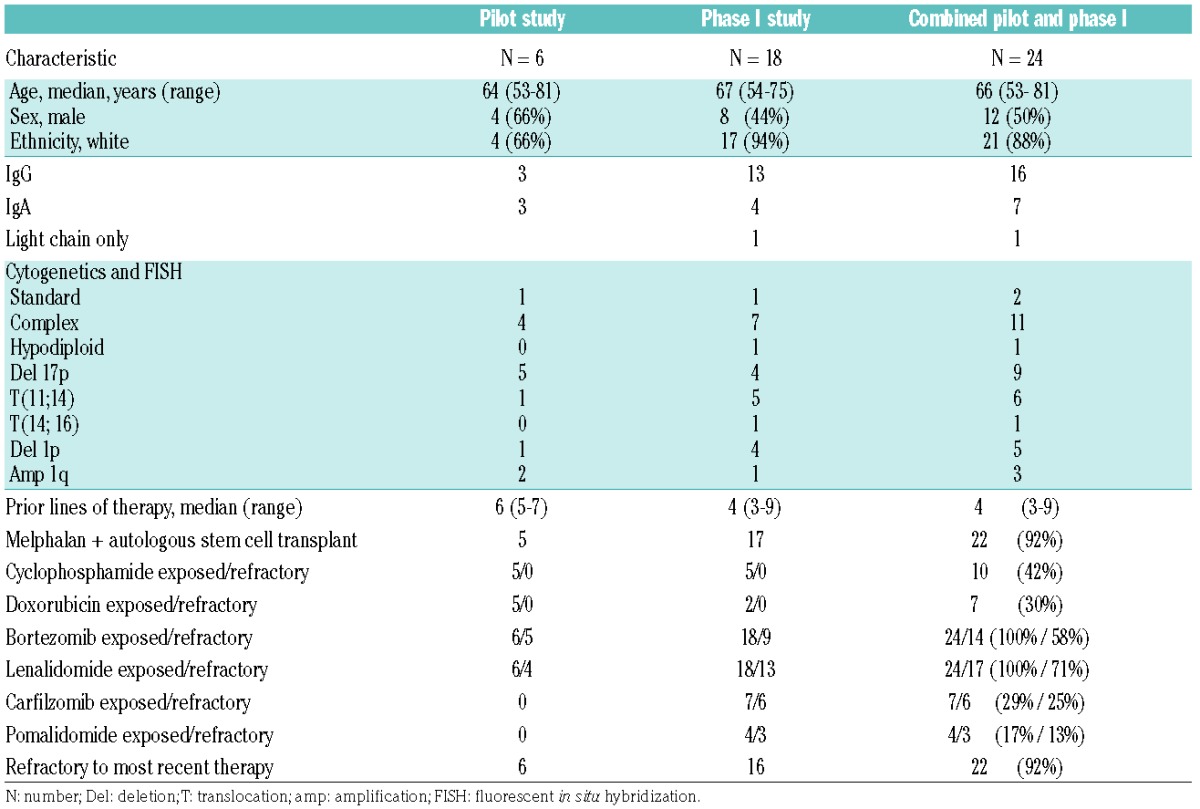
Figure 1.

Treatment schema. (A) Treatment schema depicting the first 2 cycles of therapy. Black arrows indicate time points when bone marrow sampling occurred on the phase I trial. Patients received cyclophosphamide 300 mg/m2 daily as a continuous intravenous infusion and dexamethasone 40 mg daily by mouth (po) for four days, rapamycin po from cycle 1 day –2 (12 mg loading dose followed by 4 mg daily for 5 more days) AND hydroxychloroquine (HCQ) po from cycle 1 day 5 onwards (phase I trial), OR hydroxychloroquine (pilot trial). Hydroxychloroquine started at cycle 1 day 5 after rapamycin, alkylator and steroid exposure in order to analyze autophagy at baseline, after chemotherapy and before adding the hydroxychloroquine effect. Maximal autophagy inhibition was anticipated to occur after several weeks of daily hydroxychloroquine due to its long half life (32–50 days). Steady state rapamycin trough levels of 4 to 12 ng/mL were targeted with a loading dose of 12 mg and a daily dose of 4 mg. Due to limited single agent activity of mTOR inhibitors in multiple myeloma and a concern for ongoing immunosuppression, rapamycin duration was limited to six days in total each cycle. Pegfilgrastim 6 mg was administered subcutaneously 24–48 hours after completing cyclophosphamide each cycle. All cycles beyond were identical to cycle 2, repeated every 28 days. (B–D) Therapy-associated autophagy modulation in myeloma cells from patients receiving cyclophosphamide, dexamethasone, rapamycin, and hydroxychloroquine. Representative electron micrographs (EMs) from CD 138-selected bone marrow plasma cells from subjects at baseline; after six days of rapamycin plus four days of cyclophosphamide and dexamethasone on cycle 1 day 5; and on cycle 2 day 5 hydroxychloroquine (HCQ) has been taken for 28 days. EM, direct magnification 4800×, green scale bar: 1 μm. Red arrows indicate autophagic vesicles (AV). (B) Cohort 4 (1200 mg HCQ) subject EM. (C) Cohort 3 (800 mg HCQ) subject EM. (D) Therapy-associated autophagy modulation in myeloma cells from all patients treated. Mean AVs in bone marrow plasma cells. The mean AV difference between baseline and cycle 1 day 5 is 0.260 [standard error (SE) 0.148, P=0.0939], between baseline and cycle 2 day 5 is −0.098 (SE 0.171, P=0.5738) and between cycle 1 day 5 and cycle 2 day 5 is −0.358 (SE 0.171, P=0.0488). (E) Mean and range of hydroxychloroquine trough levels across the 4 dose cohorts. The graph shows the median (center line), 25th-75th percentiles [interquartile range (IRQ), box], and 5th-95th percentiles (IRQ whiskers).
All subjects received infusional cyclophosphamide and dexamethasone; in the pilot study, 3 subjects received rapamycin (12 mg loading followed by 4 mg daily dose for 5 further days) and 3 subjects received hydroxychloroquine (800 mg daily). Results of the pilot study are available in the Online Supplementary Appendix. On the 4-drug phase I study the median (range) number of cycles given was 4.4.1–12 Two DLTs occurred at the highest dose level (1200 mg hydroxychloroquine): grade 3 diarrhea refractory to supportive measures, and grade 4 thrombocytopenia that did not recover despite holding all 4 chemotherapy agents. One DLT occurred in cohort 3 (800 mg hydroxychloroquine): grade 4 thrombocytopenia, thus cohort 3 was expanded to include a total of 7 subjects, with no further DLTs observed, and 800 mg was determined to be the MTD. Grade 3 and 4 adverse events (AEs) were collected and are presented in the Online Supplementary Table S1.
Of 18 patients in the phase I study, 4 patients received one cycle due to disease progression (n=1), toxicity (n=2), and patient preference (n=1). The best responses observed included one very good partial response (VGPR) and 3 partial responses (PR); overall response rate (ORR) 22%. Seven patients had minor responses (MR), with a clinical benefit rate of 61%. Five subjects (28%) had stable disease (SD) for at least one cycle, and 2 patients had immediate progression. At the MTD (800 mg) there was one VGPR, one PR among 7 patients, yielding an ORR of 28.5%. The median duration of response for those patients achieving MR or better was 4.5 months (range 1–10) and the median time to best response was 1.9 months (range 1–8) (Online Supplementary Figure S2). Median time to treatment failure was 4.5 months (range 20–341 days). Median progression-free survival (PFS) and overall survival (OS) were 8.6 (95%CI: days 124–285) and 11.3 months, respectively (95% CI: 232-not estimable) (Online Supplementary Figure S3).
Therapy-associated modulation of autophagic vesicles was apparent in bone marrow plasma cells by electron microscopy (Figure 1B–D and Online Supplementary Figure S4B and C). We expected the number of autophagic vesicles per cell to increase with the backbone regimen, and further increase with hydroxychloroquine (which inhibits the degradation of vesicular contents and clearance of autophagic vesicles). We observed that there was an increase in mean autophagic vesicles over time in certain subjects (Figure 1C and Online Supplementary Figure S4B and C), also observed on western blot showing an increased LC 3 II to I ratio (Online Supplementary Figure S4A). The electron micrograph (EM) in Figure 1C was from a subject in cohort 3 who achieved a durable VGPR. Overall, we were unable to demonstrate any correlation between depth of response, hydroxychloroquine dose and autophagic vesicle accumulation. Blood hydroxychloroquine trough concentrations (n=17) increased with dose (Figure 1E). At or above the MTD of 800 mg daily, whole blood concentrations were in the range known to inhibit autophagy. After six days of oral rapamycin treatment there was effective inhibition of mTORC1, with a notable decrease in phosphorylation of its substrate, the ribosomal protein S6 (p-S6) compared to baseline by immunofluorescence (Figure 2A–C). Mean (range) rapamycin trough levels were 8.8 ng/mL (3.7–17.9) after two days of oral rapamycin and 6.8 ng/mL (2.3–13.7) 24 hours after the 6th dose, which are within the therapeutic range for solid organ or bone marrow transplant patients (5–15 ng/mL). Next-generation sequencing was performed using the Knight Diagnostic Laboratory panel on baseline bone marrow samples in 11 subjects. Two subjects had mutations in the mTOR pathway: subject 1 in cohort 1 with SD lasting seven months had a mutation in STK1/LKB1 (p.E2A),12 which regulates mTOR signaling through AMP kinase, and subject 10 in cohort 3 with a PR lasting for three months had a known disease associated mutation, TSC2 (G661S), that results in loss of function of TSC2 and upregulation of mTOR signaling.13 Four subjects had mutations in RAS (2 KRAS in cohort 4 had MR and 2 NRAS in cohort 3 had a PR and MR, respectively). One subject in cohort 3 had a TP53 (R248Q) mutation with a VGPR. Four subjects in cohort 2 (responses SD and PR) and cohort 3 (MR and SD) had no identifiable mutations (Figure 2D).
Figure 2.
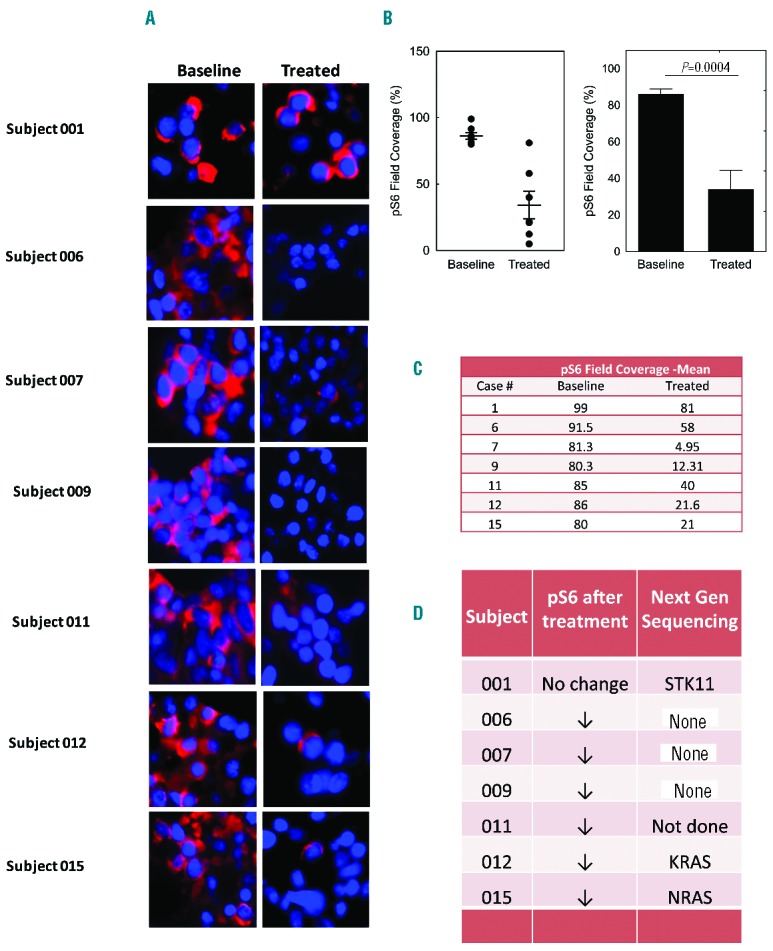
Therapy-associated mTOR pathway evaluation in myeloma cells from patients receiving cyclophosphamide, dexamethasone, rapamycin and hydroxychloroquine. (A) Immunofluorescence (IF) analysis of phospho-S6 ribosomal protein before and after treatment with rapamycin in 7 subjects. (B) An average of 3 images from 7 independent baseline and treated subjects’ bone marrow biopsies. Quantification of immunofluorescence was performed by InFORM image analysis software. Images were captured at 40× magnification. Data are means±standard error of mean (SEM). P value was calculated using two-sided Student’s t-test, P=0.0004. (C) Mean phospho-S6 ribosomal protein field coverage in paired samples and (D) concomitant mutations from the next-generation sequencing panel in 7 subjects.
Response rates and survival were similar to those of recently approved anti-myeloma agents but at least some of the therapeutic efficacy is attributable to the backbone cyclophosphamide and dexamethasone regimen. A single-institution retrospective review of the combination show a response rate of 17% and median PFS of 7.4 months,14 whereas our study showed an ORR of 28.5% at the MTD which may suggest some improvement compared to historical controls. Similarly, our results appear to be better than a previous trial of mTOR inhibition using temsirolimus monotherapy in patients with relapsed multiple myeloma, which reported an ORR of 6% and a clinical benefit rate of 38%15 while enrolling a population that was less heavily pre-treated (median of 2 prior lines of therapy) and had fewer patients with complex or high-risk cytogenetic abnormalities (13%). This combination appears more active than the 25 patient study (44% refractory to prior bortezomib) with an ORR of only 14%.5 Although no clear dose response was shown, all objective responses (>PR) occurred at the 2 highest dose levels (800 mg and 1200 mg hydroxychloroquine) except one PR at the 600 mg dose level. These response rates suggest the possibility of synergistic activity of this combination, though likely not to a degree that would provide meaningful improvement to patient outcomes.
We have demonstrated feasibility and tolerability of this approach and identified the MTD of hydroxychloroquine at 800 mg. We demonstrate modest intracellular accumulation of autophagic vesicles during combined stimulation of the autophagy pathway, inhibition of its final step with hydroxychloroquine, and inhibition of the mTOR pathway with rapamycin treatment. The study had some important limitations including small sample size and limited correlative studies. More profound inhibition of autophagy might achieve increased myeloma cell death, but toxicities of higher doses of hydroxychloroquine are limiting. An autophagy inhibitor with more favorable pharmacokinetic characteristics may be valuable, as the long terminal half life of hydroxychloroquine results in time-to-steady-state concentrations of several weeks, thereby limiting the ability to quickly titrate doses. It is also possible that more robust inhibition of mTOR signaling could be seen with a dual inhibitor of both mTORC1 and mTORC2, an approach that can avoid compensatory upregulation of mTORC2, but would nonetheless stimulate autophagy. Future trials of novel mTOR pathway inhibitors with hydroxychloroquine or novel autophagy inhibitors are warranted.
Supplementary Material
Footnotes
Funding: University of Pennsylvania Institutional Clinical and Translational Science Award Research Center grant (UL1 RR024134) (ECS), The Knight Cancer Institute RAC CCSG P30CA069533 (ECS), OCTRI (Oregon clinical translational research institute) resources (ECS), M. D. Anderson Cancer Center SPORE in Multiple Myeloma Developmental Research Program (DTV), The Abramson Cancer Center pilot grant #IRG-78-002-31 (DTV), NCI Cancer Clinical Investigator Team Leadership Award 5P30CA069533-17 (ECS).
Information on authorship, contributions, and financial & other disclosures was provided by the authors and is available with the online version of this article at www.haematologica.org.
References
- 1.Griffin PT, Ho VQ, Fulp W, et al. A comparison of salvage infusional chemotherapy regimens for recurrent/refractory multiple myeloma. Cancer. 2015;121(20):3622–3630. [DOI] [PubMed] [Google Scholar]
- 2.Rebecca VW, Amaravadi RK. Emerging strategies to effectively target autophagy in cancer. Oncogene. 2016;35(1):1–11. [DOI] [PMC free article] [PubMed] [Google Scholar]
- 3.White E. Deconvoluting the context-dependent role for autophagy in cancer. Nat Rev Cancer. 2012;12(6):401–410. [DOI] [PMC free article] [PubMed] [Google Scholar]
- 4.Amaravadi RK, Lippincott-Schwartz J, Yin XM, et al. Principles and current strategies for targeting autophagy for cancer treatment. Clin Cancer Res. 2011;17(4):654–666. [DOI] [PMC free article] [PubMed] [Google Scholar]
- 5.Vogl DT, Stadtmauer EA, Tan KS, et al. Combined autophagy and proteasome inhibition: a phase 1 trial of hydroxychloroquine and bortezomib in patients with relapsed/refractory myeloma. Autophagy. 2014;10(8):1380–1390. [DOI] [PMC free article] [PubMed] [Google Scholar]
- 6.Amaravadi RK, Yu D, Lum JJ, et al. Autophagy inhibition enhances therapy-induced apoptosis in a Myc-induced model of lymphoma. J Clin Invest. 2007;117(2):326–336. [DOI] [PMC free article] [PubMed] [Google Scholar]
- 7.Pan Y, Gao Y, Chen L, et al. Targeting autophagy augments in vitro and in vivo antimyeloma activity of DNA-damaging chemotherapy. Clin Cancer Res. 2011;17(10):3248–3258. [DOI] [PubMed] [Google Scholar]
- 8.Hoang B, Benavides A, Shi Y, et al. Effect of autophagy on multiple myeloma cell viability. Mol Cancer Ther. 2009;8(7):1974–1984. [DOI] [PubMed] [Google Scholar]
- 9.Rangwala R, Chang YC, Hu J, et al. Combined MTOR and autophagy inhibition: phase I trial of hydroxychloroquine and temsirolimus in patients with advanced solid tumors and melanoma. Autophagy. 2014;10(8):1391–1402. [DOI] [PMC free article] [PubMed] [Google Scholar]
- 10.Younes H, Leleu X, Hatjiharissi E, et al. Targeting the phosphatidylinositol 3-kinase pathway in multiple myeloma. Clin Cancer Res. 2007;13(13):3771–3775. [DOI] [PubMed] [Google Scholar]
- 11.Jung CH, Jun CB, Ro SH, et al. ULK-Atg13-FIP200 complexes mediate mTOR signaling to the autophagy machinery. Mol Biol Cell. 2009;20(7):1992–2003. [DOI] [PMC free article] [PubMed] [Google Scholar]
- 12.Shaw RJ, Kosmatka M, Bardeesy N, et al. The tumor suppressor LKB1 kinase directly activates AMP-activated kinase and regulates apoptosis in response to energy stress. Proc Natl Acad Sci USA. 2004; 101(10):3329–3335. [DOI] [PMC free article] [PubMed] [Google Scholar]
- 13.Lu J, Zavorotinskaya T, Dai Y, et al. Pim2 is required for maintaining multiple myeloma cell growth through modulating TSC2 phosphorylation. Blood. 2013;122(9):1610–1620. [DOI] [PMC free article] [PubMed] [Google Scholar]
- 14.Malhotra BV, Vogl D, Stadtmauer E, et al. Continuous Infusion Cyclophosphamide as Salvage Therapy for Relapsed or Refractory Multiple Myeloma. Blood. 2009;114(22):4942. [Google Scholar]
- 15.Farag SS, Zhang S, Jansak BS, et al. Phase II trial of temsirolimus in patients with relapsed or refractory multiple myeloma. Leuk Res. 2009;33(11):1475–1480. [DOI] [PMC free article] [PubMed] [Google Scholar]
Associated Data
This section collects any data citations, data availability statements, or supplementary materials included in this article.