Abstract
Purpose
To evaluate corneal cell morphology in patients with keratoconus using an in vivo slit scanning confocal microscope.
Methods
A cross-sectional study was conducted to evaluate the corneal cell morphology of 47 keratoconus patients and 32 healthy eyes without any ocular disease. New keratoconus patients with different disease severities and without any other ocular co-morbidity were recruited from the ophthalmology department of a public hospital in Malaysia from June 2013 to May 2014. Corneal cell morphology was evaluated using an in vivo slit-scanning confocal microscope. Qualitative and quantitative data were analysed using a grading scale and the Nidek Advanced Visual Information System software, respectively.
Results
The corneal cell morphology of patients with keratoconus was significantly different from that of healthy eyes except in endothelial cell density (P = 0.072). In the keratoconus group, increased level of stromal haze, alterations such as the elongation of keratocyte nuclei and clustering of cells at the anterior stroma, and dark bands in the posterior stroma were observed with increased severity of the disease. The mean anterior and posterior stromal keratocyte densities and cell areas among the different stages of keratoconus were significantly different (P < 0.001 and P = 0.044, respectively). However, the changes observed in the endothelium were not significantly different (P > 0.05) among the three stages of keratoconus.
Conclusion
Confocal microscopy observation showed significant changes in corneal cell morphology in keratoconic cornea from normal healthy cornea. Analysis also showed significant changes in different severities of keratoconus. Understanding the corneal cell morphology changes in keratoconus may help in the long-term monitoring and management of keratoconus.
Keywords: keratoconus, corneal cell morphology, in vivo confocal microscopy
Introduction
Keratoconus is a progressive, non-inflammatory ectatic condition of the cornea (1, 2). It causes considerable alterations of the corneal cellular structure. In vivo slit scanning corneal confocal microscopy provides real-time microscopic images of corneal layers with high resolution and magnification. It helps to understand minute cellular alterations that occur in the disease process of living human cornea (7). Previous studies using a confocal microscope revealed that cellular alterations in keratoconus include decreased basal cell, keratocyte and endothelium cell densities and increased polymegathism and pleomorphism (2–6) compared with control subjects. However, the literature on morphological changes at the cellular level in different stages of keratoconus is limited. Erie et al. suggested that keratocyte loss in keratoconus could be associated with disease severity (3). Ucakhan et al. reported that morphological alterations, such as folds in the anterior stroma, elongation of keratocyte nuclei, increased polymegathism and pleomorphism and decreased keratocyte density in stroma, were more evident in the severe stages of keratoconus than in the early stage (4). By contrast, Weed et al. found that the anterior and posterior stromal keratocyte densities increased in moderate and advance keratoconus compared with the controls (5). Bitirgen et al. observed a significant difference in the anterior and posterior stromal keratocyte and endothelial cell densities between mild and moderate keratoconus (22). However, the variation in the qualitative and quantitative observation of corneal cell morphology in different disease severities of keratoconus has yet to be clearly established.
Thus, this study aimed to compare the corneal cell morphology between patients with keratoconus and those with healthy eyes without any ocular disease and to further analyse the corneal cell morphology in different severities of keratoconus.
Methods
Subjects
New keratoconus patients without any interventions seen in the ophthalmology department of a public hospital in Malaysia were considered the study population. Sample size was estimated at 23 patients with keratoconus using the formula of comparing two group means (independent groups) for continuous variables, and the parameters were set as follows: α = 0.05, power of the study = 90%, margin of error =10%, and standard deviation of a morphological parameter tested (mean anterior stromal keratocyte cell density in keratoconus 909 (91) cells/mm2; Hollingsworth et al.) = 91 (9, 32). However, the present study was a part of an interventional study in which the corneal morphology of keratoconus using different types of contact lenses was evaluated. Thus, the study reported the corneal morphology of 47 keratoconus patients instead of 23 patients along with the corneal morphology of 32 healthy eyes of normal subjects, who were recruited between June 2013 and May 2014, to conduct this cross-sectional observational study. A comprehensive eye examination was conducted before recruiting keratoconus patients and healthy subjects. Clinical signs, such as scissors reflex with retinoscopy, central or paracentral thinning, Fleischer ring, Vogt’s striae, Munson’s sign in slit lamp biomicroscopy and central or paracentral steepening of the cornea in topography (Pentacam, Oculus, Optikgerate GmBH, Wetzlar, Germany), were followed up to diagnose keratoconus. Patients with any ocular diseases apart from keratoconus, with history of wearing contact lenses or surgical interventions in the cornea, using any kind of ocular medication and with systemic diseases that affect ocular health (e.g., diabetes mellitus, hypertension, arthritis and thyroid disease) were excluded from the study. Patients with keratoconus were divided into three subgroups: stage 1, stage 2 and stage 3 keratoconus according to the Amsler–Krumeich classification. The classification is based on myopia with induced astigmatism, mean central keratometry reading, corneal thickness in the thinnest location and presence or absence of a corneal scar (8). Informed consent was obtained from all the keratoconus patients and healthy subjects. Approval was obtained from the University Ethics Committee and Medical Research and Ethics Committee in accordance with the tenets of the Declaration of Helsinki.
Confocal microscopy
In vivo slit-scanning confocal microscopy was performed using ConfoScan4 (Nidek Technologies Srl, Albignasego, Italy) by following the standard operative procedure. A corneal full thickness scan was applied to capture the images of corneal layers in the keratoconus and control subjects. Throughout the examination, 350 images were captured. Three sharp and clear images of each corneal layer were selected for qualitative and quantitative analyses. Qualitative analysis of the stromal haze was conducted following the grading scale designed by Hollingsworth et al. (9). Quantitative analysis of cell densities and areas was performed using the Nidek Advanced Visual Information System application software in a fixed frame of 600 μm × 600 μm. A semi-automated method was used to analyse the stromal keratocyte. The keratocyte nuclei were marked manually using the ‘L’ method to calculate the cell area and density (6, 10). The fully automated method was used to analyse the endothelium.
Examiners
One observer was involved in this study for the selection and analysis of all the images, but the observer was not informed about the severity of the keratoconus patients. Inter-observer and intra-observer reliability tests were performed. Two observers participated in this inter-observer study. The interclass correlation coefficient (Inter-CC) and reliability coefficient (RC) showed high agreement in the results from the two examiners (Inter-CC and RC for ASKD, PSKD and END: 0.865 and 0.861, 0.836 and 0.827 and 0.940 and 0.940, respectively). The intraclass correlation coefficient (Intra-CC) and RC showed high agreement in the two results (Intra-CC and RC for ASKD, PSKD and END: 0.874 and 0.871, 0.822 and 0.827 and 0.957 and 0.955, respectively). The analysis results showed that all the measurements techniques (semi-automated for the stroma and automated for the endothelium analysis) were highly reproducible by the same or different examiners.
Statistical Analysis
All data were analysed using the SPSS software (IMB SPSS 17; SPSS Inc., USA). The Shapiro–Wilk test was used to assess the normality of the data distribution. Descriptive statistics and percentage (%) were used to analyse the qualitative data. The independent sample t-test was used to compare the difference in means between healthy eyes and keratoconus. The one-way ANOVA test (post-hoc test) was used to compare the mean cell area and density among three different severities and three different ethnic groups of keratoconus. All the tests were two tailed, and a P-value < 0.05 was considered statistically significant.
Results
Fifty-eight patients with keratoconus were randomly selected from the hospital. Among them, three were not willing to participate, and eight did not match the inclusion and exclusion criteria of the study. Thus, 47 eyes of the 47 clinically diagnosed patients with keratoconus (18 males and 29 females) and 32 non-keratoconic eyes (11 males and 21 females) as the control were evaluated for the study. The mean (standard deviation) ages of the patients with keratoconus and healthy subjects were 28.42 (SD 6.42) and 28.28 (SD 7.57) years, respectively. The mean age and sex were not significantly different (P = 0.928 and P = 0.592, respectively) between the keratoconus and healthy subjects. In the keratoconus subgroups, the number of stage 1, stage 2 and stage 3 patients with keratoconus was 9 (19.1%), 21 (44.6%) and 17 (36.1%), respectively. In the keratoconus group, the number of Malay, Indian and Chinese was 24 (51.0%), 18 (38.3%) and 5 (10.6%), respectively.
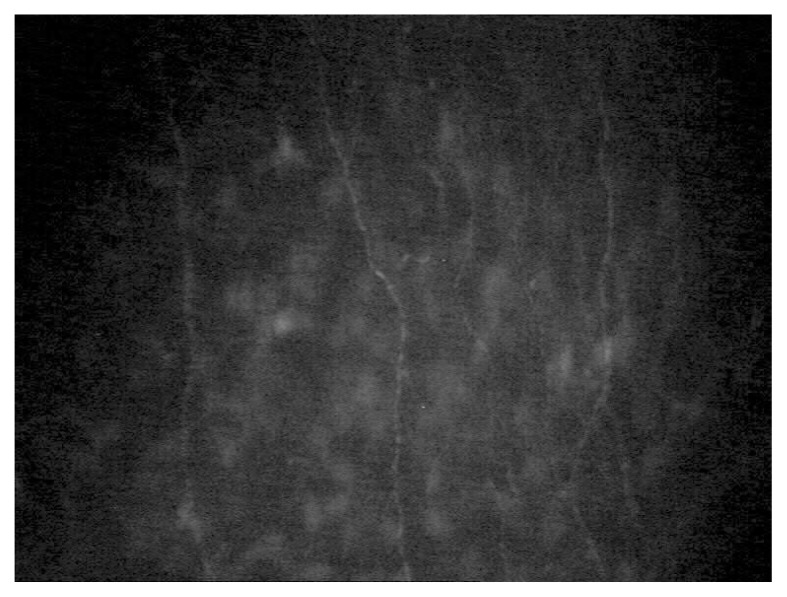
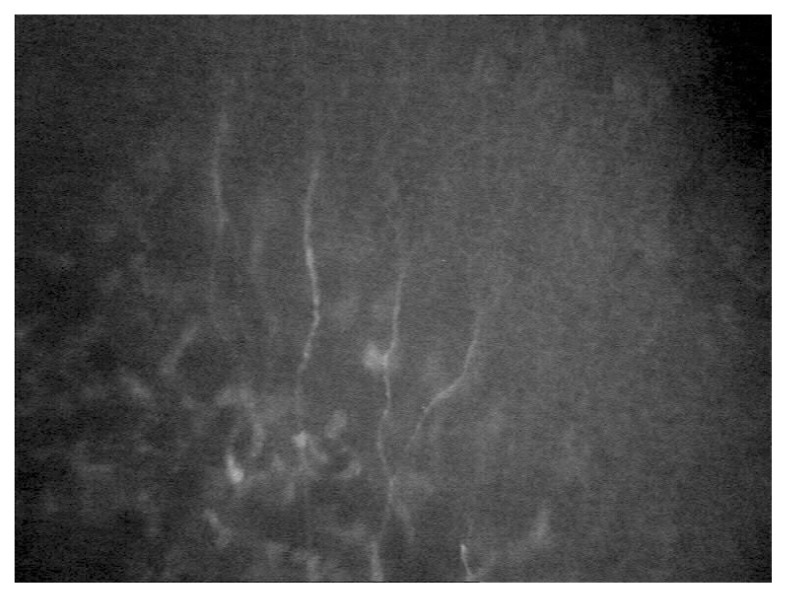
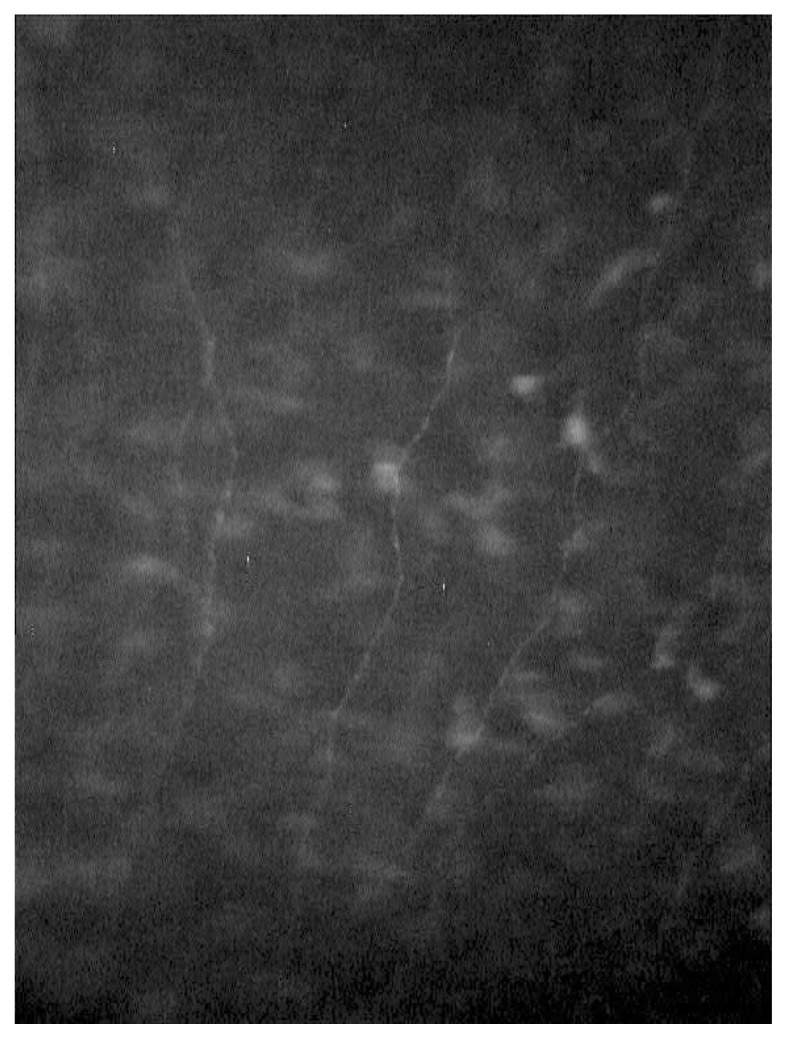
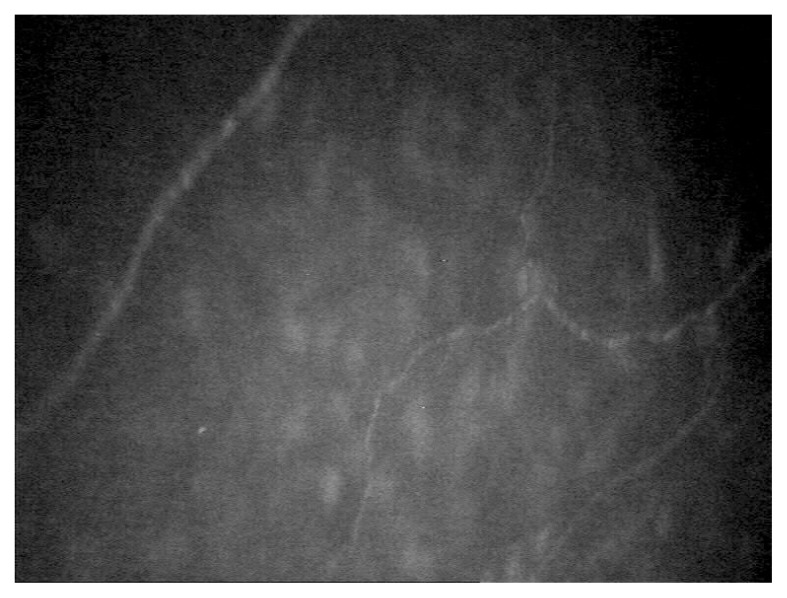
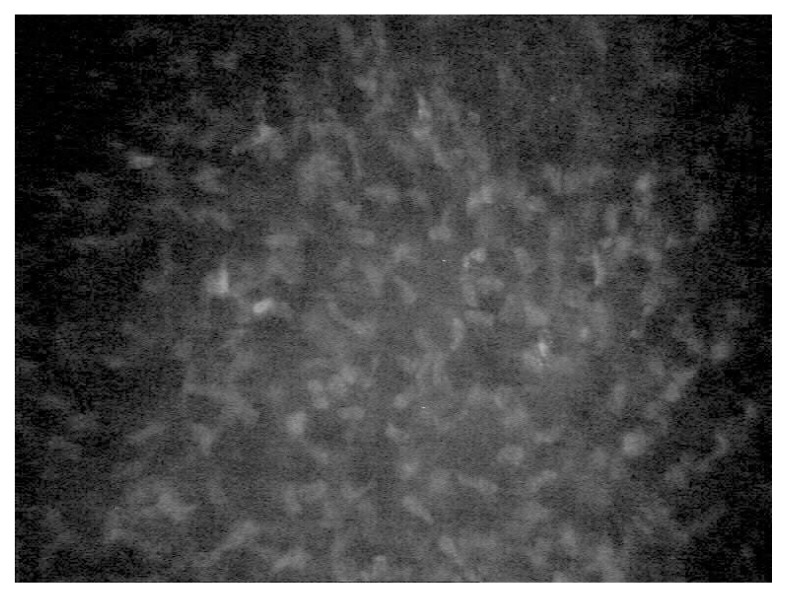
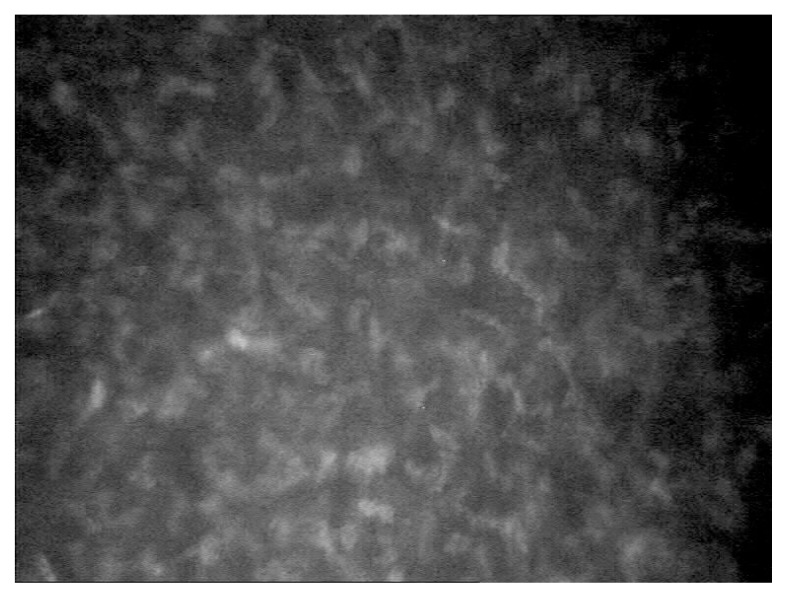
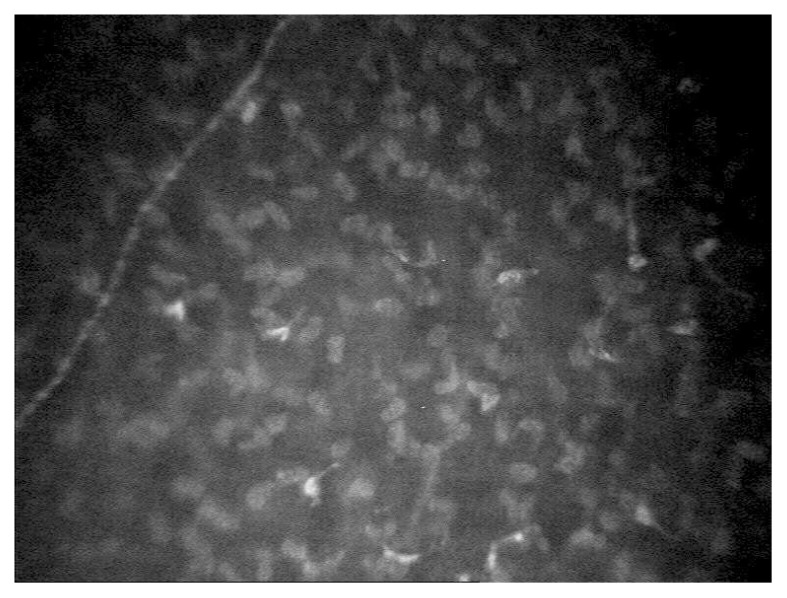
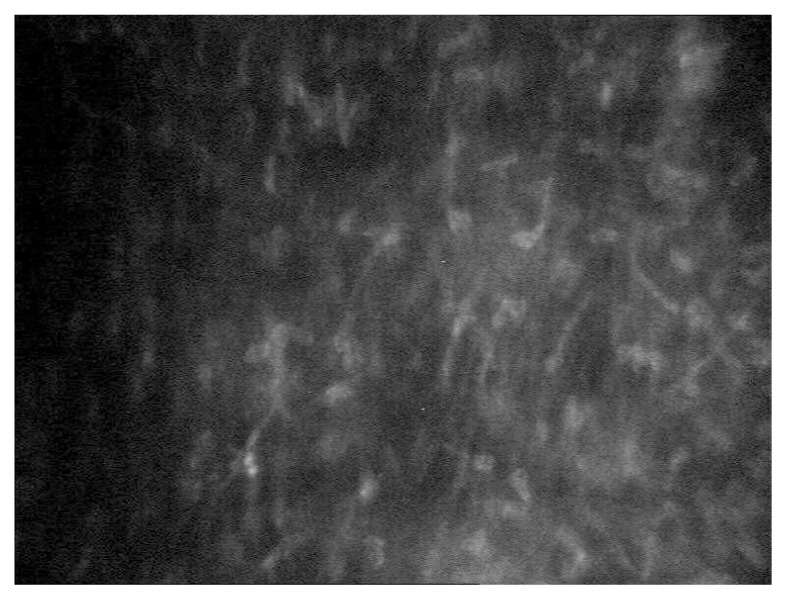
Qualitative observations of the corneal cell morphology in the keratoconus group were noticeably different from those of the healthy eyes. Epithelial cells were not clearly visible in all keratoconic eyes. Analysis was not conducted because of poor image quality. Bowman’s layer was observed as amorphous layers in the keratoconic eyes, similar to the healthy eyes (Figure 1). However, Bowman’s layer was not clearly visible in three (6.3%) eyes with stage 3 keratoconus, in which the sub-basal nerve fibres were visible along with the stromal keratocyte in Bowman’s plane (Figure 2). The sub-basal nerve fibres in the keratoconic eyes were more tortuous (Figure 3) than the straight vertical orientation of nerves seen in the healthy eyes (Figure 4).
Figure 1.
Bowman’s layer of a control eye imaged with confocal microscope
Figure 2.
Bowman’s layer of a stage 3 keratoconic eye imaged with confocal microscope
Figure 3.
Sub-basal nerve fibers visible in a control eye imaged with confocal microscope
Figure 4.
Sub-basal nerve fibers visible in a keratoconic eye imaged with confocal microscope
The stromal layer was clearly visible in all healthy eyes with no haze (Figure 5), but a different degree of stromal haze was observed in the keratoconic eyes (Figure 6). Anterior stromal keratocyte cells were visible in all keratoconic eyes with grades 0, 1, 2 and 3 stromal haze in 7 (14.9%), 18 (38.2%), 20 (42.5%) and 2 (4.2%) eyes, respectively.
Figure 5.
Anterior stroma visible in a control eye imaged with confocal microscope
Figure 6.
Anterior stroma visible in a keratoconic eye with grade 2 haze imaged with confocal microscope
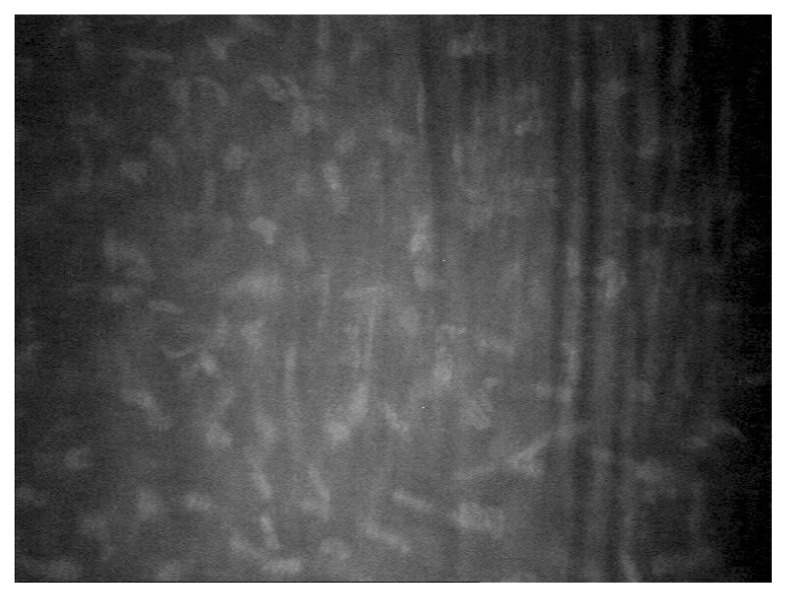
Regularly arranged round or cigar-shaped keratocyte nuclei were observed in the healthy eyes (Figure 7). Irregularities in the shape and size of keratocyte nuclei were observed in stage 3 keratoconic eyes (Figure 8). Thin and elongated keratocyte nuclei were observed in three (6.3%) eyes with stage 3 keratoconus. A thick, long and bright artefact was observed in the anterior stroma of two (4.2%) eyes with stage 3 keratoconus that looked like an accumulation of cells. In the anterior stroma, small dark bands were observed in two (4.2%) eyes with stage 3 keratoconus. In the posterior stroma, keratocyte cells were visible in all the keratoconic eyes with grade 0 haze in 24 (51.0%) eyes, grade 1 haze in 20 (42.5%) eyes and grade 2 haze in 3 (6.3%) eyes. In the posterior stroma, thick dark bands were observed in three (6.3%) eyes with stage 2 and 3 (6.3%) eyes with stage 3 keratoconus (Figure 9). The comparison of stromal haze, polymegathism, and pleomorphism of the corneal endothelium among stage 1, stage 2 and stage 3 keratoconus is presented in Table 1.
Figure 7.
Keratocyte nuclei visible in anterior stroma of a control eye imaged with confocal microscope
Figure 8.
Elongated keratocyte nuclei visible in anterior stroma of a stage 3 keratoconic eye with imaged with confocal microscope
Figure 9.
Thick dark bands visible in posterior stroma of a stage 2 keratoconic eye with imaged with confocal microscope
Table 1.
Comparison of stromal haze, polymegathism and pleomorphism of corneal layers in between stage 1, stage 2 and stage 3 keratoconus (KC) subgroups
| Parameters | Stage 1 KCa (n=9) | Stage 2 KCa (n=21) | Stage 3 KCa (n=17) |
|---|---|---|---|
| Anterior stromal * haze (eyes) | Grade 0: 3 (33.33%) Grade 1: 4 (44.45%) Grade 2: 2 (22.22%) |
Grade 0: 4 (19.05%) Grade 1: 11(52.38%) Grade 2: 6 (28.57%) |
Grade 0: 3 (17.65%) Grade 1: 12 (70.59%) Grade 2: 2 (11.76%) |
| Posterior stromal * haze (eyes) | Grade 0: 5 (55.56%) Grade 1: 4 (44.44%) |
Grade 0: 13 (61.90%) Grade 1: 8 (38.10%) |
Grade 0: 6 (35.29%) Grade 1: 8 (47.06%) Grade 2: 3 (17.65%) |
| Polymegathism (Average) | 40.87% | 40.70% | 43.14% |
| Pleomorphism (Average) | 33.20% | 36.14% | 37.30% |
KC: Keratoconus.
n: Number of patients with keratoconus.
Stromal haze is graded based on the grading scale designed by Hollingsworth et al. Ophthalmic Physiol Opt. 2005; 25:254–260.
The quantitative analysis of the corneal cell morphology showed a significant difference between the keratoconus and healthy eyes shown in Table 2. The mean sub-basal nerve fibre density and sub-basal nerve fibre length were significantly less (P < 0.001) in keratoconus group compared with healthy eyes. The mean anterior stromal keratocyte density (ASKD) and mean anterior stromal keratocyte area (ASKA) in the keratoconus group were significantly different (P < 0.001) from those in healthy eyes. The mean ASKD in stage 1, stage 2 and stage 3 keratoconus subgroups showed a significant reduction in cell density (P < 0.001) with increased severity (Table 3). Significant differences in the mean ASKD and ASKA were observed between stage 1 and stage 3 (P < 0.001) and between stage 2 and stage 3 keratoconus subgroups (P = 0.002). However, the mean ASKD and ASKA were not significantly different (P = 0.161 and P = 0.183) between stage 1 and stage 2 keratoconus subgroups.
Table 2.
Comparison of cell density and cell area of corneal layers between keratoconus and healthy eyes
| Parameters | Keratoconusa (n=47) | Healthy eyesa (n=32) | Mean difference (95% CI) | t-statistic (df) | P-value* |
|---|---|---|---|---|---|
|
|
|
||||
| Mean (SD) | Mean (SD) | ||||
| ASKD (cells/mm2) | 885.08 (47.34) | 1095.71 (101.85) | 210.63 (176.64, 244.53) | 12.37 (77) | 0. |
| ASKA (μm2) | 1132.96 (59.89) | 925.79 (84.89) | −207.16 (−239.57, −174.75) | −12.72 (77) | 0. |
| PSKD (cells/mm2) | 705.78 (47.65) | 808.15 (88.85) | 102.37 (71.64, 133.11) | 6.63 (77) | 0. |
| PSKA (μm2) | 1423.55 (98.99) | 1250.90 (138.34) | −172.65 (−225.79, −119.50) | −6.46 (77) | 0. |
| ECD (cells/mm2) | 2860.04 (215.28) | 2946.71 (194.52) | 86.67 (−7.87, 181.22) | 1.82 (77) | 072 |
| ECA (μm2) | 348.51 (22.75) | 332.30 (42.19) | −16.20 (−30.83, −1.59) | −2.20 (77) | 030 |
|
| |||||
| (n=13) | (n=21) | ||||
|
| |||||
| SBNFD (cells/mm2) | 13.3 (7.3) | 19.1 (5. 2) | 5.8 (11.23, 21.32) | 1.31 (32) | 0. |
| SBNFL (mm/mm2) | 11.2 (4.1) | 18.5 (3.5) | 7.3 (9.37, 16.21) | 1.27 (32) | 0. |
Mean(standard deviation).
Independent t-test.
n: Number of patients with keratoconus. t: t-statistics. df: Degree of freedom. CI: Confidence intervals, ASKD: Anterior stromal keratocyte density. ASKA: Anterior stromal keratocyte area. PSKD: Posterior stromal keratocyte density. PSKA: Posterior stromal keratocyte area. ECD: Endothelial cell density. ECA: Endothelial cell area. SBNFD: Sub-nasal nerve fibers density. SBNFL: Sub-basal nerve fibers length.
Table 3.
Comparison of cell density and cell area of corneal layers in between stage 1, stage 2 and stage 3 keratoconus (KC) subgroups
| Parameters | Stage 1 KCa (n=9) | Stage 2 KCa (n=21) | Stage 3 KCa (n=17) | F* (df:2,44) | P-value* |
|---|---|---|---|---|---|
|
|
|
|
|||
| Mean(SD) | Mean(SD) | Mean(SD) | |||
| ASKD (cells/mm2) | 924.78 (42.60) | 895.92 (42.23) | 850.66 (31.75) | 12.206 | 0. |
| ASKA (μm2) | 1083.43 (51.61) | 1118.47 (51.89) | 1177.07 (43.50) | 12.426 | 0. |
| PSKD (cells/mm2) | 739.44 (44.90) | 702.91 (26.51) | 691.50 (61.45) | 3.360 | 044 |
| PSKA (μm2) | 1357.01 (86.60) | 1424.58 (54.08) | 1457.51 (130.57) | 3.344 | 044 |
| ECD (cells/mm2) | 2905.44 (201.09) | 2858.85 (218.02) | 2837.47 (227.82) | 0.298 | 754 |
| ECA (μm2) | 345.66 (23.88) | 349.30 (24.41) | 349.04 (21.26) | 0.640 | 919 |
KC: Keratoconus.
Mean (SD): Mean(standard deviation).
Analysis of variance (ANOVA).
F: F-ratio. df: Degree of freedom. n: Number of patients with keratoconus. ASKD: Anterior stromal keratocyte density. ASKA: Anterior stromal keratocyte area. PSKD: Posterior stromal keratocyte density. PSKA: Posterior stromal keratocyte area. ECD: Endothelial cell density. ECA: Endothelial cell area.
The mean posterior stromal keratocyte density (PSKD) and mean posterior stromal keratocyte area (PSKA) in the keratoconus group were significantly different (P < 0.001) from those in healthy eyes. Furthermore, the mean PSKD in stage 1, stage 2 and stage 3 keratoconus subgroups significantly decreased (P = 0.044) with increased disease severity. Among the subgroups, a significant difference was observed between stage 1 and stage 3 keratoconus (P = 0.036). The mean PSKA was significantly different between stage 1 and stage 3 keratoconus (P = 0.034) subgroups.
The average polymegathism and pleomorphism were higher in keratoconic eyes (41.62% and 36.00%, respectively) than in healthy eyes (26.03% and 24.41%, respectively). However, the mean endothelial cell density (ECD) of keratoconic eyes was not significantly different (P = 0.072) from that of healthy eyes. The mean endothelial cell area (ECA) of keratoconic eyes was significantly different (P = 0.030) from that of healthy eyes. The mean ECD of stage 1, stage 2 and stage 3 keratoconus subgroups progressively decreased with the increased severity of the disease. However, the mean ECD and ECA were not significantly different (P = 0.754 and 0.919, respectively) among the three keratoconus subgroups. The detailed quantitative analysis among the three stages of keratoconus is presented in Table 3.
Accordingly, an analysis was conducted to evaluate the differences in the corneal cell morphology among the three ethnic subgroups (Malay, Indian and Chinese) in patients with keratoconus (Table 4). The qualitative analysis did not show any noticeable difference among the three ethnic subgroups in patients with keratoconus. The quantitative analysis also did not revealed any significance (P > 0.05) difference in cell density and area among the three ethnic subgroups in patients with keratoconus.
Table 4.
Comparison of cell density and cell area of corneal layers in between three ethnic subgroups in keratoconus
| Parameters | Malaya (n=24) | Indiana (n=18) | Chinese a (n=5) | F (df:2,44) | P-value* |
|---|---|---|---|---|---|
|
|
|
|
|||
| Mean(SD) | Mean(SD) | Mean(SD) | |||
| ASKD (cells/mm2) | 893.05 (45.32) | 881.24 (52.81) | 860.66 (30.29) | 1.067 | 0.353 |
| ASKA (μm2) | 1122.46 (55.77) | 1138.61 (68.13) | 1163.02 (41.26) | 1.082 | 0.348 |
| PSKD (cells/mm2) | 705.41 (50.02) | 704.95 (42.59) | 705.78 (47.65) | 0.027 | 0.973 |
| PSKA (μm2) | 1424.54 (102.16) | 1424.15 (91.29) | 1416.66 (131.11) | 0.013 | 0.987 |
| ECD (cells/mm2) | 2867.41 (153.42) | 2822.88(264.70) | 2760.90 (177.74) | 0.654 | 0.525 |
| ECA (μm2) | 349.40 (18.82) | 349.46 (24.49) | 363.58 (23.97) | 0.953 | 0.394 |
KC: Keratoconus.
Mean (SD): Mean(standard deviation).
Analysis of variance (ANOVA).
F: F-ratio. df: Degree of freedom. n: Number of patients with keratoconus. ASKD: Anterior stromal keratocyte density. ASKA: Anterior stromal keratocyte area. PSKD: Posterior stromal keratocyte density. PSKA: Posterior stromal keratocyte area. ECD: Endothelial cell density. ECA: Endothelial cell area.
Discussion
The pathological process of keratoconus involves all layers of the cornea. Thus, the cellular morphology of each corneal layer alters in eyes with keratoconus (3–6). However, these cellular alterations may vary based on the severity of the disease (22, 31). The present study was conducted to observe the corneal morphological changes in patients with keratoconus. Furthermore, the cellular morphology in the different stages of keratoconus was compared.
In the present study, Bowman’s layer was visible as an amorphous layer in patients with keratoconus and healthy subjects. However, it was not distinguishable in a few stage 3 keratoconic eyes, in which sub-basal nerve fibres and keratocyte nuclei were visible in Bowman’s plane. Mutalib et al. described the same abnormality in a single case with stage 3 keratoconus, and Efron et al. called this abnormality the ‘split field’ view of Bowman’s layer (7, 31). A tear in Bowman’s layer in severe keratoconus may be the reason for this abnormality (11, 12).
In the present study, sub-basal nerve fibres were more tortuous than the vertical orientation of the nerves seen in healthy eyes. Bitirgen et al. reported a change in the usual pattern of sub-basal nerves in keratoconic eyes. However, there is no clear explanation for this abnormality (22).
The study demonstrated an increased stromal haze with the progression of the disease in patients with keratoconus. In the anterior and posterior stroma, the level of haze was noticeably higher in stage 3 than in the stage 1 and stage 2 keratoconus subgroups. Uçakhan et al. and Efron et al. also reported different amounts of haze and reflectivity in stroma in patients with keratoconus (4, 7). Collagen fibrils play a major role in maintaining the transparency of the cornea with their regular and organised arrangement. Mackiewicz et al. and Sawaguchi et al. reported that increased proteolytic enzymes or decreased levels of proteinase inhibitors leads to the loss of collagen fibrils in keratoconus (14, 15). Runager et al. and Chaerkady et al. found that decreased a level of proteoglycans macro-molecules and a decreased concentration of transforming growth factor beta are linked to the disorganisation of collagen fibrils in keratoconus (16, 17). Therefore, the activities of the enzymes may be altered with the progression of the disease, and they may cause alteration in the number and arrangement of collagen fibrils. This reason may explain the loss of transparency of stromal layers (2, 5, 9).
In the present study, irregularities in the size and shape of the anterior stromal keratocyte nuclei were observed. Furthermore, relatively thin and elongated keratocyte nuclei were observed in the anterior stroma of stage 3 keratoconic eyes. Ucakhan et al. and Mutalib et al. reported the presence of elongated keratocyte nuclei in the anterior stroma in keratoconus (4, 31). However, Somodi et al. found elongated keratocyte nuclei in the posterior stroma (13). The reason for the changes in shape of keratocyte nuclei is not yet completely understood. Nevertheless, Muller et al. reported that the shape of keratocyte nuclei is location dependent (18), whereas Maurice et al. found that the shape of keratocyte could depend on the allocation of proteoglycan in the stroma (19).
The accumulation of cells appearing as a bright artefact was observed in the anterior stroma in two stage 3 keratoconic eyes. Mutalib et al. reported a similar finding in a single stage 3 keratoconic eye (31). Studies reported that in severe keratoconus, the broken areas of a fragmented Bowman’s layer are filled with either epithelium or keratocyte cells (11, 12). Thus, this cluster of cells can be hypothesised to transfer the keratocyte approaching the breaks of Bowman’s layer of stage 3 keratoconus. However, further investigation of this observation is essential.
In the present study, the dark bands were observed in the anterior stroma of stage 3 keratoconic eyes. This finding was supported by Ucakhan et al., who reported the presence of Vogt’s striae in the anterior stroma of keratoconic eyes with moderate and severe keratoconus (4). In the present study, the posterior stroma also demonstrated prominent and continuous dark bands in stage 2 and stage 3 keratoconic eyes. Weed et al., Somodi et al. and Hollingsworth et al. reported a similar finding in the posterior stroma of patients with keratoconus (5, 13, 20). Hayes et al. found that only a minor alteration occurs in the collagen lamellar orientation in mild keratoconus. However, the alteration of collagen fibrils in stromal lamellae is related to the progression of the disease (21). Therefore, the dark bands (Vogt’s striae) are commonly seen in relatively severe keratoconic eyes. The abnormal separation of collagen fibrils in stromal lamellae could be the contributing factor in Vogt’s striae (5, 20). However, Ucakhan et al. stated that the pulling of the endothelium and Descemet’s membrane towards the cone apex could be the reason (4).
In the present study, the mean anterior and posterior stromal keratocyte densities and cell areas in the keratoconus group were significantly different from those in healthy eyes. Previous researches also reported similar findings (3–6). A significant difference was also observed among the three keratoconus subgroups. In the anterior stroma, keratocyte density was 3.12% and 8.01% less in stage 2 and stage 3 keratoconus, respectively, than that in the stage 1 keratoconus subgroup. In the posterior stroma, keratocyte cell density was also 4.94% and 6.48% less in stage 2 and stage 3 keratoconus, respectively, than in the stage 1 keratoconus subgroup. Eric et al. and Ucakhan et al. also related the loss of keratocyte to the severity of keratoconus (3, 4). Recently, Bitirgen et al. observed a significant difference in the keratocyte density between mild and moderate keratoconus (22). Studies showed that keratocyte cell loss could be associated with the release of cytokines in the pathological process of the disease that causes the apoptosis of keratocyte (23, 24). However, mechanical injuries in the epithelium due to eye rubbing or wearing of contact lenses could also lead to the release of apoptotic cytokines (25, 26). Therefore, micro trauma caused by eye rubbing or wearing of contact lenses could be an influencing factor in progressive cellular alteration. Furthermore, the differences in the keratocyte cell area between the control and the keratoconus group and among the different keratoconus subgroups could be explained by the increased irregularities in the size and shape of the keratocyte in the later stages of keratoconus.
Previous studies reported changes in the endothelial cell morphology in keratoconic eyes (3–6, 22). In the present study, polymegathism and pleomorphism were higher in patients with keratoconus than in those with healthy eyes. Moreover, polymegathism and pleomorphism were higher in patients with stage 3 keratoconus than in those with stage 1 and stage 2 keratoconus. Ucakhan et al. and Chi et al. observed ploymegathism and pleomorphism in severe keratoconus compared with those in the early stages of keratoconus (4, 27). Degenerative and ectatic changes in the later stages of keratoconus can explain the alteration in the usual hexagonal pattern of endothelial cells (27, 28). In the present study, the changes observed in endothelial cell density and cell area among the three keratoconus subgroups were not significantly different. Ucakhan et al. reported a significant decrease in endothelial cell density in severe keratoconus compared with mild and moderate keratoconus (4). However, Bitirgen et al. and Mocan et al. found a significant difference in endothelial cell density among mild, moderate and severe keratoconus (22, 29). The reason for the endothelial cell loss in keratoconus is not yet completely understood. Nevertheless, Kaldawy et al. argued that apoptosis is the only process of cell death in keratoconus (30). Therefore, the degenerative nature of keratoconus and apoptosis of endothelial cell could be the reason for the endothelial cell loss and the differences in endothelial cell density and area among the three keratoconus subgroups.
Conclusion
The present study showed that corneal cell morphology in keratoconus varies significantly from that in healthy eyes. Furthermore, the difference in morphological alteration, as observed in the different stages of keratoconus, was suggestive of progressive cellular changes in the cornea with the progression of the disease. As indicated in the above discussion, the management of keratoconus could be severity based. Although the usual pathological process of the disease cannot be interfered, avoiding micro trauma, such as eye rubbing and wearing ill-fitting contact lenses, may slow down the disease progression.
One of the limitations of the study is the difficulty in imaging three epithelium layers of the cornea. Moreover, a greater number of patients in each ethnic group could have revealed a better understanding of the effect of ethnicity on keratoconus.
Acknowledgement
I am thankful to the Ophthalmology Department, Hospital Sungai Buloh, Selangor, Malaysia for the guidance and support.
Footnotes
Funds
The research is not funded by any grant.
Conflict of Interest
The authors have no potential conflict of interests to declare.
Authors’ Contributions
Conception and design: SG, RG
Analysis and interpretation of the data: SG, RG
Drafting of the article: SG, RG
Critical revision of the article for important intellectual content: HAM, SK, RG, SR
Final approval of the article: HAM
Provision of study materials or patients: SR
Statistical expertise: SG, HAM, SK
Administrative, technical, or logistic support: HAM, SK
Collection and assembly of data: SG, SR
References
- 1.Rabinowitz Y. Keratoconus. Surv Ophthalmol. 1998;42(4):297–319. doi: 10.1016/s0039-6257(97)00119-7. https://doi.org/10.1016/S0039-6257(97)00119-127. [DOI] [PubMed] [Google Scholar]
- 2.Romero-Jiménez M, Santodomingo-Rubido J, Wolffsohn JS. Keratoconus: a review. Cont Lens Anterior Eye. 2010;33(4):157–166. doi: 10.1016/j.clae.2010.04.006. https://doi.org/10.1016/j.clae.2010.04.006. [DOI] [PubMed] [Google Scholar]
- 3.Erie JC, Patel SV, McLaren JW, Nau CB, Hodge DO, Bourne WM. Keratocyte density in keratoconus. A confocal microscopy studya. Am J Ophthalmol. 2002;13(5):689–695. doi: 10.1016/s0002-9394(02)01698-7. https://doi.org/10.1016/S0002-9394(02)01698-7. [DOI] [PubMed] [Google Scholar]
- 4.Uçakhan OO, Kanpolat A, Ylmaz N, Ozkan M. In vivo confocal microscopy findings in keratoconus. Eye Contact Lens. 2006;32(4):183–191. doi: 10.1097/01.icl.0000189038.74139.4a. https://doi.org/10.1097/01.icl.0000189038.74139. [DOI] [PubMed] [Google Scholar]
- 5.Weed KH, MacEwen CJ, Cox A, McGhee CNJ. Quantitative analysis of corneal microstructure in keratoconus utilising in vivo confocal microscopy. Eye (Lond) 2007;21(5):614–623. doi: 10.1038/sj.eye.6702286. https://doi.org/10.1038/sj.eye.6702286. [DOI] [PubMed] [Google Scholar]
- 6.Ku JYF, Niederer RL, Patel DV, Sherwin T, McGhee CNJ. Laser Scanning In Vivo Confocal Analysis of Keratocyte Density in Keratoconus. Ophthalmology. 2008;115(5):845–850. doi: 10.1016/j.ophtha.2007.04.067. https://doi.org/10.1016/j.ophtha.2007.04.067. [DOI] [PubMed] [Google Scholar]
- 7.Efron N, Hollingsworth JG. New perspectives on keratoconus as revealed by corneal confocal microscopy. Clin Exp Optom. 2008;91(1):34–55. doi: 10.1111/j.1444-0938.2007.00195.x. https://doi.org/10.1111/j.1444-0938.2007.00195.x. [DOI] [PubMed] [Google Scholar]
- 8.Choi JA, Kim MS. Progression of keratoconus by longitudinal assessment with corneal topography. Invest Ophthalmol Vis Sci. 2012;53(2):927–935. doi: 10.1167/iovs.11-8118. https://doi.org/10.1167/iovs.11-8118. [DOI] [PubMed] [Google Scholar]
- 9.Hollingsworth JG, Efron N, Tullo AB. In vivo corneal confocal microscopy in keratoconus. Ophthalmic Physiol Opt. 2005;25(3):254–260. doi: 10.1111/j.1475-1313.2005.00278.x. https://doi.org/10.1111/j.1475-1313.2005.00278.x. [DOI] [PubMed] [Google Scholar]
- 10.Efron N, Mutalib HA, Perez-Gomez I, Koh HH. Confocal microscopic observations of the human cornea following overnight contact lens wear. Clin Exp Optom. 2002;85(3):149–155. doi: 10.1111/j.1444-0938.2002.tb03027.x. https://doi.org/10.1111/j.1444-0938.2002.tb03027.x. [DOI] [PubMed] [Google Scholar]
- 11.Sawaguchi S, Fukuchi T, Abe H, Kaiya T, Sugar J, Yue BY. Three-dimensional scanning electron microscopic study of keratoconus corneas. Arch Ophthalmol. 1998;116(1):62–68. doi: 10.1001/archopht.116.1.62. https://doi.org/10.1001/archopht.116.1.62. [DOI] [PubMed] [Google Scholar]
- 12.Scroggs MW, Proia AD. Histopathological variation in keratoconus. Cornea. 1992;11(6):553–559. doi: 10.1097/00003226-199211000-00012. [DOI] [PubMed] [Google Scholar]
- 13.Somodi S, Hahnel C, Slowik C, Richter A, Weiss DG, Guthoff R. Confocal in vivo microscopy and confocal laser-scanning fluorescence microscopy in keratoconus. Ger J Ophthalmol. 1996;5(6):518–525. [PubMed] [Google Scholar]
- 14.Mackiewicz Z, Määttä M, Stenman M, Konttinen L, Tervo T, Konttinen YT. Collagenolytic proteinases in keratoconus. Cornea. 2006;25(5):603–610. doi: 10.1097/01.ico.0000208820.32614.00. https://doi.org/10.1097/01.ico.0000208820.32614.00. [DOI] [PubMed] [Google Scholar]
- 15.Sawaguchi S, Yue BY, Chang I, Sugar J, Robin J. Proteoglycan molecules in keratoconus corneas. Investig Ophthalmol Vis Sci. 1991;32(6):1846–1853. [PubMed] [Google Scholar]
- 16.Runager K, Basaiawmoit RV, Deva T, Andreasen M, Valnickova Z, Sørensen CS, et al. Human phenotypically distinct TGFBI corneal dystrophies are linked to the stability of the fourth FAS1 domain of TGFBIp. J Biol Chem. 2011;286(7):4951–4958. doi: 10.1074/jbc.M110.181099. https://doi.org/10.1074/jbc.M110.181099. [DOI] [PMC free article] [PubMed] [Google Scholar]
- 17.Chaerkady R, Shao H, Scott SG, Pandey A, Jun AS, Chakravarti S. The keratoconus corneal proteome: loss of epithelial integrity and stromal degeneration. J Proteomics. 2013;87:122–131. doi: 10.1016/j.jprot.2013.05.023. https://doi.org/10.1016/j.jprot.2013.05.023. [DOI] [PMC free article] [PubMed] [Google Scholar]
- 18.Muller LJ, Pels L, Vrensen GF. Novel aspects of the ultrastructural organization of human corneal keratocytes. Investig Ophthalmol Vis Sci. 1995;36(13):2557–2567. [PubMed] [Google Scholar]
- 19.Maurice DM. The cornea and sclera. In: Davson, editor. The eye 1B. 3rd ed. New York: New York Academic Press; 1984. pp. 1–158. [Google Scholar]
- 20.Hollingsworth JG, Efron N. Observations of banding patterns (Vogt striae) in keratoconus: a confocal microscopy study. Cornea. 2005;24(2):162–166. doi: 10.1097/01.ico.0000141231.03225.d8. [DOI] [PubMed] [Google Scholar]
- 21.Hayes S, Boote C, Tuft SJ, Quantock AJ, Meek KM. A study of corneal thickness, shape and collagen organisation in keratoconus using videokeratography and X-ray scattering techniques. Exp Eye Res. 2007;84(3):423–434. doi: 10.1016/j.exer.2006.10.014. https://doi.org/10.1016/j.exer.2006.10.014. [DOI] [PubMed] [Google Scholar]
- 22.Bitirgen G, Ozkagnici A, Bozkurt BMR. In vivo corneal confocal microscopic analysis in patients with keratoconus. Int J Ophthalmol. 2015;8(3):534–539. doi: 10.3980/j.issn.2222-3959.2015.03.17. https://doi.org/10.3980/j.issn.2222-3959.2015.03.17. [DOI] [PMC free article] [PubMed] [Google Scholar]
- 23.Engler C, Chakravarti S, Doyle J, Eberhart CG, Meng H, Stark WJ, et al. Transforming growth factor-beta signaling pathway activation in Keratoconus. Am J Ophthalmol. 2011;151(5):752–759. e2. doi: 10.1016/j.ajo.2010.11.008. https://doi.org/10.1016/j.ajo.2010.11.008. [DOI] [PMC free article] [PubMed] [Google Scholar]
- 24.Hollingsworth JG, Bonshek RE, Efron N. Correlation of the appearance of the keratoconic cornea in vivo by confocal microscopy and in vitro by light microscopy. Cornea. 2005;24(4):397–405. doi: 10.1097/01.ico.0000151548.46231.27. [DOI] [PubMed] [Google Scholar]
- 25.Wilson SE, He YG, Weng J, Li Q, McDowall AW, Vital M, et al. Epithelial injury induces keratocyte apoptosis: hypothesized role for the interleukin-1 system in the modulation of corneal tissue organization and wound healing. Exp Eye Res. 1996;62(4):325–327. doi: 10.1006/exer.1996.0038. https://doi.org/doi:10.1006/exer.1996.0038. [DOI] [PubMed] [Google Scholar]
- 26.Bureau J, Fabre EJ, Hecquet C, Pouliquen Y, Lorans G. Modification of prostaglandin E2 and collagen synthesis in keratoconus fibroblasts, associated with an increase of interleukin 1 alpha receptor number. CRAcadSciIII. 1993;316(4):425–430. [PubMed] [Google Scholar]
- 27.Chi HH, Katzin HMTC. Histopathology of keratoconus. Am J Ophthalmol. 1956;42(6):847–860. https://doi.org/10.1016/0002-9394(56)90654-7. [Google Scholar]
- 28.Sturbaum CW, Peiffer RL., Jr Pathology of corneal endothelium in keratoconus. Ophthalmologica. 1993;206(4):192–208. doi: 10.1159/000310390. [DOI] [PubMed] [Google Scholar]
- 29.Mocan MC, Yilmaz PT, Irkec M, Orhan M. In vivo confocal microscopy for the evaluation of corneal microstructure in keratoconus. Curr Eye Res. 2008;33(11):933–939. doi: 10.1080/02713680802439219. https://doi.org/10.1080/02713680802439219. [DOI] [PubMed] [Google Scholar]
- 30.Kaldawy RM, Wagner J, Ching S, Seigel GM. Evidence of apoptotic cell death in keratoconus. Cornea. 2002;21(2):206–209. doi: 10.1097/00003226-200203000-00017. [DOI] [PubMed] [Google Scholar]
- 31.Mutalib HA, Ghosh S, Kaur S, Ghoshal R. In vivo slit scanning confocal microscopic observation in a patient with moderate and severe keratoconus: a case report. Clinical Optometry. 2016;8:79–83. doi: 10.2147/OPTO.S106421. https://doi.org/10.2147/OPTO.S106421. [DOI] [PMC free article] [PubMed] [Google Scholar]
- 32.Snedecor GW, Cochran WG. Statistical methods. 8th ed. Ames: Iowa State Press; 1989. [Google Scholar]


