

Abstract
Background:
Diabetes mellitus (DM) is a cluster of metabolic diseases with chronic hyperglycemia as a defining feature, associated with long-term organ damage and dysfunction. In this study we examined the effect of Tulbaghia violacea rhizome methanolic extract on blood glucose and lipids in normal and streptozotocin-induced diabetic rats.
Materials and Methods:
Male Wistar rats (250-300g) were injected intraperitoneally (i.p.) with streptozotocin (60mg/kg body weight) to induce diabetes; or provided with distilled water for the control (CON) (3 ml/kg/b.w.) animals and treatment with TVL (60mg/kg.b.w). The rats were divided into 5 groups of 6 animals per group as follows: Non-diabetic control (NDC)-received distilled water (3ml/kg.b.w), Non-diabetic TVL (ND+TVL)-received TVL (60mh/kg b.w), Diabetic control (DC)-received distilled water (3ml/kg.b.w), Diabetic experimental (D+TVL)-received TVL (60mg/kg.b.w), Diabetic experimental (D+M)-received Metformin (250 mg/kg.b.w). All doses were administered daily via oral gavage.
Results:
TVL-treated animals showed reduced blood glucose, increased plasma insulin, reduced plasma TG, TC, VLDL and increased HDL. Furthermore we found decreased thiobarbituric acid reactive substances (TBARS) and increased superoxide dismutase (SOD) activity and nitric oxide significantly. Regarding renal parameters we found increased blood urea nitrogen (BUN), and improved renal morphology in TVL-treated animals.
Conclusion:
Tulbaghia violacea has a hypoglycaemic effect which could due to its effects on multiple pathways of the hyperglycemic process. Further work is needed to identify the mechanism of its antidiabetic effect.
Keywords: Tulbaghia violacea, STZ-induced diabetic rats, hypoglycemic activity
Introduction
Diabetes mellitus (DM) is a chronic metabolic disorder characterized by persistent hyperglycaemia associated with insulin deficiency and/ or insulin action. The prevalence of DM has been on a steady increase worldwide over the years. It has been estimated that diabetes will be the 7th leading cause of death by 2030 (WHO, 2015). It is well documented that hyperglycaemia is associated with alterations in carbohydrate, lipid and protein metabolism resulting in macro- and micro-vascular complications including nephropathy, neuropathy, retinopathy, cardiovascular and vascular disease (Saltiel and Kahn 2001; Pop-Busui et al., 2013). To date, there is still no effective remedy that is able to completely control DM. Scientists worldwide are in a quest for novel remedies for the management and/or control of DM. Over centuries, plants have been used as a veritable source of drugs for the treatment, management and/or control of various human disorders. Consequently, the search for newer, better-tolerated and more efficacious drugs and remedies with fewer side-effects from dietary and medicinal plants in the wild has continued over time. In this regards South Africa and Africa provides a fertile ground for drug discovery from plants with it unique and vast botanical heritage and the penchant for the general populace to use the natural remedies.
Tulbaghia violacea Harv. (T. violacea) (Family: Alliaceae) is used in folkloric medicine, in Africa, to treat or manage a catalogue of human diseases, including hypertension, asthma, oesophageal cancer, fevers and colds, inflammation, tuberculosis and, diabetes mellitus (Hutchings 1996; Van Wyk and Gericke 2000; Kubec et al., 2002; Wyk and Wink 2004). T. violacea (Alliaceae) is a small, bulbous herb, which is indigenous to Southern Africa. The ubiquitous herbaceous plant is also known by many other common local names, such as ‘wild garlic’, ‘society garlic’, and ‘sweet garlic’ (Hutchings 1996; Kubec et al., 2002; Wyk and Wink 2004; Mackraj et al., 2008). The evergreen leaves of T. violacea Harv possess a garlic-like smell when crushed or bruised, and have been used as a substitute for garlic and chives in some Southern African communities and cultures.
The treatment of lifestyle diseases with multiple aetiologies requires a multifaceted, novel approach. Plants have multiple phytochemicals, which in turn suits the multi-targeted approach to disease management. TVL is known to possess phenolic compounds, allicin, and quercetin and hence it was of interest to find out the synergistic action of these compounds on the control of blood glucose.
Furthermore, Metformin, the drug of choice for type 2 diabetes clinically, has several well-known metabolic effects, such as glycemic control and weight loss, but new studies are pointing towards its antioxidant properties, an aspect that needs further investigation (Nasri et al., 2013) especially in the clinical setting as metformin associated lactic acidosis poses a danger in certain patients.
The aim of this study was to investigate the effect of T. violacea rhizome methanolic extract and the conventional drug metformin on blood glucose levels, lipids, oxidative stress markers and renal parameters in normal and diabetic Wistar rats.
Materials and Methods
Plant material
Tulbaghia violacea (TVL) rhizomes were collected, identified by botanist, H Baijnath and a voucher specimen has been deposited in the Ward herbarium at the University of KwaZulu-Natal (Westville campus).
Preparation of extract
The rhizomes were washed and allowed to air-dry at room temperature for 48 hours. Thereafter the plant material was weighed, crushed in a Waring blender, immersed in methanol and agitated on a shaker for 48 hours. The crude extract was then filtered and the solvent was concentrated in a rotary evaporator (Heidolph, Ortenberg, Germany). The extract was freeze-dried and stored in a desiccator at 4°C.
Chemicals
The chemicals, streptozotocin (STZ) and metformin, used in this study were obtained from Sigma Aldrich, St. Louis, MO, USA. All chemical used for TBARS and nitric oxide determinations were obtained from Merck Chemicals, Germany.
Animals
Male Wistar rats (250-300g) were obtained from the Biomedical Research Unit at the University of KwaZulu-Natal (Westville campus) and maintained under standard conditions at 23°C, and 12/12 hour light/dark cycles. The animals were allowed access to food and water ad libitum. The study was approved by the University of Kwazulu-Natal, Animal Ethics Committee (30/11/Animal).
Induction of diabetes
Rats were fasted overnight and then injected intraperitoneally (i.p.) with a single dose of STZ (60mg/kg body weight) dissolved in freshly prepared 0.1M citrate buffer solution (pH 4.5). Control rats were injected with citrate buffer alone. After 7 days, blood was drawn from the tail and glucose concentration was measured using a glucometer (Lifescan OneTouch, CA, USA). Animals with a glucose concentration of greater than 25mmol/L were considered to be diabetic and selected for the study.
Study design
The rats were divided into 5 groups of 6 animals per group.
Group 1 Non-diabetic control (NDC)-received distilled water (3ml/kg.b.w).
Group 2 Non-diabetic TVL (ND+TVL)-received TVL (60mg/kg.b.w).
Group 3 Diabetic control (DC)-received distilled water (3ml/kg.b.w).
Group 4 Diabetic experimental (D+TVL)-received TVL (60mg/kg.b.w).
Group 5 Diabetic experimental (D+M)-received Metformin (250 mg/kg.b.w).
All doses were administered daily via oral gavage. Water and food intake was monitored daily. Body weights were measured weekly.
Determination of glucose concentrations
Blood glucose levels were measured weekly using a glucometer (Lifescan One touch, CA, USA).
Oral glucose tolerance test (OGTT)
On day 21 animals were orally administered an oral glucose dose of (2g/kg.b.w.). Thereafter, blood glucose concentrations were measured at 0, 15 30,45,60,90 and 120 min intervals.
Animal sacrifice
On day 28, the rats were sacrificed by halothane overdose and blood was removed by cardiac puncture. The heart, kidney, liver tissues of each rat were harvested, weighed and snap frozen in liquid nitrogen. Biological materials were temporarily stored at -70°C for further analysis.
Histopathology of kidney
Right kidneys were isolated, fixed in buffered neutral formalin, embedded in paraffin wax, sectioned at 5μm and stained with haematoxylin and eosin (H&E). Sections were scanned using a Leica SCN400 scanner (Germany) for examination of renal morphology.
Determination of serum lipids and liver-function enzymes
Serum triglyceride (TG), total cholesterol (TC), high density lipoproteins (HDL), AST and ALT were determined using a chemistry analyzer (Labmax Plenno, Labtest, Lagoa-Santa, Brazil). Very low density lipoprotein (VLDL) levels were determined using the formula: VLDL=Triglycerides/5. Low density lipoprotein (LDL) values were determined according to the Friedwald formula LDL=TC -HDL-VLDL (Friedwald et al., 1972).
Determination of plasma TBARS activity
The level of lipid peroxidation was assessed by the Thiobarbituric Acid Reactive Substances (TBARS) assay as previously described by Moodley et al., 2014.
Determination of superoxide dismutase activity
The activity of SOD was determined using a superoxide dismutase activity kit (BioVision, California, USA).
Determination of plasma nitric oxide levels
Nitric oxide production was determined by a method as previously described by Moodley et al., 2014.
Determination of urinary volume and electrolytes
Urine output was measured weekly, and serum creatinine and urea concentrations were determined using an electrolyte analyzer (Beckman Coulter Synchron, CX 3 Delta Clinical System, USA).
Statistical analysis
All results are expressed as mean ± SEM. Statistical differences between the groups were analyzed by One-way analysis of variants (ANOVA) using Graphpad Prism V5.0. P values < 0.05 were considered to be significant.
Results
Effect of TVL on body weight
The body weights of the control and TVL-treated non-diabetic rats increased significantly (308.20±4.50 vs. 362.80±7.60), p<0.001 and (301.70±7.83 vs.350.30±12.23) p< 0.05 respectively when week 4 was compared to baselines. The diabetic control rats showed a significant loss of body weight at week 4 (265.50±4.34 vs.223.30±7.50), p<0.01. However, the diabetic rats treated with TVL showed non-significant weight loss when week 4 weights were compared to their baseline values (274.30±17.10 vs.246.70±19.22). The metformin-treated diabetic group also showed a non-significant reduction in body weight (271.00±6.10 vs.242.50±3.42), p<0.001.
Relative kidney weights (% of body weight) of the diabetic rats were significantly higher than the non-diabetic rats, p<0.001. There were no significant differences between the non-diabetic control rats and the TVL-treated non-diabetic rats. The relative kidney weights of the diabetic rats treated with TVL were significantly reduced when compared to the diabetic control rats (0.80±0.02 vs.0.89±0.01), p<0.05. The diabetic animals showed significantly increased relative liver weights when compared to the non-diabetic rats, diabetic+TVL (p< 0.01) and diabetic control and metformin-treated rats, p<0.001. The relative liver weights of the diabetic groups were significantly higher than those of the non-diabetic groups, p<0.01 and p<0.001. Food consumption was significantly increased in the diabetic rats compared to the non-diabetic control and TVL-treated rats, p<0.001. The diabetic rats showed significantly increased water intake compared to diabetic rats compared to the non-diabetic control and TVL-treated rats, p<0.001. Diabetic rats treated with TVL and metformin showed significantly reduced water intake compared to the diabetic control rats, p<0.001.
Effect of TVL on relative organ weights and on food and water consumption
The mean blood glucose levels of the control and experimental groups of rats are shown in Fig. 2. There were no significant differences in the glucose levels of NDC (4.98±0.19 vs.5.02±0.37), ND+TVL (5.1±0.2 vs.4.88±0.50), DC (27.70±3.57 vs.30.90±2.07) and when week 4 was compared baseline. However, D+TVL (17.62±1.29 vs.30.17±1.33 and D+M (21.55± 0.67 vs. 32.45±0.71) showed significant decreases in blood glucose concentration), p<0.01 when week 4 was compared to baseline values.
Figure 1.
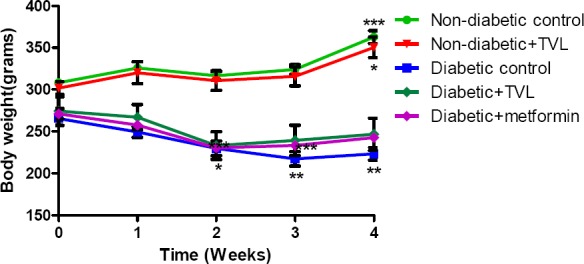
Mean body weights of control and experimental groups of rats over 4 weeks. All data are expressed as mean±SEM for group of 6 animals each. *p<0.05 compared with baseline value.
Figure 2.
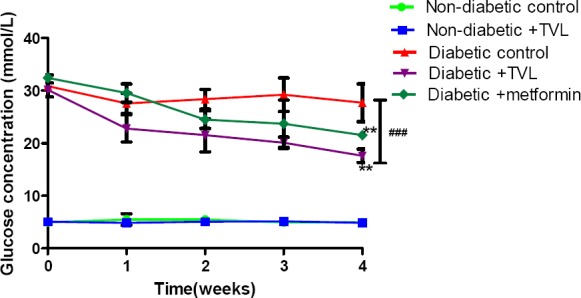
Blood glucose concentrations of control and experimental groups of rats over 4 weeks. All data are expressed as mean±SEM for group of 6 animals each. **p<0.01 denotes significant difference compared to baseline value. ###denotes significant difference diabetic rats compared to non-diabetic rats.
Effect of TVL on oral glucose tolerance tests (OGTT)
The OGTT responses of the control and experimental groups of rats are shown in Fig. 3a. Fig.3b. represents the AUC determined from the OGTT graph. Following a glucose load, the diabetic groups showed significantly increased AUCglucose values compared to the non-diabetic control and TVL-treated groups, p<0.001. The TVL-treated diabetic group (1957.0±152.4) showed significantly reduced AUCgucose compared to the diabetic control (2803.0±34.87) as well as the metformin-treated (2957.0±271.9 groups), p<0.05. There was no significant difference in AUCgucose between the non-diabetic control (619.0±32.23) and the non-diabetic group treated with TVL (632.6.0±44.03).
Figure 3a.
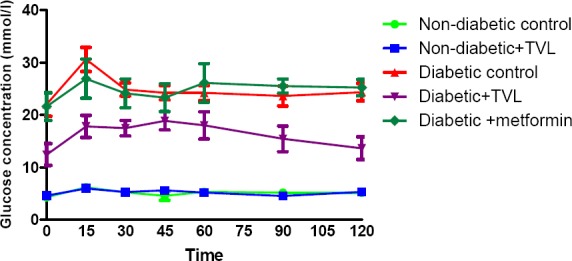
Effect of TVL on oral glucose tolerance of control and experimental groups of rats on day 20. All data are expressed as mean±SEM for group of 6 animals each.
Figure 3b.
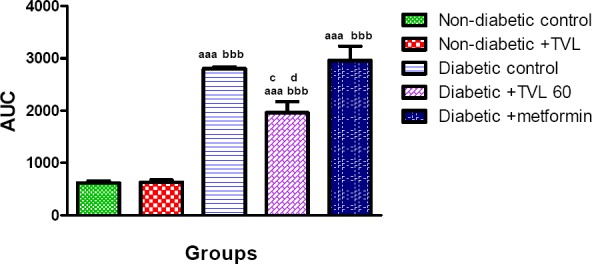
Area under the curve (AUC) determined from OGTT of control and experimental groups of rats at day 20. All data are expressed as mean±SEM for group of 6 animals each. aaap<0.001 compared to non-diabetic control.bbbp<0.001 compared to non-diabetic+ TVL. cp<0.05 diabetic+TVL compared to diabetic control group. dp<0.05 diabetic +TVL compared to metformin group.
Effect of TVL on plasma insulin levels
Plasma insulin levels in control and experimental rats are represented by Fig 4. The diabetic control rats showed significantly decreased plasma insulin levels compared to the non-diabetic control and TVL-treated rats (0.065±0.008 vs. 0.122±0.018 and 0.127±0.016 respectively), p<0.05. The diabetic rats treated with TVL (0.108±0.008) showed a significant increase in plasma insulin levels compared to the diabetic control rats. The plasma insulin levels in the metformin-treated group (0.086±0.006) did not differ significantly from the diabetic control group.
Effect of TVL on antioxidant status and renal parameters
Effect of TVL on plasma TBARS levels
Plasma TBARS levels (nmol) in control and experimental rats are shown in Fig 5. The diabetic control rats showed a significant increase in TBARS levels compared to the non-diabetic control (314.10± 0.008 vs.219.60±0.015), p<0.01 as well as the non-diabetic rats treated with TVL (205.10±0.009), p<0.001. Diabetic rats treated with TVL (211.50±0.008) and metformin (212.60±0.015) showed significant reductions in TBARS levels compared to the diabetic control rats, p<0.01.
Figure 4.
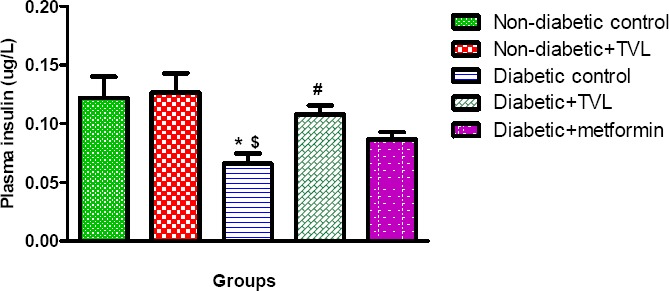
Plasma insulin levels of control and experimental groups of rats at day 28. All data are expressed as mean±SEM for group of 6 animals each. *p<0.05 compared to non-diabetic control. $p<0.05 compared to non-diabetic+TVL. #p<0.05 compared to diabetic control.
Effect of TVL on superoxide dismutase activity
Plasma superoxide dismutase activity in control and experimental rats are shown in Fig 6. The diabetic control rats showed a significant decrease in SOD activity compared to the non-diabetic control (52.90± 5.69 vs.82.37±5.43) as well as the non-diabetic rats treated with TVL (77.16±4.84), p<0.05. Diabetic rats treated with TVL (82.07±1.69) and metformin- (80.48±1.68) showed significantly increased SOD activity compared to the diabetic control rats, p<0.01.
Figure 5.
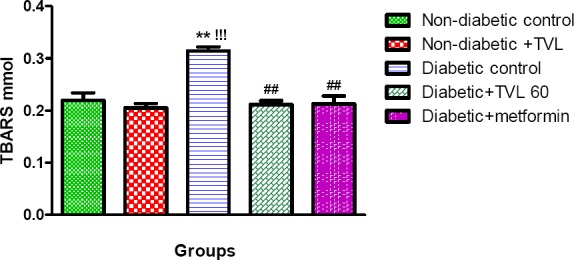
Plasma TBARS levels of control and experimental groups of rats. All data are expressed as mean ± SEM for group of 6 animals each. **p<0.01 compared to non-diabetic control. !!!p<0.001 compared to non-diabetic+TVL. ##p<0.01 compared to diabetic control.
Effect of TVL on plasma nitric oxide levels
Plasma nitric oxide levels (mmol/l) in control and experimental rats are shown in Fig 7. The diabetic control rats showed a significant decrease in NO levels compared to the non-diabetic control (18.86±1.42 vs.27.35 ±1.85) as well as the non-diabetic rats treated with TVL (28.39±0.83), p<0.05. Diabetic rats treated with TVL (28.61±1.71) showed significantly increased NO levels compared to the diabetic control rats, p<0.05. The metformin-treated group (26.80±2.97) did not show significantly increased plasma NO levels compared to the diabetic control group.
Figure 6.
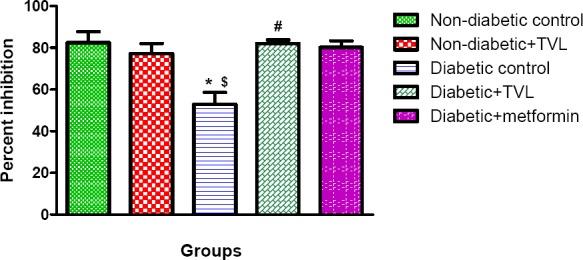
Plasma superoxide dismutase activity of control and experimental groups of rats. All data are expressed as mean±SEM for group of 6 animals each. * p<0.05 compared to non-diabetic control. $p<0.05 compared to non-diabetic+TVL. #p<0.05 compared to diabetic control.
Figure 7.
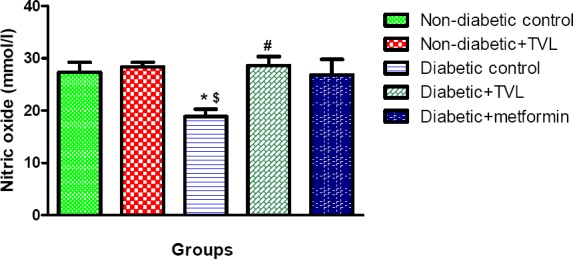
Plasma nitric oxide levels of control and experimental groups of rats. All data are expressed as mean±SEM for group of 6 animals each. *p<0.05 compared to non-diabetic control. $p<0.05 compared to non-diabetic+TVL. #p<0.05 compared to diabetic control.
Figure 8.
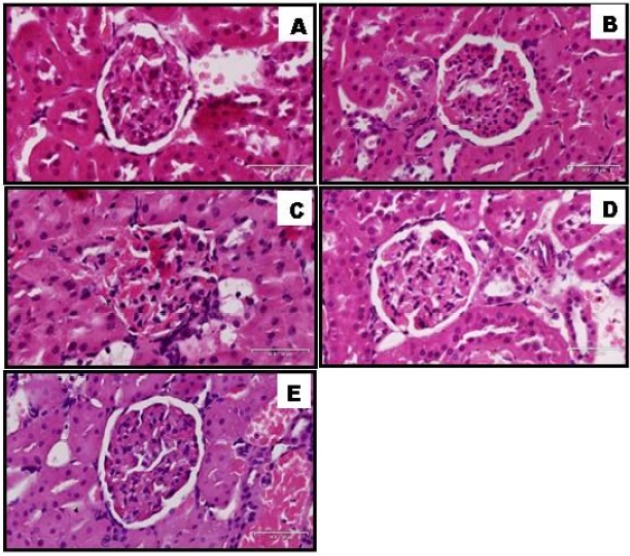
Histopathology of kidney of non-diabetic and diabetic rats treated with TVL. A: Normal control, B: Non-diabetic treated with TVL (60mg/kg/b.w), C: Diabetic control, D: Diabetic treated with TVL (60mg/kg/b.w), and E: Diabetic treated with metformin (250mg/kg/b.w). H&E 30x100μm.
Effect of TVL on serum urea and creatinine levels
Serum urea levels were significantly increased in the diabetic control rats (26.70±2.13) compared to the non-diabetic (4.94±0.21) and the non-diabetic+TVL(5.33±0.26) groups (p<0.001). TVL (11.67±1.65) and metformin (18.57±2.43) administration significantly reduced serum urea levels compared to the diabetic control animals, p<0.001 and p<0.05 respectively.
Effect of TVL on serum lipids and liver enzymes
The effect of serum lipid, AST and ALT levels are shown in Table 3. The untreated diabetic rats showed signific increased serum triglyceride (121.00±4.20 p<0.001). Total cholesterol (86.50±0.76, p<0.05). LDL-cholesterol (43.20±1.91, p< and VLDL (24.20±0.84, p<0.001) as well as reduced HDL-cholesterol levels(19.00±0.71, p<0.05) compared to NDC and ND+l However, administration of TVL to diabetic rats significantly decreased serum triglyceride (71.50±2.03, p<0.001), total choles (68.50±3.07, p<0.05), LDL-cholesterol (27.20±2.07, p<0.001) and VLDL (14.30±0.41, p<0.001) compared to the untreated dia rats. In addition HDL-cholesterol levels (26.40±1.36, p<0.01) were significantly elevated in the TVL-treated rats compared t diabetic control rats. Metformin treatment significantly increased serum levels of HDL-cholesterol (26.00±1.08, p<0.01) comp to the diabetic control group. Triglyceride (96.33±8.61, p<0.01) and VLDL levels (20.87±0.52, p<0.01) were also found t significantly elevated in the metformin-treated rats compared to the ND+TVL group.
Table 1.
Effect of TVL on percentage kidney (% KW) and liver weights (% LW) as well as food and water intake in non-diabetic rats treated with distilled water, non-diabetic control (NDC); and TVL 60 mg/kg.b.w. (ND +TVL) as well as diabetic rats treated with distilled water, diabetic control (DC); TVL60mg/kg.b.w. (D+TVL) and metformin 250mg/kg.b.w (D+metformin). All data are expressed as mean ± SEM for 6 animals per group.
| Parameters | Experimental groups | ||||
|---|---|---|---|---|---|
| NDC | ND+TVL | DC | D+TVL | D+ metformin | |
| % KW. | 0.59±0.02 | 0.59±0.01 | 0.89±0.01aaa | 0.80±0.02aaa c | 0.84±0.03aaa |
| % LW | 0.56±0.03 | 0.56±0.01 | 0.74±0.03aaa | 0.69±0.01aa | 0.76±0.02aaa |
| Food intake (g) | 14.75±2.53 | 14.40±1.75 | 35.20±2.49aaa bbb | 32.00±1.77aaa bbb | 35.75±2.62aaa bbb |
| Water intake (ml) | 22.50±1.44 | 16.17±2.59 | 148.70±4.67aaa bbb | 111.70±4.23aaa bbb ccc | 116.70±4.14aaa bbb ccc |
Significantly different from NDC, p<0 05
Significantly different from NDC, p<0 001
Significantly different from ND+TVL, p<0.001.
Significantly different from DC, p<0 05
Significantly different from DC, p<0.001.
Table 2.
Effect of TVL on serum SOD activity, TBARS, NO, urea and creatinine levels in non-diabetic rats treated with distilled water, non-diabetic control (NDC); and TVL 60 mg/kg.b.w.(ND +TVL) as well as diabetic rats treated with distilled water, diabetic control (DC); TVL60mg/kg.b.w.(D+TVL) and metformin 250mg/kg.b.w (D+metformin). All data are expressed as mean±SEM for 6 animals per group.
| Parameters | Experimental groups | ||||
|---|---|---|---|---|---|
| NDC | ND+ TVL | DC | D+TVL | D+Metformin | |
| SOD (% inhibition) | 82.37±5.43 | 77.16±4.84 | 52.90±5.69**$ | 82.07±1.69# | 80.48±1.68# |
| TBARS (nmol) | 219.60±0.015 | 205.10±0.009 | 314.10± 0.008***### | 211.50±0.008# | 212.60±0.015## |
| NO (uM) | 27.35±1.85 | 28.39±0.83 | 18.86±1.42**$ | 28.61±1.72# | 26.80±2.97 |
| Serum urea (mmol/L) | 4.94±0.21 | 5.33±0.26 | 26.70±2.13***$$$ | 11.67±1.65*### | 18.57±2.43***$$$# |
| Serum creatinine (mmol/L) | 37.00±0.63 | 37.33±0.88 | 34.33±0.67 | 32.33±5.18 | 34.67±1.20 |
Significantly different from non-diabetic control, p<0.05.
Significantly different from non-diabetic control, p<0.01
Significantly different from non-diabetic control, p<0.001.
Significantly different from non-diabetic+TVL, p<0.05.
Significantly different from non-diabetic+TVL, p<0.001.
Significantly different from diabetic control, p<0.05
Significantly different from diabetic control, p<0.01.
Significantly different from diabetic control, p<0.001.
Table 3.
Effect of TVL on serum triglyceride, total cholesterol, HDL-cholesterol, LDL-cholesterol, VLDL, liver AST and ALT levels in non-diabetic rats treated with distilled water, non-diabetic control (NDC); and TVL 60 mg/kg.b.w. (ND +TVL) as well as diabetic rats treated with distilled water, diabetic control (DC); TVL60mg/kg.b.w.(D+TVL) and metformin 250mg/kg.b.w (D+metformin). All data are expressed as mean±SEM for 6 animals per group.
| Parameters | Experimental groups | ||||
|---|---|---|---|---|---|
| NDC | N D+TVL | DC | D+TVL | D+ metformin | |
| Triglycerides (mg/dl) | 68.33±9.12 | 65.33±5.84 | 121.00±4.20*** $$$ | 71.50±2.03### | 96.33±8.61$ |
| Total cholesterol (mg/dl) | 70.00±1.53 | 64.40±4.70 | 86.50±0.76*$$ | 68.50±3.07c# | 81.60±7.08 |
| HDL-cholesterol (mg/dl) | 24.75±1.60 | 24.00±1.53 | 19.00±0.71* | 26.40±1.36## | 26.00±1.08# |
| LDL-cholesterol (mg/dl) | 31.05±2.62 | 27.73±3.75 | 43.20±1.91*$$ | 27.20±2.07## | 34.70±1.60 |
| VLDL (mg/dl) | 13.67±1.83 | 13.07±1.17 | 24.20±0.84*** $$$ | 14.30±0.41### | 20.87±0.52**$$$! |
| AST (U/l) | 77.00±2.97 | 75.67±2.84 | 109.30±10.17**$$ | 78.33±3.53# | 99.50±6.50 |
| ALT (U/l) | 56.83±2.40 | 59.83±2.09 | 111.60±15.13***$$ | 77.00±5.52# | 93.00±4.00 |
p<0.05 Significantly different from non-diabetic control.
p<0.001 Significantly different from non-diabetic control.
p<0.05 Significantly different from non-diabetic +TVL.
p<0.01 Significantly different from non-diabetic +TVL
p<0.001 Significantly different from non-diabetic +TVL.
p<0.05 Significantly different from diabetic control.
p<0.01 Significantly different from diabetic control.
P<0.001 Significantly different from diabetic control.
p<0.05 Significantly different from diabetic+TVL.
Serum AST (109.30±10.17, p<0.01) and ALT levels (111.60±15.13, p<0.001) were significantly increased in the diabetic co rats compared to both non-diabetic groups. Treatment of diabetic rats with TVL significantly reduced AST (78.33±3.53) and (77.00±5.52) levels in serum, p<0.05.
Effect of TVL on renal morphology
Discussion
Metabolic diseases continue to contribute to the high burden of disease in both developed and in low-resourced countries, and are a major contributor to morbidity and mortality. The diabetes scourge, with its multi-aetiological profile, is rapidly becoming one of the greatest threats to World Health. Many people from non-industrialized and more industrialized communities are resorting to ‘natural remedies’ because of poor access, contra-indications of conventional drugs, and by the fact that alternate therapies have a more multi-targeted approach. TVL, in particular, is a plant which had been used traditionally to lower blood pressure (Hutchings 1996, Wyk and Wink 2004) and recent experimental studies have shown the plant to have blood pressure lowering effects (Moodley et al., 2013) and ACE inhibitory effects (Mackraj et al., 2008). There has been a paucity of studies relating to Type 1 diabetes.
Hence, the present study was conducted to evaluate the effects of the medicinal plant, T. violacea on blood glucose and lipid levels in STZ-induced diabetic rats. STZ has been used extensively to induce diabetes mellitus in laboratory animals due to its toxic effect on the β cells of the pancreatic islet of Langerhans. According to Akbarzadeh et al., 2007, STZ administered at a dose of 60mg/kg.b.w. initiates an autoimmune process resulting in destruction of the β cells and manifestations of clinical diabetes in rats within 2-3 days. Hyperglycaemia, hypoinsulinaemia, severe body weight loss, polydipsia, polyphagia and polyuria are characteristic of STZ-induced diabetes (Akbarzadeh et al., 2007).
As we expected, in the present study, we found significantly elevated blood glucose levels, reduced body weights and increased water and food consumption along with increased urine output (data not shown) in the diabetic rats compared to the non-diabetic rats, validating our model for induction of diabetes. The administration of TVL to diabetic rats was promising; showing significantly reduced blood glucose levels, improved body weight, and decreased polydipsia with no significant effect on polyphagia. Furthermore, plasma insulin levels were significantly increased in the TVL-treated diabetic rats. In this particular model, it is most likely that the hypoglycaemic effects of TVL could be attributed to increased insulin secretion by remnant pancreatic β cells, or to pathways which result in release of bound insulin or regeneration of β cells. Others have attributed their observed hypoglycaemic effects to increased glycolysis and decreased gluconeogenesis and antioxidant effects (Kondeti et al., 2010; Nain et al., 2012). Other mechanisms accounting for the hypglycaemic effect could be attributed to improved uptake of glucose by the GLUT transmembrane receptors. Generally, naturopathic remedies containing multiple phytochemicals could affect multiple pathways thereby showing better outcomes than conventional drugs, which may be designed to target a single pathway.
The reduced body weights in diabetic rats in this study is a well-documented observation, and may be due to increased catabolism of proteins as a consequence of insulin deficiency which results in degeneration of structural proteins and muscle wasting (Geer and Shen 2009; Rasineni et al., 2010). Whilst the diabetic control and metformin-treated rats showed significant weight-loss over the treatment period, TVL suppressed the loss of body weight in treated animals which could be related to the improved control of glycaemia and an increase in the synthesis of structural proteins.
Insulin deficiency is also associated with hypertriglyceridemia and hypercholesterolaemia (Kondeti et al., 2010). Indeed, DM is associated with metabolic disorders involving fats, proteins and CHO and hence the impact of DM on LDL and TC is to be expected. However, notably in this study, treatment with TVL was able to considerably reduce both these parameters. Once again improved glycaemic control and direct effects on lipid metabolism could account for this. Hyperlipidaemia is common in both Type 1 and Type 2 diabetes. And while high plasma triglycerides and low (HDL) levels have been correlated with the development of diabetic nephropathy and cardiovascular complications, arguments on its impact on the progression of renal disease still remains well founded (Trevisan et al., 2006).
Nephroprotection by glycemic, blood pressure control, reduction of oxidative stress (Tavafi 2013) and inflammation has been promulgated. In this study we investigated TVL, a plant that exhibited RAAS blockade (Mackraj et al., 2008; Raji et al., 2012); reduction in oxidative stress (Moodley et al., 2013); glycemic and blood pressure control (Mackraj et al., 2008; Moodley et al., 2013). RAAS blockade offers protection through well-known haemodynamic effects (vasodilation) and non-haemodynamic effects (anti-fibrotic) and therefore show positive outcomes in diabetic nephropathy (Taylor et al., 2011) and notably through attenuation of oxidative stress.
Diabetic nephropathy (DN) is the single most common cause of end-stage renal disease in the Western societies and is a major factor in cardiovascular morbidity and mortality. Both Metformin and TVL have shown improved renal outcomes in this study, as evidenced both biochemically and histologically. Although no changes were observed in serum creatinine levels, BUN was significantly reduced in TVL and metformin treated animals. In our study progression and presence of DN in the diabetic control group showed up as glomerular hypertrophy, expansion of the mesangial matrix, and thickening of glomerular basement membranes. Other features such as proteinuria, glomerulosclerosis, and tubulointerstitial fibrosis are usually markers of later stages of the disease (Sugimoto etal., 2007).
Reduced glomerulosclerosis in TVL-treated kidneys could be attributed to increase NO levels and reduced oxidative stress observed in the present study. Increased NO production and reduced oxidative stress play an important role in renoprotection through suppression of two key pathological events in kidney disease viz. inflammation and fibrosis (Shen et al., 2008). Mechanistically, NO acts by suppressing NADPH oxidase-induced, ROS formation and decreasing profibrotic cytokine, TGF-β. In a previous study we observed alteration in TGF-β expression which could promote morphological changes, such as glomerulosclerosis by its effects on extracellular matrix deposition (Moodley et al., 2014.
Interestingly, the conventional, widely used drug metformin did reveal some noteworthy effects. It was shown to increase HDL, reduce TG, increase SOD activity as well as decrease TBARS in comparison to the diabetic control. Others have alluded to the ability of metformin to attenuate oxidative stress (Nasri et al., 2013; Piwkowska et al., 2010) but this function in the clinical setting still needs to be investigated. It is also of great interest, that metformin apart from its insulin dependent functions, is able to lower glucose via novel mechanisms such as the GLUT 4 genetic expression, via the B endorphin secretion from the adrenal glands (Cheng et al., 2006). This may have particular relevance to type 1 diabetes and account for our findings in this model STZ-induced diabetes.
Conclusion
From the data obtained in the current study, it is evident that TVL and its active constituents has a hypoglycaemic effect in this model which could be attributed to its effects on several pathways of the hyperglycaemic process. T. violacea shows potential as a therapeutic agent or as an add-on in conventional therapies for controlling glucose homeostasis. However, to pinpoint a possible mechanism of action, we would need to investigate the active components of the plant, and investigate a mechanism/s of action for the glycaemic control.
References
- 1.Akbarzadeh A. D, Norouzian M, Mehrabi S, Jamshidi A, Farhangi A. A, Verdi, Mofidian S, Rad B. L. “Induction of diabetes by streptozotocin in rats.”. Indian Journal of Clinical Biochemistry. 2007;22(2):60–64. doi: 10.1007/BF02913315. [DOI] [PMC free article] [PubMed] [Google Scholar]
- 2.Cheng J. C, Huang I. Liu, Tzeng T, Chang C. “Novel mechanism for plasma glucose-lowering action of in streptozotocin-induced diabetic rats.”. Diabetes. 2006;55(3):819–825. doi: 10.2337/diabetes.55.03.06.db05-0934. [DOI] [PubMed] [Google Scholar]
- 3.Geer E. B, Shen W. “Gender differences in insulin resistance, body composition, and energy balance.”. Gender medicine. 2009;6:60–75. doi: 10.1016/j.genm.2009.02.002. [DOI] [PMC free article] [PubMed] [Google Scholar]
- 4.Hutchings A. Zulu medicinal plants: an inventory. University of Natal Press; 1996. [Google Scholar]
- 5.Kondeti V. K, Badri K. R, Maddirala D. R, Thur S. K. M, Fatima S. S, Kasetti R. B, Rao C. A. “Effect of Pterocarpus santalinus bark, on blood glucose, serum lipids, plasma insulin and hepatic carbohydrate metabolic enzymes in streptozotocin-induced diabetic rats.”. Food and Chemical Toxicology. 2010;48(5):1281–1287. doi: 10.1016/j.fct.2010.02.023. [DOI] [PubMed] [Google Scholar]
- 6.Kubec R. J, Velíšek, Musah R. A. “The amino acid precursors and odor formation in society garlic (Tulbaghia violacea Harv.).”. Phytochemistry. 2002;60(1):21–25. doi: 10.1016/s0031-9422(02)00065-1. [DOI] [PubMed] [Google Scholar]
- 7.Mackraj I. S, Ramesar M, Singh T, Govender H, Baijnath Singh R, Gathiram P. “The in vivo effects of Thulbhagia violacea on blood pressure in a salt-sensitive rat model.”. Journal of Ethnopharmacology. 2008;117(2):263–269. doi: 10.1016/j.jep.2008.01.040. [DOI] [PubMed] [Google Scholar]
- 8.Moodley Mackraj K. I, Naidoo Y. “Cardiovascular effects of Tulbaghia violacea Harv. (Alliaceae) root methanolic extract in Dahl salt-sensitive (DSS) rats.”. J Ethnopharmacol. 2013;146(1):225–231. doi: 10.1016/j.jep.2012.12.036. [DOI] [PubMed] [Google Scholar]
- 9.Moodley Naidoo K. Y, Mackraj I. “Effects of Tulbaghia violacea Harv. (Alliaceae) rhizome methanolic extract on kidney function and morphology in Dahl salt-sensitive rats.”. Journal of ethnopharmacology. 2014;155(2):1194–1203. doi: 10.1016/j.jep.2014.07.003. [DOI] [PubMed] [Google Scholar]
- 10.Nain P. V, Saini S, Sharma Nain J. “Antidiabetic and antioxidant potential of Emblica officinalis Gaertn. leaves extract in streptozotocin-induced type-2 diabetes mellitus (T2DM) rats.”. Journal of Ethnopharmacology. 2012;142(1):65–71. doi: 10.1016/j.jep.2012.04.014. [DOI] [PubMed] [Google Scholar]
- 11.Nasri H. A, Baradaran M, Ardalan S, Mardani A Momeni, Rafieian-Kopaei M. R. “Bright renoprotective properties of metformin.”. Iranian Journal of Kidney Diseases. 2013;7(6):423–428. [PubMed] [Google Scholar]
- 12.Piwkowska A. D, Rogacka M, Jankowsi M, Dominiczak J, Stepinski Angielski S. “Metformin induces suppression of NAD(P)H oxidase activity in podocytes.”. Biochem BiophysRes Commun. 2010;393:2. doi: 10.1016/j.bbrc.2010.01.119. [DOI] [PubMed] [Google Scholar]
- 13.Pop-Busui R. P. A, Cleary B. H, Braffett C. L, Martin W. H, Herman P. A, Low Lima J. A, Bluemke D. A. “Association between cardiovascular autonomic neuropathy and left ventricular dysfunction: DCCT/EDIC study (Diabetes Control and Complications Trial/Epidemiology of Diabetes Interventions and Complications).”. Journal of the American College of Cardiology. 2013;61(4):447–454. doi: 10.1016/j.jacc.2012.10.028. [DOI] [PMC free article] [PubMed] [Google Scholar]
- 14.Raji I. P, Mugabo Obikeze K. “Effect of Tulbaghia violacea on the blood pressure and heart rate in male spontaneously hypertensive Wistar rats.”. Journal of Ethnopharmacology. 2012;140(1):98–106. doi: 10.1016/j.jep.2011.12.034. [DOI] [PubMed] [Google Scholar]
- 15.Rasineni K. R, Bellamkonda S. R, Singareddy Desireddy S. “Antihyperglycemic activity of Catharanthus roseus leaf powder in streptozotocin-induced diabetic rats.”. Pharmacognosy research. 2010;2(3):195. doi: 10.4103/0974-8490.65523. [DOI] [PMC free article] [PubMed] [Google Scholar]
- 16.Saltiel A. R, Kahn C. R. “Insulin signalling and the regulation of glucose and lipid metabolism.”. Nature. 2001;6865;414:799–806. doi: 10.1038/414799a. [DOI] [PubMed] [Google Scholar]
- 17.Shen B. M, Hagiwara Y.-Y, Yao Chao L, Chao J. “Salutary effect of kallistatin in salt-induced renal injury, inflammation, and fibrosis via antioxidative stress.”. Hypertension. 2008;51(5):1358–1365. doi: 10.1161/HYPERTENSIONAHA.107.108514. [DOI] [PubMed] [Google Scholar]
- 18.Sugimoto H. G, Grahovac M, Zeisberg Kalluri R. “Renal fibrosis and glomerulosclerosis in a new mouse model of diabetic nephropathy and its regression by bone morphogenic protein-7 and advanced glycation end product inhibitors.”. Diabetes. 2007;56(7):1825–1833. doi: 10.2337/db06-1226. [DOI] [PubMed] [Google Scholar]
- 19.Tavafi M. “Diabetic nephropathy and antioxidants.”. Journal of nephropathology. 2013;2(1):20–27. doi: 10.5812/nephropathol.9093. [DOI] [PMC free article] [PubMed] [Google Scholar]
- 20.Taylor Siragy A. H, Nesbitt S. “Angiotensin receptor blockers: pharmacology, efficacy and safety.”. J Clin Hypertens. 2011;13(9):677–686. doi: 10.1111/j.1751-7176.2011.00518.x. [DOI] [PMC free article] [PubMed] [Google Scholar]
- 21.World Health Organization. 2015 http://www.who.int/mediacentre/factsheets/fs312/en/
- 22.Trevisan R, Dodesini A. R, Lepore G. “Lipids and renal disease.”. Journal of the American Society of Nephrology. 2006;17(4 suppl 2):S145–S147. doi: 10.1681/ASN.2005121320. [DOI] [PubMed] [Google Scholar]
- 23.Van Wyk B.-E, Gericke N. People’s plants: A guide to useful plants of Southern Africa. Briza Publications; 2000. [Google Scholar]
- 24.Wyk B.-E. V, Wink M. “Medicinal plants of the world: an illustrated scientific guide to important medicinal plants and their uses.”. Portland: Timber; 2004. p. 480. [Google Scholar]