

Abstract
N6-Methyladenosine (m6A) is among the most common modifications in eukaryotic mRNA. The role of yeast m6A methyltransferase, Ime4, in meiosis and sporulation in diploid strains is very well studied, but its role in haploid strains has remained unknown. Here, with the help of an immunoblotting strategy and Ime4-GFP protein localization studies, we establish the physiological role of Ime4 in haploid cells. Our data showed that Ime4 epitranscriptionally regulates triacylglycerol metabolism and vacuolar morphology through the long-chain fatty acyl-CoA synthetase Faa1, independently of the RNA methylation complex (MIS complex). The MIS complex consists of the Ime4, Mum2, and Slz1 proteins. Our affinity enrichment strategy (methylated RNA immunoprecipitation assays) using m6A polyclonal antibodies coupled with mRNA isolation, quantitative real-time PCR, and standard PCR analyses confirmed the presence of m6A-modified FAA1 transcripts in haploid yeast cells. The term “epitranscriptional regulation” encompasses the RNA modification-mediated regulation of genes. Moreover, we demonstrate that the Aft2 transcription factor up-regulates FAA1 expression. Because the m6A methylation machinery is fundamentally conserved throughout eukaryotes, our findings will help advance the rapidly emerging field of RNA epitranscriptomics. The metabolic link identified here between m6A methylation and triacylglycerol metabolism via the Ime4 protein provides new insights into lipid metabolism and the pathophysiology of lipid-related metabolic disorders, such as obesity. Because the yeast vacuole is an analogue of the mammalian lysosome, our findings pave the way to better understand the role of m6A methylation in lysosome-related functions and diseases.
Keywords: protein acylation, RNA methylation, transcription regulation, triacylglycerol, vacuole, FAA1, IME4, MIS complex, MUM2, SLZ1
Introduction
Postsynthetic modifications of DNA, RNA, and proteins are common features of eukaryotes. Unlike for DNA and protein modifications, our knowledge of mRNA modifications is limited (1). N6-methyladenosine (m6A)3 is among the most common modifications known in eukaryotic mRNA (1, 2). N6-Adenosyl methyltransferases that introduce m6A modification in mRNA are found in almost all eukaryotes (2, 3). Because the m6A methylation machinery is fundamentally conserved throughout eukaryotes, Saccharomyces cerevisiae is used as a model organism to understand the physiological relevance of m6A methylation. In S. cerevisiae, Ime4 (inducer of meiosis 4) is a counterpart of mammalian N6-adenosyl methyltransferase (METTL3). According to cell type, the IME4 gene locus is transcribed into two different transcripts, the sense RNA (IME4) and the antisense RNA (RME2, regulator of meiosis 2). The role of Ime4 in meiosis and sporulation in diploid cells is very well studied (4, 5). The physiological significance of Ime4 in haploid cells is not known. In haploid cells, antisense RNA (noncoding RNA) transcription effectively reduces IME4 expression but does not completely abolish sense RNA (6, 7). A previous study showed that an extremely low level of sense RNA (IME4) transcripts is sufficient to perform its function (8). Therefore, in the present study, we have focused on the role of Ime4 in haploid cells.
Because meiotic cell cycle and sporulation do not occur in haploid cells, we studied the role of Ime4 in cell cycle- and sporulation-related phenotypes, lipid accumulation, and vacuolar morphology. During sporulation, an increase in cellular lipids has been observed (9, 10). The initial phase of sporulation is mainly associated with the synthesis of phospholipid and triacylglycerol (TAG), followed by the predominant synthesis of nonpolar lipids (10). Germinating spores possess a large amount of lipid granules (lipid droplets), which are used during the cell division cycles of vegetative growth (11). A recent study shows that a lack of TAG lipolysis delays bud development and cell cycle progression (12). Because it seems that TAG is metabolically linked with both the cell cycle and sporulation, we hypothesized a possible role of Ime4 in the TAG metabolism.
The yeast vacuole (analogue of the mammalian lysosome) is the main storage compartment and is also required for sporulation and osmotic homeostasis (13, 14). In S. cerevisiae, vacuolar proteases have been implicated in sporulation (15, 16). During sporulation, protein degradation by vacuolar proteinase A (PrA) and proteinase B (PrB) increases dramatically, and PrA- or PrB-defective mutants are found to be defective in sporulation (17). PrA-defective diploids do not undergo meiosis (18). A recent study showed that proteins involved in sporulation, meiotic recombination, and RNA metabolism play key roles in vacuole membrane fragmentation in S. cerevisiae (19). Keeping the above points in mind, we hypothesized a possible role of Ime4 in the determination of vacuolar morphology.
In this study, we establish the physiological relevance of Ime4 in haploid yeast cells. Our data showed that Ime4 epitranscriptionally regulates TAG metabolism and vacuolar morphology through its target gene FAA1. Additionally, this study demonstrates that the FAA1 gene is transcriptionally regulated by the Aft2 transcription factor. This work also establishes the role of Aft2 in TAG metabolism and vacuolar morphology through its target gene FAA1.
Results
Both diploid and haploid cells possess m6A-containing mRNA
The IME4 gene locus is transcribed into two different transcripts, sense RNA (IME4) and antisense RNA (RME2), based on cell type (Fig. 1A). In each cell type, there is a major transcript and a minor transcript. In diploids, IME4 is the major and RME2 is the minor transcript, whereas in haploids, RME2 is the major and IME4 the minor transcript (7). Our 3′-biased quantitative real-time PCR, as well as standard PCR, also showed a similar pattern of cell type–specific expression of sense and antisense transcripts (Fig. 1B). Because m6A-containing transcripts are not readily detectable by classic sequencing- or hybridization-based methodologies, to detect m6A containing transcripts, we used an immunoblotting strategy with an anti-m6A antibody, as reported earlier (20). To detect the presence of m6A-containing transcripts, we isolated total RNA from diploid and haploid cells and performed immunoblot analysis using the m6A polyclonal antibodies. The data showed the presence of m6A-modified transcripts in both diploid and haploid cells (Fig. 1C). Like the haploid WT cells, the ime4Δ cells also showed the presence of m6A-modified transcripts (Fig. 1D). This result could be due to the fact that the m6A antibodies detect any kind of m6A-modified nucleic acids (20). Therefore, to test for the presence of m6A-modified mRNA species, mRNA was isolated, and dot blot analysis was performed. The dot blot analysis of mRNA samples confirmed the presence of m6A-modified mRNA in both cell types (Fig. 1E). The m6A-modified mRNA species were absent in the ime4Δ cells (Fig. 1E). The affinity enrichment strategy using the m6A polyclonal antibodies coupled with re-isolation of mRNA followed by the dot blot assay also confirmed the presence of m6A-modified mRNA in both cell types (Fig. 1F). Together, these experiments suggested that like diploid cells, haploid cells also possess functional sense (IME4) transcripts.
Figure 1.
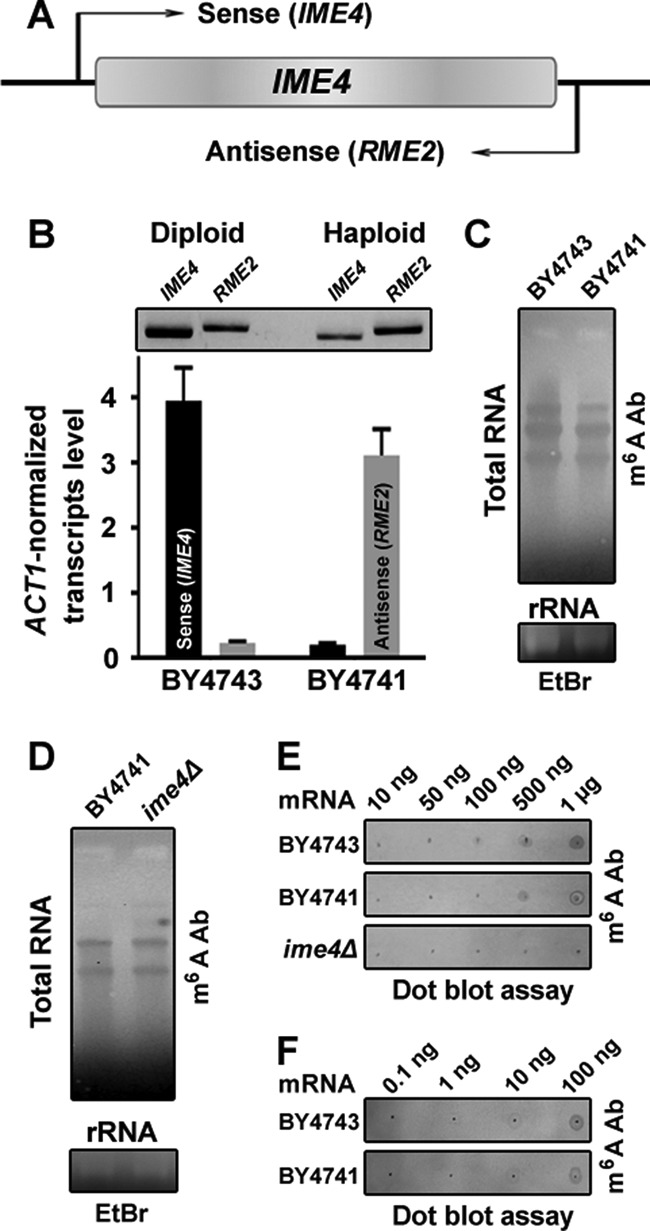
Distribution of m6A containing RNA in diploid and haploid yeast. A, schematic diagram illustrating the direction of the sense (IME4) and antisense (RME2) mRNA transcription. B, cell type–specific expression of the sense and antisense mRNA. Stationary phase–grown cells were collected for the quantitative real-time PCR and standard PCR analyses. Bottom, expression levels of the IME4 and RME2 transcripts were analyzed by quantitative real-time PCR using 3′-biased sense-specific or antisense-specific quantitative real-time PCR primers. Relative -fold change (ACT1-normalized) was calculated. The values are presented as the mean ± S.E. (error bars) (n = 3). Top, the presence of the sense and antisense mRNA in diploid (BY4743) and haploid (BY4741) strains was also confirmed by standard PCR using different sets of sense-specific or antisense-specific primers. C and D, distribution of m6A-containing RNA in the diploid and haploid cells. Top, total RNA isolated from the stationary phase-grown diploid and haploid cells was subjected to Northern blot analysis, and the immunoblot was developed with a m6A polyclonal antibody. Bottom, EtBr staining of the rRNA is shown as a loading control. E, dot blot assay for m6A-containing mRNA. The mRNA was isolated from the total RNA using oligo(dT) Dynabeads. Eluted mRNA was again passed through the oligo(dT) Dynabeads for mRNA isolation. Increasing amounts of mRNA from different genetic backgrounds were spotted onto a nylon membrane and probed with the m6A antibody. F, enrichment of m6A-containing transcripts by an MeRIP assay. The mRNA was isolated from the total RNA using oligo(dT) Dynabeads as mentioned above. An equal amount of mRNA from diploid and haploid backgrounds was subjected to the MeRIP assay with the m6A antibody. After washing, m6A antibody-bound transcripts were isolated using TRI reagent, and increasing amounts of mRNA were spotted onto a nylon membrane and probed with the m6A antibody. Ab, antibody. Representative blots are shown.
IME4 gene has a role in TAG metabolism
To validate the hypothesis that Ime4 may have a potential role in TAG metabolism, cells from different genetic backgrounds were grown in synthetic minimal medium (SM) containing [14C]acetate. The lipids extracted from the stationary-phase cells were resolved on a silica-TLC plate, followed by phosphorimaging. Compared with the WT strain, the ime4Δ strain showed a substantial increase (∼62%) in the total cellular lipid content (Fig. 2A). Compared with the WT strain, the ime4Δ strain showed a significant increase (∼39%) in the level of TAG + steryl esters (SE)/total lipids (Fig. 2B). Because eukaryotic cells store lipids mostly as TAG and SE in a specialized organelle of the cell called a lipid droplet, lipid particle, lipid body, or oil body (21), the accumulation of TAG and SE in the ime4Δ strain was validated by staining the lipid droplets (LDs) with BODIPYTM 493/503. To quantify the LDs, 100–200 cells from multiple fields of view were scored in each strain, and the number of LDs was represented by a box plot. The box plot analysis showed that compared with the WT strain, the majority of ime4Δ cells accumulated a large number of LDs/cell (Fig. 2C). A previous study showed that the methyltransferase motif IV of Ime4 is important for its function, and mutations (Asp-348 and Trp-351) in this motif severely affect Ime4 activity (5). Therefore, we also generated a mutant IME4 construct by site-directed mutagenesis. In the Ime4 mutant (Imut) protein, the predicted active amino acid residues Asp-348 and Trp-351 were replaced with Ala. IME4 overexpression caused a significant decrease (∼34%) in the TAG + SE/total lipid level, which was unaffected by IME4mut overexpression (Fig. 2D). These findings were validated by staining the LDs with BODIPYTM 493/503 (Fig. 2E). The box plot analysis showed that compared with the vector control, the majority of IME4-overexpressing cells contained few LDs/cell (Fig. 2E). Together, these studies suggested that the IME4 gene plays an important role in TAG metabolism.
Figure 2.

Effect of the IME4 gene on the lipid metabolism. A, effect of deletion of the IME4 gene on the total lipid content. The extracted lipids were resolved on a TLC plate, followed by phosphorimaging. Top, a representative TLC profile; bottom, relative quantification of the total lipids. FFA, free fatty acids. B and C, effect of the deletion of the IME4 gene on the TAG and SE levels and LD formation. D and E, effect of overexpression of the wild-type IME4 (I) and the mutant IME4 (Imut) on the TAG and SE levels and LD formation. V, BG1805 vector control; I, BG1805-IME4; Imut, BG1805-IME4mut. In the Ime4 mutant protein (Imut), the amino acids Asp and Trp of the catalytic motif were replaced by the amino acid Ala (A; shown in italic type). In each TLC analysis, the lipids were extracted from stationary-phase cells (A600 = 25) grown in the presence of [14C]acetate and were analyzed on a TLC plate followed by phosphorimaging. The amount of TAG + SE was determined relative to the total lipid content, and the obtained control value (mean, n = 3) was set to 100%. For LD staining, cells were harvested from the stationary phase; the LDs were stained with BODIPYTM 493/503 dye; and the confocal microscopic images were captured. To quantify the LDs, 100–200 cells from multiple fields of view were scored in each strain, and the number of LDs is represented by a box plot. Representative images are shown. Merged, superimposed panel of fluorescence and differential interference contrast (DIC); bar, 5 μm. The values are presented as the mean ± S.E. (error bars) (n = 3). Significance was determined at p < 0.05 (*) and p < 0.01 (**).
IME4 has an MIS complex-independent role in TAG metabolism
The literature shows that in S. cerevisiae, Ime4, Mum2, and Slz1 form a m6A methylation machinery named the MIS complex (4). Therefore, we also studied the role of the MUM2 and SLZ1 genes in TAG metabolism. TLC analyses and BODIPYTM 493/503 staining of the LDs showed that the MUM2 and SLZ1 genes had no significant effect on the TAG + SE/total lipid level or on LD formation (data not shown). Together, these studies suggested that the IME4 gene has a potential MIS complex–independent role in TAG metabolism. Reports show that Slz1 localizes the MIS complex machinery to the nucleolus, and this localization is crucial for mRNA methylation in diploid cells (1, 4). Therefore, to understand the MIS complex–independent role of Ime4, we first constructed Ime4-GFP– and Fob1-RFP–expressing plasmids. Fob1 is a nucleolus-localized protein. Like an earlier report (1), our study also showed the presence of the Ime4-GFP protein in the nucleolus as well as the cytoplasm (Fig. 3A). In addition, the localization study showed that the nucleolar localization of Ime4-GFP protein was independent of genetic background (Fig. 3A). Dot blot analysis of mRNA samples confirmed the presence of m6A-modified mRNA in the mum2Δ and slz1Δ strains (Fig. 3B). IME4 overexpression in the mum2Δ strain caused a significant decrease (∼50%) in the TAG + SE/total lipid level, which was validated by staining the LDs with BODIPYTM 493/503 (Fig. 3, C and D). IME4 overexpression in the slz1Δ strain caused a significant decrease (∼34%) in the TAG + SE/total lipid level, which was validated by staining the LDs with BODIPYTM 493/503 (Fig. 3, E and F). The box plot analysis showed that compared with the vector control, the majority of IME4-overexpressing cells contained few LDs/cell, and smaller LDs were also observed (Fig. 3, D and F). Together, these data suggested that Ime4 localizes to the nucleolus independently of other components of the MIS complex and performs its function.
Figure 3.

MIS complex–independent role of IME4 gene in TAG metabolism. A, Ime4-GFP localization in different genetic backgrounds. Stationary-phase cells expressing Ime4-GFP and Fob1-RFP proteins were imaged under a confocal microscope. As required, the optimum brightness and contrast were adjusted in the images. Representative images from two different areas (Area 1 and 2, two different fields of view) are shown. Merged, superimposed panel of fluorescence and DIC; bar, 5 μm; Ime4-GFP, pUG34-Ime4GFP; Fob1-RFP, pVT100U-Fob1RFP. B, dot blot assay for m6A-containing mRNA. Stationary phase–grown cells were collected for the dot blot assay. The mRNA was isolated from the total RNA using oligo(dT) Dynabeads. Eluted mRNA was again passed through the oligo(dT) Dynabeads for mRNA isolation. Increasing amounts of mRNA from different genetic backgrounds were spotted onto a nylon membrane and probed with the m6A antibody. C–F, effect of the overexpression of the IME4 gene on the TAG and SE levels and LD formation in different genetic backgrounds. V, BG1805 vector control; I, BG1805-IME4. In each TLC analysis, the lipids were extracted from the stationary-phase cells (A600 = 25) grown in the presence of [14C]acetate and were analyzed on a TLC plate followed by phosphorimaging. The amount of TAG + SE was determined relative to the total lipid content, and the obtained control value was set to 100%. For LD staining, cells were harvested from the stationary phase; the LDs were stained with BODIPYTM 493/503 dye; and confocal microscopic images were captured. To quantify the LDs, 100–200 cells from multiple fields of view were scored in each strain, and the number of LDs is represented by a box plot. Representative images are shown. Merged, superimposed panel of fluorescence and DIC; bar, 5 μm. The values are presented as the mean ± S.E. (error bars) (n = 3). Significance was determined at p < 0.05 (*).
IME4 gene regulates TAG biosynthesis through its target FAA1 gene
To understand the role of Ime4 in TAG accumulation at the molecular level, we examined the expression of the genes involved in TAG biosynthesis. In S. cerevisiae, TAG synthesis occurs through acyl-CoA-dependent (Dga1, Are1, and Are2) and acyl-CoA-independent (Lro1) acyltransferase activities (22). Furthermore, we also checked the expression of acyl-CoA synthetase genes (FAA1, FAA2, FAA3, and FAA4), which each supply the activated intermediate acyl-CoAs in acyl-CoA-dependent TAG synthesis (23). The expression analyses showed a significant increase in the expression of the DGA1, ARE1, and FAA1 genes upon IME4 gene deletion, whereas LRO1 expression was unaffected (Fig. 4A). Because the expression of the FAA1 gene was increased (4.19-fold) in the ime4Δ strain, and it has 3′-end–biased sites with the consensus methylation motif RGAC (where R represents A/G), we selected the FAA1 gene as a potential target of Ime4 and focused on this gene for further studies. Among four long-chain acyl-CoA synthetases of S. cerevisiae designated Faa1–Faa4, Faa1 is the major contributor, accounting for ≥90% of the activity in the total cell extract (23). Faa1 is the most important supplier of the acyl-CoA–dependent TAG biosynthetic pathway. Compared with the vector control, the overexpression of IME4 caused the down-regulation (4.76-fold) of FAA1 transcripts (Fig. 4B). The ime4Δ strain showed a significantly higher β-galactosidase activity of FAA1-lacZ (∼52%) than the WT, which was set at 100% (Fig. 4C). To detect m6A-containing FAA1 transcripts, a methylated RNA immunoprecipitation (MeRIP) assay was performed. The affinity enrichment strategy using the m6A polyclonal antibodies coupled with re-isolation of mRNA, quantitative real-time PCR, and standard PCR analyses using different sets of FAA1-specific primers confirmed the presence of m6A-modified FAA1 transcripts in both cell types (Fig. 4D).
Figure 4.

Identification of the IME4 gene target in the TAG biosynthesis. A, compared with the WT, an analysis of the expression of TAG biosynthetic genes in the ime4Δ strain. Cells were collected from the stationary phase, and gene expression analysis was performed. The horizontal dotted line represents the expression in the WT strain. The values are represented as -fold changes. B, effect of overexpression of the IME4 gene on the expression of the FAA1 gene. The horizontal dotted line represents the expression in the vector control strain. C, compared with the WT, β-galactosidase activity of FAA1-lacZ in the ime4Δ strain. Cells were collected from the log phase, and a β-galactosidase activity assay was performed. D, MeRIP assay for m6A-containing FAA1 transcripts. Cells were collected from the stationary phase, and the MeRIP assay was performed. The mRNA was isolated from the total RNA using oligo(dT) Dynabeads. Eluted mRNA was again passed through the fresh oligo(dT) Dynabeads for mRNA isolation. An equal amount of mRNA from different genetic backgrounds was subjected to the MeRIP assay with the rabbit IgG and m6A antibodies. After wash, m6A antibody-bound transcripts were isolated using TRI reagent and analyzed by quantitative real-time PCR using FAA1-specific quantitative real-time primers (bottom). Relative -fold enrichment (ACT1-normalized) was calculated. The presence of the methylated FAA1 transcript in diploid and haploid strains was also confirmed by standard PCR using a different set of FAA1-specific primers (top). E–H, effect of the FAA1 gene on the TAG and SE levels and on LD formation. V, BG1805 vector control; I, BG1805-IME4; F, BG1805-FAA1. In each TLC analysis, the lipids were extracted from the stationary-phase cells (A600 = 25) grown in the presence of [14C]acetate and were analyzed on a TLC plate followed by phosphorimaging. The amount of TAG + SE was determined relative to the total lipid content, and the obtained control value was set to 100%. For LD staining, cells were harvested from the stationary phase; the LDs were stained with BODIPYTM 493/503 dye; and the confocal microscopic images were captured. To quantify the LDs, 100–200 cells from multiple fields of view were scored in each strain, and the number of LDs is represented by a box plot. Representative images are shown. Merged, superimposed panel of fluorescence and DIC; bar, 5 μm. In Fig. 4, E and F, the values in the WT and ime4Δ panels were duplicated from Fig. 2, B and C, respectively, to generate the graphs. The values are presented as the mean ± S.E. (error bars) (n = 3). Significance was determined at p < 0.05 (*) and p < 0.01 (**).
To validate the role of FAA1 in TAG accumulation in the ime4Δ strain, we generated a double deletion strain, faa1Δime4Δ. Compared with the ime4Δ strain, deletion of the FAA1 gene from the ime4Δ genetic background caused a significant decrease (∼17%) in the TAG + SE/total lipid content (Fig. 4E). These findings were validated by staining the LDs with BODIPYTM 493/503 (Fig. 4F). The box plot analysis showed that compared with the ime4Δ cells, the majority of faa1Δime4Δ cells contained few LDs/cell (Fig. 4F). FAA1 overexpression in the WT strain caused a significant increase (∼31%) in the TAG + SE/total lipid level, which was validated by staining the LDs with BODIPYTM 493/503 (Fig. 4, G and H). The box plot analysis showed that compared with the vector control, the majority of FAA1-overexpressing cells accumulated a large number of LDs/cell (Fig. 4H). In short, these findings suggested that the IME4 gene regulates TAG biosynthesis through the Faa1 protein.
IME4 gene has a role in vacuolar morphology
To validate the hypothesis that Ime4 may have a potential role in the vacuolar morphology, stationary phase-grown cells were stained with FM4-64 dye and examined by confocal microscopy. Image analyses showed four different types of vacuoles, referred to here as type I (2–10 small vacuolar lobes), type II (more than 10 small vacuolar lobes), type III (small, discrete, and fragmented vacuolar lobes), and type IV (one grossly enlarged and 1–3 small vacuolar lobes) in the yeast (Fig. 5A). Compared with the WT strain, the ime4Δ strain showed a substantial decrease in the proportion of cells with type I vacuoles (Fig. 5A; ∼77% of cells in the WT strain; ∼15% of cells in the ime4Δ strain), whereas cells with type IV vacuoles were significantly increased in the ime4Δ strain (Fig. 5A; ∼12% of cells in the WT strain; ∼76% of cells in the ime4Δ strain). Type II vacuoles were completely absent in the ime4Δ strain, whereas there was no significant change in type III vacuoles (Fig. 5A). Because type IV vacuoles were significantly increased in the ime4Δ strain and a study shows that type IV vacuoles, a characteristic feature of the fab1Δ strain, are lipophagy-defective (24), we focused on the type IV vacuoles. First, we checked the lipophagy defect in the ime4Δ strain, and confocal microscopic study found the ime4Δ strain to be lipophagy-defective (Fig. 5B). Compared with the vector control, the cells overexpressing the IME4 gene showed a significant decrease (∼80%) in the proportion of cells with type IV vacuoles (Fig. 5C), which was unaffected by IME4mut overexpression (Fig. 5D). Confocal microscopic analyses of other members of the MIS complex showed that the MUM2 and SLZ1 genes had no significant effect on the type IV vacuoles (data not shown). Together, these studies suggested that Ime4 has an MIS complex-independent role in determining vacuolar morphology.
Figure 5.

Effect of IME4 gene on the vacuolar morphology. A, the effect of IME4 gene deletion on the vacuolar morphology. Equal amounts of cells (A600 = 5) from the stationary phase were collected and stained with FM4-64 dye. Images were taken under a confocal microscope. Four different types of vacuoles were observed (right). B, effect of the type IV vacuole on lipophagy. Stationary phase-grown cells in SM were collected, washed, and divided into two parts. One part was shifted to normal SM and another part to lipophagy-inducible medium (SM − N) for 8 h. Afterward, cells were collected, and vacuoles and LDs were stained with FM4-64 and BODIPYTM 493/503 dyes, respectively. Images were taken under a confocal microscope. Representative images are shown. The induction of lipophagy caused the internalization of LDs into vacuoles (indicated by arrows, WT strain), whereas type IV vacuoles were lipophagy-defective (ime4Δ strain). V, vacuole. C and D, effect of the overexpression of the wild-type IME4 (I) and the mutant IME4 (Imut) on the morphology of type IV vacuoles. Merged, superimposed panel of fluorescence and DIC; bar, 5 μm; V, BG1805 vector control; I, BG1805-IME4; Imut, BG1805-IME4mut. For quantification of vacuolar morphology, at least 200–300 cells were scored in each strain. Representative images are shown. Values are mean ± S.E. (error bars) (n = 3). Significance was determined at p < 0.01 (**).
To understand the role of the IME4 gene in vacuolar morphology at the molecular level, we examined the expression of the important genes related to the vacuolar morphology (25). Compared with the WT strain, expression analyses did not show any significant change in the transcript levels of FAB1, VAC7, VAC14, and FIG 4 in the ime4Δ strain (Fig. 6A). To validate the role of IME4 in vacuolar morphology, we generated double deletion strains, fab1Δime4Δ and fig 4Δime4Δ. The IME4 gene deletion from the fig 4Δ genetic background significantly affected the vacuolar morphology. Compared with the fig 4Δ strain, the fig 4Δime4Δ strain showed a substantial decrease in the proportion of cells with type I vacuoles (Fig. 6B; ∼83% of cells in the fig 4Δ strain; ∼14% of cells in the fig 4Δime4Δ strain), whereas the proportion of cells with type IV vacuoles was significantly increased in the fig 4Δime4Δ strain (Fig. 6B; ∼17% of cells in the fig 4Δ strain; ∼86% of cells in the fig 4Δime4Δ strain). Compared with the vector control, the fab1Δ cells overexpressing the IME4 gene showed a significant decrease (∼24%) in the proportion of cells with type IV vacuoles (Fig. 6C). The effect of the IME4 gene on the vacuolar morphology was also studied with the help of a scanning electron microscope (SEM). SEM micrographs showed that the IME4 gene deletion in the different genetic backgrounds increased the pitlike structures (type IV vacuoles), indicated by arrows, whereas overexpression of the IME4 gene reduced the pitlike structures (Fig. 6, D and E). Together, these data suggested that the IME4 gene has a role in the determination of vacuolar morphology that is independent of the FAB1-FIG 4 cycle (25). In S. cerevisiae, the phosphatidylinositol 3,5-bisphosphate level is regulated by the FAB1-FIG 4 cycle. Fab1 (kinase) and Fig. 4 (phosphatase) regulate the phosphatidylinositol 3,5-bisphosphate levels positively and negatively, respectively. Cells deficient in phosphatidylinositol 3,5-bisphosphate synthesis show a grossly enlarged vacuole morphology, whereas increased levels of phosphatidylinositol 3,5-bisphosphate trigger the formation of multiple small vacuoles (25).
Figure 6.

Effect of IME4 gene on the morphology of type IV vacuoles. A, compared with the WT, analysis of the expression of the genes related to type IV vacuoles in the ime4Δ strain. Cells were collected from the stationary phase, and gene expression analysis was performed. The horizontal dotted line represents expression in the WT strain. The values are represented as -fold changes. B, effect of IME4 gene deletion from the fab1Δ and fig 4Δ genetic backgrounds on the morphology of type IV vacuoles. C, effect of overexpression of IME4 on the morphology of type IV vacuoles in the fab1Δ strain. In each case, cells were collected from the stationary phase, and vacuoles were stained with FM4-64 dye. Merged, superimposed panel of fluorescence and DIC; bar, 5 μm; V, BG1805 vector control; I, BG1805-IME4. For quantification of vacuolar morphology, at least 200–300 cells were scored in each strain. Representative images are shown. D, effect of the deletion of the IME4 gene on type IV vacuolar morphology in the different genetic backgrounds. Representative SEM micrographs and vacuoles (pitlike structure indicated by arrows) are shown. E, effect of overexpression of the IME4 gene on type IV vacuolar morphology in the different genetic backgrounds. A magnification of ×10,000 was used to generate the SEM micrographs. Values are mean ± S.E. (error bars) (n = 3). Significance was determined at p < 0.05 (*) and p < 0.01 (**); ns, not significant.
IME4 gene regulates vacuolar morphology through its target FAA1 gene
Because the expression of the FAA1 gene was increased (4.19-fold) in the ime4Δ strain, and Faa1 is the major contributor of long-chain acyl-CoA synthetase activity, we predicted a possible role of Faa1 in the type IV vacuolar morphology. The literature shows that the vacuolar membrane protein Vac8 requires a myristoylation site and three palmitoylation sites to be anchored to vacuoles, and moreover, palmitoylation governs the Vac8 vacuolar functions (26, 27). The Vac8 protein is required for efficient cytosol-to-vacuole trafficking, nucleus-vacuole junction formation, vacuole inheritance, vacuole fusion, and sporulation (26). The efficiency of protein acylation appears to be governed by the availability of acyl-CoA substrates, such as myristoyl-CoA and palmitoyl-CoA, and the Faa1 protein preferentially provides acyl-CoA substrates with C12:0–C16:0 (23). Therefore, we hypothesized that Faa1 and Vac8 together may regulate the type IV vacuolar morphology (Fig. 7A). To validate our hypothesis, the effect of FAA1 gene deletion from the ime4Δ strain on the morphology of type IV vacuoles was studied. Compared with the ime4Δ strain, the faa1Δime4Δ strain showed a substantial decrease (∼50%) in the proportion of cells with type IV vacuoles (Fig. 7B). The effect of overexpression of the FAA1 gene on the type IV vacuolar morphology in different genetic backgrounds was also studied. Compared with the vector control, the WT and fig 4Δ cells overexpressing the FAA1 gene showed a significant increase in the proportion of cells with type IV vacuoles (Fig. 7C). Additionally, compared with the vector control (∼16%), the ime4Δ cells overexpressing the FAA1 gene showed a significant increase (∼44%) in the proportion of cells with vacuole diameter ≥4 μm (Fig. 7D). Together, these data suggested that the FAA1 gene has a role in the determination of the type IV vacuolar morphology.
Figure 7.

Effect of FAA1 and VAC8 genes on the vacuolar morphology. A, schematic diagram representing the putative roles of the FAA1 and VAC8 genes in the vacuolar morphology. B, effect of FAA1 gene deletion from the ime4Δ strain on the morphology of type IV vacuoles. Equal amounts of cells (A600 = 5) from the stationary phase were collected and stained with FM4-64 dye. Images were taken under a confocal microscope. C and D, the effect of overexpression of the FAA1 gene on the vacuolar morphology in different genetic backgrounds. E, compared with the WT, analysis of the expression of the VAC8 gene in the ime4Δ strain. Cells were collected from the stationary phase, and gene expression analysis was performed. The horizontal dotted line represents expression in the WT strain. The deletion strain value is represented as -fold change. F and G, effect of overexpression of VAC8-GFP on the vacuolar morphology in different genetic backgrounds. As required, the optimum brightness and contrast were adjusted in the images. H, effect of overexpression of the FAA1 gene on the vacuolar morphology in the vac8Δ strain. In each case, cells were collected from the stationary phase. Merged, superimposed panel of fluorescence and DIC; bar, 5 μm; V, BG1805 vector control; F, BG1805-FAA1; VG, pVT100U-VAC8-GFP. For quantification of vacuolar morphology, at least 200–300 cells were scored in each strain. Representative images are shown. Values are mean ± S.E. (error bars) (n = 3). Significance was determined at p < 0.05 (*) and p < 0.01 (**); ns, not significant.
To understand the role of the VAC8 gene in relation to the type IV vacuolar morphology at the molecular level, we examined the expression of the VAC8 gene in the ime4Δ strain. Compared with the WT strain, expression analyses did not show any significant change in the transcript level of VAC8 in the ime4Δ strain (Fig. 7E). Further, we studied the effect of the overexpression of Vac8-GFP on the vacuolar morphology in different genetic backgrounds. The cells overexpressing Vac8-GFP showed a significant increase in the proportion of cells with type IV vacuoles (Fig. 7, F and G). Additionally, overexpression of the Vac8-GFP in the vac8Δ strain caused a substantial decrease in the proportion of cells with type II vacuoles, a characteristic feature of the vac8Δ strain (Fig. 7, F and G). To validate the hypothesis that Faa1 and Vac8 together may regulate the vacuolar morphology, the effect of overexpression of the FAA1 gene on the vacuolar morphology in the vac8Δ strain was studied. The vac8Δ cells overexpressing the FAA1 gene did not show any significant change in vacuolar morphology, and the type II vacuoles of the vac8Δ strain remained unchanged (Fig. 7H). Briefly, these findings suggested that Faa1 and Vac8 together may regulate the vacuolar morphology.
AFT2 transcriptionally regulates FAA1 gene
To identify the potential transcription factor that has its putative binding site in the promoter region (upstream) of the FAA1 gene, we explored the Yeastract promoter database of S. cerevisiae. A targeted search within the promoter region gave us several transcription factors. We found that of these transcription factors, Aft2 had a probable role both in TAG metabolism (as the binding site for FAA1; Fig. 8A) and in vacuolar functions (28). Additionally, a study reports that Ime4 and Aft1 (a paralog of Aft2) show negative genetic interaction (29). Therefore, we selected the Aft2 transcription factor for further studies, hypothesizing that a single transcription factor (Aft2) may regulate both TAG metabolism and vacuolar morphology. First, we checked the effect of the IME4 gene on the expression of the AFT2 gene. IME4 deletion caused an increase (2.48-fold) in the AFT2 transcript level, whereas IME4 overexpression caused the down-regulation (3.7-fold) of AFT2 transcripts (Fig. 8, B and C). Furthermore, we checked the effect of the AFT2 gene on the expression of the FAA1 gene. AFT2 deletion caused a decrease (2.22-fold) in the FAA1 transcript level, whereas AFT2 overexpression caused the up-regulation (5.39-fold) of FAA1 transcripts (Fig. 8, D and E). The aft2Δ strain showed significantly lower β-galactosidase activity of FAA1-lacZ (∼38%) than the WT, which was set at 100% (Fig. 8F).
Figure 8.

Regulation of the FAA1 gene by the AFT2 transcription factor. A, schematic diagram of the FAA1 promoter representing the Aft2 binding site and sequence. B, compared with the WT, an analysis of the expression of the AFT2 gene in the ime4Δ strain. C, compared with the vector control, the effect of overexpression of the IME4 gene on the transcript level of the AFT2 gene. V, BG1805 vector control; I, BG1805-IME4. D, compared with the WT, an analysis of the expression of the FAA1 gene in the aft2Δ strain. E, compared with the vector control, the effect of overexpression of the AFT2 gene on the transcript level of the FAA1 gene. A, BG1805-AFT2. In each case of transcript analysis, cells were collected from the stationary phase. The horizontal dotted line in the graph represents the expression in the control strain. The values are represented as -fold changes. F, compared with the WT, β-galactosidase activity of FAA1-lacZ in the aft2Δ strain. Cells were collected from the log phase, and a β-galactosidase activity assay was performed. G, association of the Aft2 protein with the FAA1 promoter. Transformant (BG1805-AFT2) overexpressing the Aft2 protein from the stationary phase was subjected to ChIP assays with anti-HA and anti-RFP antibodies. The occupancy of Aft2 protein on the FAA1 promoter was shown by PCR analyses of the IN, IP, and CIP DNA using FAA1 promoter-specific primers. The Aft2 element-deficient LPP1 promoter region was used as a negative control (negative immunoprecipitation (NIP)). Relative -fold enrichment (arbitrary units) in the ChIP assay was calculated using the formula indicated (top). H, association of the Aft2 protein with the FAA1 promoter. Transformant (BG1805-AFT2) overexpressing the Aft2 protein from the stationary phase was subjected to qChIP assays with anti-HA and anti-RFP antibodies. The occupancy of Aft2 protein on the FAA1 promoter was shown by quantitative real-time PCR analysis of the IP and CIP DNA using a different set of FAA1 promoter-specific primers. Relative -fold enrichment of IP value in the qChIP assay was normalized by the CIP value. In each case, the values are presented as the mean ± S.E. (error bars) (n = 3). Significance was determined at p < 0.05 (*) and p < 0.01 (**).
To assess the transcriptional regulation of the FAA1 gene by Aft2, ChIP assays were conducted as reported earlier (30). The ChIP assays revealed that the Aft2 transcription factor occupied the FAA1 promoter (Fig. 8G), which was validated by quantitative ChIP (qChIP) assays (Fig. 8H). Together, the data from the expression analyses, ChIP assays, and qChIP assays suggested that Aft2 positively regulates the FAA1 gene.
AFT2 regulates TAG biosynthesis and vacuolar morphology through its target FAA1 gene
Because the expression of the FAA1 gene was controlled by the Aft2 transcription factor, we examined the role of Aft2 in TAG biosynthesis as well as in type IV vacuolar morphology. AFT2 deletion did not cause a significant change in the TAG + SE/total lipid content (Fig. 9A), which was validated by staining the LDs with BODIPYTM 493/503 (Fig. 9B). AFT2 overexpression in the aft2Δ strain caused a significant increase (∼86%) in the TAG + SE/total lipid level, which was validated by staining the LDs with BODIPYTM 493/503 (Fig. 9, C and D). The box plot analysis showed that compared with the vector control, the majority of AFT2-overexpressing aft2Δ cells accumulated a large number of LDs/cell (Fig. 9D). AFT2 overexpression in the ime4Δ strain caused a significant increase (∼37%) in the TAG + SE/total lipid level, which was validated by staining the LDs with BODIPYTM 493/503 (Fig. 9, E and F). The box plot analysis showed that compared with the vector control, the majority of AFT2-overexpressing ime4Δ cells accumulated a large number of LDs/cell (Fig. 9F). Additionally, compared with the vector control (1.14%), the aft2Δ cells overexpressing the AFT2 gene showed a significant increase (8.89%) in the proportion of cells with LD diameter ≥1 μm (Fig. 9G). AFT2 overexpression also caused the formation of indistinguishable large and clustered LDs, referred to here as large/clustered LDs. Compared with the vector control (6.57%), the aft2Δ cells overexpressing the AFT2 gene showed a significant increase (12.75%) in the proportion of cells with large/clustered LDs (Fig. 9H). Briefly, these findings suggested that the AFT2 gene positively regulates TAG biosynthesis.
Figure 9.

Role of AFT2 gene related to TAG metabolism and vacuolar morphology. A and B, effect of the deletion of the AFT2 gene on the TAG and SE levels and on LD formation. C–F, effect of the overexpression of the AFT2 gene on the TAG and SE levels and on LD formation in different genetic backgrounds. G, effect of AFT2 overexpression on the size of LDs. H, cells with large/clustered LDs. Indistinguishable LDs are represented as large/clustered LDs (as indicated in the inset). In each TLC analysis, the lipids were extracted from stationary-phase cells (A600 = 25) grown in the presence of [14C]acetate and were analyzed on a TLC plate, followed by phosphorimaging. The amount of TAG + SE was determined relative to the total lipid content, and the obtained control value was set to 100%. For LD staining, cells were harvested from the stationary phase; the LDs were stained with BODIPYTM 493/503 dye; and the confocal microscopic images were captured. To quantify the LDs, 100–200 cells from multiple fields of view were scored in each strain, and the number of LDs is represented by a box plot. Representative images are shown. Bar, 5 μm. In B and F, the values in the WT and vector control panels were duplicated from Fig. 2, C and E, respectively, to generate the graphs. I, effect of AFT2 gene deletion on the vacuolar morphology. Equal amounts of cells (A600 = 5) from the stationary phase were collected and stained with FM4-64 dye. Images were taken under a confocal microscope. In I, the values in the WT panel were duplicated from Fig. 5A to generate the graph. J, effect of overexpression of the AFT2 gene on the morphology of type IV vacuoles in the aft2Δ strain. K, effect of overexpression of the AFT2 gene on the size of the vacuoles in the ime4Δ and fab1Δ strains. Merged, superimposed panel of fluorescence and DIC; bar, 5 μm; V, BG1805 vector control; A, BG1805-AFT2. For quantification of vacuolar morphology, at least 200–300 cells were scored in each strain. Representative images are shown. Values are mean ± S.E. (error bars) (n = 3). Significance was determined at p < 0.05 (*) and p < 0.01 (**).
The role of the AFT2 gene in the determination of type IV vacuolar morphology was also studied. Compared with the WT strain, the aft2Δ strain did not show a substantial change in vacuolar morphology (Fig. 9I). Compared with the vector control, the aft2Δ cells overexpressing the AFT2 gene showed a significant increase in the proportion of cells with type IV vacuoles (Fig. 9J). The effect of overexpression of the AFT2 gene on the diameter of vacuoles in the ime4Δ and fab1Δ genetic backgrounds was also studied. Compared with the vector control, the ime4Δ and fab1Δ cells overexpressing the AFT2 gene showed a significant increase in the proportion of cells with vacuole diameter ≥4 μm (Fig. 9K; ∼16% of cells in ime4Δ+V; ∼46% of cells in ime4Δ+AFT2; ∼13% of cells in fab1Δ+V; ∼31% of cells in fab1Δ+AFT2). Together, our findings suggested that AFT2 and IME4 genes regulate TAG biosynthesis and type IV vacuolar morphology through a common target gene, FAA1, at the transcriptional and epitranscriptional levels, respectively.
Discussion
In this work, we demonstrate the physiological relevance of Ime4 in haploid yeast cells. Because the physiological significance of Ime4 in haploid cells was not known, we studied its role in haploid cells. Standard PCR analyses and 3′-biased quantitative real-time PCR were performed to confirm the presence of complete sense and antisense transcripts. Anti-m6A antibody-based immunoblotting strategies were used to confirm the presence of m6A-modified mRNA and the functional role of sense (IME4) transcripts in the haploid cells.
The role of the IME4 gene in meiosis and sporulation in diploid cells is very well studied. Because the meiotic cell cycle and sporulation do not occur in haploid cells, we studied the role of Ime4 in the cell cycle- and sporulation-related phenotypes, lipid accumulation, and vacuolar morphology. During sporulation, an increase in total lipids followed by predominant synthesis of nonpolar lipids (TAG and SE) has been reported (10). TAG lipolysis is required for spore germination (11), bud development, and cell cycle progression (12). Because it seems that TAG is metabolically linked with both the cell cycle and sporulation, we hypothesized a possible role of Ime4 in the TAG metabolism.
In yeast, lipid biosynthesis is a growth phase–dependent process, and nonpolar lipid synthesis is a characteristic feature of the stationary growth phase (22). Therefore, in this study, to understand the role of Ime4 in TAG metabolism, cells were harvested from the stationary phase. Site-directed mutagenesis, Ime4-GFP localization, and anti-m6A antibody–based immunoblotting studies in different genetic backgrounds showed that Ime4 epitranscriptionally regulates TAG metabolism, independently of the MIS complex. A previous study showed that during vegetative growth, the production of IME4 sense transcripts is enhanced in the late-log phase cultures, and the sense transcription is repressed by glucose (7). The above findings also suggest that Ime4 has stationary phase–related functions when glucose is exhausted.
Furthermore, in S. cerevisiae, TAG synthesis occurs through both acyl-CoA-dependent (Dga1, Are1, and Are2) and acyl-CoA-independent (Lro1) acyltransferase activities (22). Our data showed that the DGA1, ARE1, and FAA1 genes involved in the acyl-CoA-dependent acyltransferase pathway of TAG biosynthesis were up-regulated upon IME4 gene deletion. On the other hand, the expression of the LRO1 gene (acyl-CoA-independent acyltransferase) was unaffected. These results were not surprising, because the stationary phase-grown cells exhibit more Dga1 activity than Lro1 activity (22). The FAA1 gene has a 3′-end-biased consensus methylation motif, and Faa1 is the most important supplier of the acyl-CoA-dependent TAG biosynthetic pathway. Therefore, we selected the FAA1 gene as a potential target of Ime4 and focused on this gene for further studies. Our data showed that Ime4 epitranscriptionally regulates TAG metabolism through its target gene FAA1. Additionally, the increase in the TAG and SE levels can be attributed to the up-regulation of the DGA1 and ARE1 genes in the ime4Δ strain.
The yeast vacuole is required for sporulation, and vacuolar proteinase-defective diploids do not undergo meiosis (14, 18). The proteins involved in sporulation, meiotic recombination, and RNA metabolism play a key role in vacuole membrane fragmentation in S. cerevisiae (19). Therefore, keeping the above points in mind, we hypothesized a possible role of Ime4 in determining the vacuolar morphology. Our data showed that IME4 gene has a role in determining vacuolar morphology and that IME4 gene deletion produces a lipophagy-defective type IV vacuole, which is independent of the well-studied FAB1-FIG 4 cycle. Additionally, this study suggests that the fatty acyl–CoA synthetase Faa1 and the vacuolar protein Vac8 may function in the same pathway of vacuolar fusion. Recently, Cadou and Mayer4 showed that fatty acids and the Faa1 protein accumulate at nucleus–vacuole junctions (NVJs), which are formed by the interaction of Nvj1 (ER protein) and the Vac8 protein. Exponential phase–growing yeast cells do not have many NVJs, but entry into the stationary phase triggers the distribution of the NVJs (32). The above findings also suggest that the Faa1 and Vac8 proteins may function together in the same pathway of vacuolar fusion, which needs to be studied further.
To identify the transcription factor that has a putative binding site in the promoter region of the FAA1 gene, we performed an in silico analysis and hypothesized that the Aft2 transcription factor alone might regulate both TAG metabolism and vacuolar morphology. Our data showed that the Aft2 transcription factor positively regulates FAA1 expression. Expression analyses, lipid profiling, and vacuolar morphology–related studies establish the role of the Aft2 transcription factor in TAG metabolism and vacuolar morphology through its target gene FAA1. Thus, our entire study can be summarized as follows. The AFT2 and IME4 genes regulate TAG biosynthesis and vacuolar morphology through a common target FAA1 gene at the transcriptional and epitranscriptional levels, respectively. We also propose a model for the MIS complex-independent role of Ime4 in TAG metabolism and vacuolar morphology (Fig. 10, A and B). The concept of different kinds of m6A readers is based on a model proposed recently (2).
Figure 10.
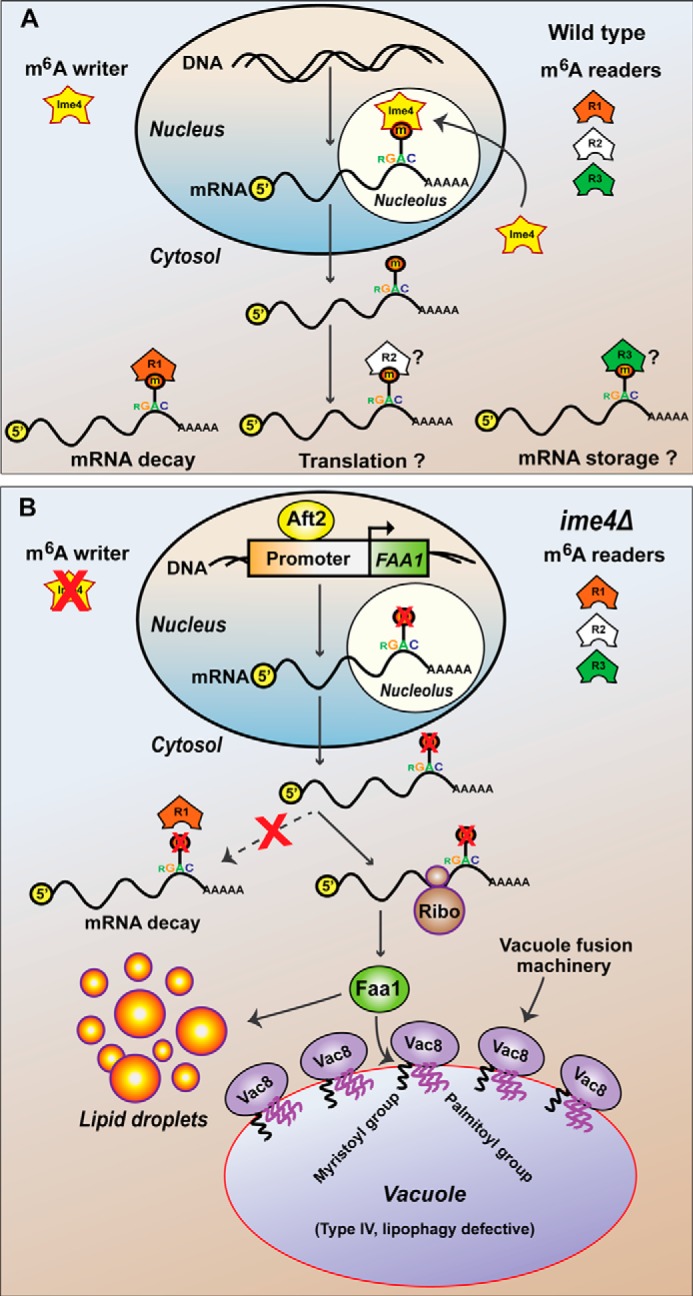
Epitranscriptional and transcriptional regulation of TAG metabolism and vacuolar morphology. A, putative MIS complex-independent role of Ime4 in m6A methylation and possible fate of the methylated mRNAs. We propose that Ime4 (independently of its partner proteins) enters the nucleolus and performs its mRNA methylation activity. The methylated mRNAs are read by the cytosolic m6A readers, and the fate of methylated mRNAs depends on the kind of reader. B, schematic model of the proposed role of the IME4, AFT2, FAA1, and VAC8 genes in yeast. We propose that the FAA1 gene is transcriptionally and epitranscriptionally regulated by Aft2 and Ime4, respectively. Ime4 and Aft2 regulate TAG metabolism and vacuolar morphology through Faa1. Faa1 provides acyl-CoAs, which are required for lipid biosynthesis as well as to anchor Vac8 in the vacuolar membrane. Vac8 is responsible for the recruitment of vacuolar fusion machinery onto the vacuolar membrane, leading to the formation of a large vacuole (type IV, lipophagy-defective). Ribo, ribosome.
Because the m6A methylation machinery is fundamentally conserved throughout eukaryotes (from yeast to mammals), our findings will be useful to understand the physiological relevance of m6A methylation. Additionally, the finding of the MIS complex-independent role of Ime4 will pave the way to advance the rapidly emerging field of RNA epitranscriptomics (33). Furthermore, in obese people, TAG accumulation in nonadipose tissue, as well as defective intracellular lipid distribution, leads to medical complications, including type 2 diabetes, hypertension, and heart failure (34, 35). The acyl-CoA-dependent pathway is fundamentally conserved throughout eukaryotes (22). Therefore, this study of the metabolic link between m6A methylation and TAG metabolism via the Ime4 protein will provide new insights into lipid metabolism and the pathophysiology of lipid-related metabolic disorders (such as obesity). In addition, the yeast vacuole is an analogue of the mammalian lysosome. Therefore, it will be interesting to study the role of m6A methylation in lysosome-related functions and diseases.
Experimental procedures
Materials
The [14C]acetate was purchased from BRIT/BARC (Board of Radiation and Isotope Technology, Navi Mumbai, India). The enzymes for cloning were obtained from New England Biolabs. The protein molecular mass marker was procured from Genetix Biotech Asia Pvt. Ltd. The TLC plates were purchased from Merck. The BODIPYTM 493/503 and FM4-64 dyes were purchased from Life Technologies. For the quantitative real-time PCR analyses, the materials were procured from Applied Biosystems. The materials used in YPD (yeast extract peptone dextrose) and LB (Luria-Bertani) media were procured from HiMedia. YNB (yeast nitrogen base) was purchased from Difco. The yeast transformation kit was procured from Clontech. The yeast synthetic drop-out medium, glass beads, oligonucleotides, antibiotics, antibodies (H1029 and A3562), and other materials were procured from Sigma-Aldrich unless mentioned otherwise.
Strains, plasmids, and growth conditions
The bacterial and yeast strains used in this work are listed in Table 1. The yeast deletion strains were procured from Euroscarf. The double deletion strains were generated using a PCR-based gene deletion protocol (36). The deletion cassette, spanning the whole marker cassette plus both the upstream and downstream homologous regions of the targeted gene, was amplified by PCR from the YEp351 (LEU2) vector. Yeast cells on SM agar plates without the amino acid leucine were transformed to produce the double deletion strains by homologous recombination. The positive double mutants were confirmed by PCR using different sets of screening primers. The primers used for the creation of the double mutants and the screening are listed in Table 2.
Table 1.
Strains used in this study
| Strains | Genotypic description | Source |
|---|---|---|
| Escherichia coli | ||
| DH5α | F− φ80dlacZΔM15Δ (lacZYA-argF)U169 deoR recA1 endA1 hsdR17 (rk− mk+) phoA supE44 λ−thi-1 gyrA96 relA1 | Invitrogen |
| S. cerevisiae | ||
| BY4743 | MATa/α; his3Δ1/his3Δ1; leu2Δ0/leu2Δ0; LYS2/lys2Δ; met15Δ0/MET15; ura3Δ0/ura3Δ0 | Euroscarf |
| BY4741 | MATa; his3Δ1; leu2Δ0; met15Δ0; ura3Δ0 | Euroscarf |
| ime4Δ | BY4741; Mat a; his3Δ1; leu2Δ0; met15Δ0; ura3Δ0; YGL192w::kanMX4 | Euroscarf |
| mum2Δ | BY4741; Mat a; his3Δ1; leu2Δ0; met15Δ0; ura3Δ0; YBR057c::kanMX4 | Euroscarf |
| slz1Δ | BY4741; Mat a; his3Δ1; leu2Δ0; met15Δ0; ura3Δ0; YNL196c::kanMX4 | Euroscarf |
| fab1Δ | BY4741; Mat a; his3Δ1; leu2Δ0; met15Δ0; ura3Δ0; YFR019w::kanMX4 | Euroscarf |
| fig4Δ | BY4741; Mat a; his3Δ1; leu2Δ0; met15Δ0; ura3Δ0; YNL325c::kanMX4 | Euroscarf |
| vac8Δ | BY4741; Mat a; his3Δ1; leu2Δ0; met15Δ0; ura3Δ0; YEL013w::kanMX4 | Euroscarf |
| aft2Δ | BY4741; Mat a; his3Δ1; leu2Δ0; met15Δ0; ura3Δ0; YPL202c::kanMX4 | Euroscarf |
| faa1Δime4Δ | BY4741; Mat a; his3Δ1; leu2Δ0; met15Δ0; ura3Δ0; YGL192w::kanMX4; faa1Δ::LEU2 | This study |
| fab1Δime4Δ | BY4741; Mat a; his3Δ1; leu2Δ0; met15Δ0; ura3Δ0; YFR019w::kanMX4; ime4Δ::LEU2 | This study |
| fig4Δime4Δ | BY4741; Mat a; his3Δ1; leu2Δ0; met15Δ0; ura3Δ0; YNL325c::kanMX4; ime4Δ::LEU2 | This study |
Table 2.
Primers used in this study
qRT, quantitative real-time PCR; qRT3′, 3′-biased quantitative real-time PCR; SDM, site-directed mutagenesis; p, promoter; d, deletion; F, forward; M, middle; R, reverse; Sp, screening primer.
| Primer no. | Gene | Forward primer | Reverse primer |
|---|---|---|---|
| 1 | ACT1 (qRT) | ACTTTCAACGTTCCAGCCTTCT | ACACCATCACCGGAATCCAA |
| 2 | IME4 (qRT3′) | CATCGGAAACCAGTTGACAGG | TACCAGTGTGGCTGGTTCCA |
| 3 | RME2 (qRT3′) | CCCCAATGCTAACTTATATGGTCC | AAGATCTCCCCGGCATTCTG |
| 4 | DGA1 (qRT) | TGACTATCGCAACCAGGAATGT | AACGCACCAAGTGCTCCTATG |
| 5 | ARE1 (qRT) | TGTTCCCCGTCCTCGTGTA | CGCACACCTTCTCCAACACA |
| 6 | ARE2 (qRT) | GCAACTCACCAGCCAATGAA | ATGCGACGTCTCCGTTTGA |
| 7 | FAA1 (qRT) | CTCCAATCAGTCGGGATGCT | ATGTCTCGGTTAAACCGTAACCA |
| 8 | FAA2 (qRT) | TCATGACGAGCTCCGTATGC | CTTGTTCTACCTGCTCCAATGAAA |
| 9 | FAA3 (qRT) | TAGAGTCAAGAAGCGGCCCTTA | CATCTCGTTTTCCACCCTTGTT |
| 10 | FAA4 (qRT) | CCCATCGAAAAAACATGGTTGTA | ATCAGCCCACGTCCAATGTC |
| 11 | LRO1 (qRT) | CGTACAACCCTGCCGCCGGAAT | GTCTACGTGTTCGGCGCTTT |
| 12 | FAB1 (qRT) | ATGCAGAATTCCTATGCGCG | AGGGATGCGGTCAACGAAG |
| 13 | FIG4 (qRT) | TCGTGGCTCAATCCCCTTAT | CAGCCGGAGAAAAAAATGGA |
| 14 | VAC7 (qRT) | AACAGCGAGATCGGCGAATA | TAGTGCTGGGTGCCGTGTTA |
| 15 | VAC14 (qRT) | GCTTGGAAGTTTTTTGGACGG | TGGGAGATTCCATCTCCTCG |
| 16 | VAC8 (qRT) | ATTGAAGCATGGGATCGTCC | ATTGTCCATAGCGCAATGTGTT |
| 17 | AFT2 (qRT) | CAACCAAGGCCTGATGGAACT | TGCTTTGTGACAAGGGCCTC |
| 18 | IME4 (PCR) | CCGCTTTCTGGACAGCTCAA | TACCAGTGTGGCTGGTTCCA |
| 19 | RME2 (PCR) | AAACTCCTGGTACTTCCTCTCGAC | AAGATCTCCCCGGCATTCTG |
| 20 | FAA1 (PCR) | TACGCAGCCACTTCTCACAAGT | AGGCCCCCCAATAAAAGGAC |
| 21 | IME4mut (SDM) | TCGGTAGTTATTGCAGCTCCTGCAGCGAATATCCATATG | CATATGGATATTCGCTGCAGGAGCTGCAATAACTACCGA |
| 22 | FAA1p (YEp) | CGGGTACCATTTATTTTTTTTTCTAGGA | ATCTGCAGAGCAACCATATTGTTGTCTTTT |
| 23 | FAA1p (ChIP) | TGGATGATGCAGCCCTGTCATATTCT | AGATCTCCAAACATTTTTGTTGTAATATCG |
| 24 | LPP1p (ChIP) | TAAAAAACAAAAAATAATGGAATCAACCAACC | CCTTGGTAGAATATGACGAGTTTCCTTAGGC |
| 25 | FAA1p (qChIP) | AGGAACATGATCTCCGCCATGTGAA | ACGCGCGAGAACAGCCTATCTCTG |
| 26 | IME4 (GFP) | CGGAATTCATGATTAACGATAAACTAGTACA | AGGCTCGAGTTACTGAGCAAAATATAGGTT |
| 27 | FOB1 (RFP) | CGAAGCTTATGACGAAACCGCGTTACA | GACGTCCTCGGAGGAGGCCATCAATTCCATTGATGTGCCAAAGT |
| 28 | RFP | ATGGCCTCCTCCGAGGACGTCATCA | GGCTCGAGTTAGGCGCCGGTGGAGTG |
| 29 | VAC8 (GFP) | GGAAGCTTATGGGTTCATGTTGTAGTTGCTTG | GCGGTACCATGTAAAAATTGTAAAATCTGTTG |
| 30 | FAA1d (LEU2) | TAGGATACAATAAAAACTAGAACAAACACAAAAGACAAAAAAAGACAACAATATGAACTGTGGGAATACT | GAAAAAGTGCTTTAGTATGATGAGGCTTTCCTATCATGGAAATGTTGATCCATTACAAATTAGGGATTCG |
| 31 | LEU2 cassette | ATATTCTAGAAACTGTGGGAATACTCAGGTATCG | ATATGTCGACCAAATTAGGGATTCGTAGTTTCATGATTTTCTG |
| 32 | FAA1 5′ FSp | CATATCAGGAGAACTTCCCTGTGCATACG | |
| 33 | LEU2 M RSp | CCAAATGCGGTGTTCTTGTCTGGCAAAGAG | |
| 34 | LEU2 M FSp | CTCTTTGCCAGACAAGAACACCGCATTT | |
| 35 | FAA1 3′ RSp | ACGAACATACGTGAATGAGGTGATATGACT | |
| 36 | FAA1 M Sp | TACGCAGCCACTTCTCACAAGT | AGGCCCCCCAATAAAAGGAC |
| 37 | IME4d (LEU2) | ATTGGCATTCAGACTTGAATTCATAAAAGTTGTAAGCAGGCTATGAACTGTGGGAATACTCAGG | GTTTTTGTTGCTGTTTGGATTCAAAGGGAGTATGTTTTTGATTCACAAATTAGGGATTCGTAGTTTC |
| 38 | IME4 5′ FSp | TAGTGGTACCGGTCACATAAATTGACGG | |
| 39 | IME4 3′ RSp | AGTTGATGTAAAAAAATACACGGACTCGG | |
| 40 | IME4 M Sp | CTTGCAAGAGCGAGCTGATCGTGAA | AATTGTTCTACCCAGTTGGTTTGTCTTT |
The plasmids used in this study are listed in Table 3. To create the constructs, target genes were amplified from the genomic DNA using gene-specific primers. The BG1805-IME4, BG1805-MUM2, BG1805-SLZ1, BG1805-FAA1, and BG1805-AFT2 constructs were procured from Thermo Scientific Open Biosystems. The protein expression was confirmed by immunoblot analyses (Fig. 11). The BG1805-IME4mut plasmid was generated by PCR-mediated site-directed mutagenesis using the BG1805-IME4 plasmid. The PFAA1-lacZ plasmid was constructed using the YEp357 vector to analyze the β-galactosidase activity. The pUG34-IME4-GFP plasmid was constructed using the pUG34-GFP vector, and the pVT100U-VAC8-GFP plasmid was constructed by replacing the mitochondrial targeting (mt) sequence of the pVT100U-mtGFP plasmid (37) with the targeted gene using the HindIII and KpnI restriction sites. The pVT100U-FOB1-RFP plasmid was constructed by replacing the mitochondrial targeting sequence plus the GFP sequence of the pVT100U-mtGFP plasmid with the targeted sequence (FOB1 gene plus RFP sequence), using the HindIII and XhoI restriction sites. Prior to cloning, the RFP sequence was PCR-amplified from the pAD54-RFP-PTS1 plasmid, and the FOB1 and RFP sequences were added by PCR. All of the constructs were confirmed by DNA sequencing. All of the primers used in the present study are listed in Table 2.
Table 3.
Plasmids used in this study
| Plasmids | Construct description | Source |
|---|---|---|
| pYES2/NT B | Yeast expression vector with His6 tag fusion | Invitrogen |
| YEp351 | Yeast expression vector with leucine selection | ATCC |
| YEp357 | Yeast episomal plasmids with lacZ reporter gene | ATCC |
| BG1805 | Yeast expression vector with uracil selection | Open Biosystems |
| BG1805-IME4 | IME4 gene is cloned into BG1805 | Open Biosystems |
| BG1805-MUM2 | MUM2 gene is cloned into BG1805 | Open Biosystems |
| BG1805-SLZ1 | SLZ1 gene is cloned into BG1805 | Open Biosystems |
| BG1805-FAA1 | FAA1 gene is cloned into BG1805 | Open Biosystems |
| BG1805-AFT2 | AFT2 gene is cloned into BG1805 | Open Biosystems |
| BG1805-IME4mut | Derived from BG1805-IME4 in which 1042GAT1044 and 1051TGG1053 are mutated to 1042GCT1044 and 1051GCG1053: BG1805-IME4mut (D to A and W to A, respectively) | This study |
| IME4-GFP | IME4 gene is cloned into pUG34-GFP (Cathal Wilson): pUG34-IME4-GFP | This study |
| pAD54-RFP-PTS1 | Combined RFP-PTS1 sequence is cloned in the pAD54 vector | Jeffrey E. Gerst |
| FOB1-RFP | FOB1 gene combined with the RFP sequence is cloned into pVT100U-mtGFP (Addgene) by replacing the mta sequence plus GFP sequence: pVT100U-FOB1-RFP | This study |
| VAC8-GFP | VAC8 gene is cloned into pVT100U-mtGFP (Addgene) by replacing the mt sequence: pVT100U-VAC8-GFP | This study |
| PFAA1-lacZ | PFAA1-lacZ reporter gene containing the FAA1 promoter into YEp357 | This study |
a mt, mitochondrial targeting.
Figure 11.
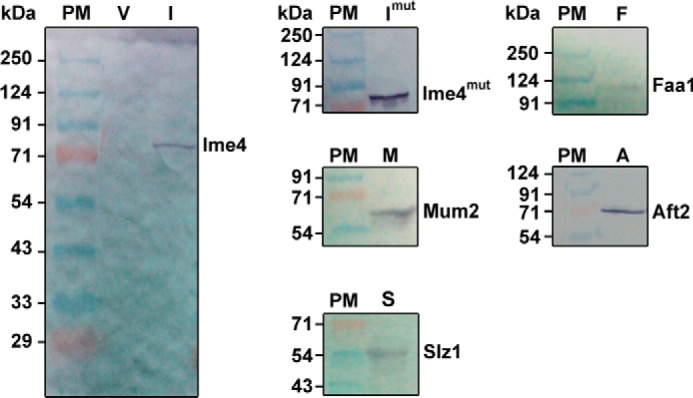
Immunoblot analysis to confirm protein expression. Yeast cells expressing each protein were collected. Protein expression was confirmed by immunoblot analyses using an anti-His6 monoclonal antibody. PM, protein marker; V, BG1805 vector control; I, BG1805-IME4; Imut, BG1805-IME4mut; M, BG1805-MUM2; S, BG1805-SLZ1; F, BG1805-FAA1; A, BG1805-AFT2. Representative immunoblots are shown.
The growth and culture conditions were the same as reported previously (30). Briefly, a single colony of the yeast strains was precultured in 5 ml of liquid YPD (1% yeast extract, 2% peptone, 2% glucose, pH 6.5) medium in a 50-ml culture tube and was allowed to grow at 30 °C with constant shaking overnight in a shaking incubator. An equal quantity of cells was taken from the overnight preculture and subcultured in the required volume of SM (YNB (6.7 g), amino acid drop-out mixture (1.92 g), uracil (76 mg/liter), and 2% glucose, pH 6.5) at 30 °C. To maintain the plasmids in the yeast cells, uracil (U) was omitted from the SM. Similarly, to select the double mutants, the amino acid leucine was removed from the SM. The yeast transformants harboring the plasmids in BG1805 backgrounds were precultured in SM − U + 2% glucose medium and then subcultured in an induction medium (SM − U + 2% galactose). The yeast cells harboring the PFAA1-lacZ and pVT100U-VAC8-GFP plasmids were precultured and subcultured in SM − U + 2% glucose medium. The yeast cells co-transformed with the pUG34-IME4-GFP and pVT100U-FOB1-RFP plasmids were precultured and subcultured in SM − U − histidine − methionine + 2% glucose medium. To study lipophagy, stationary phase-grown cells in SM were collected, washed, and divided into two parts. One part was shifted to normal SM and another part to lipophagy-inducible SM − N medium (0.17% YNB + 2% glucose) for 8 h. The bacterial cells were cultured in LB (1% tryptone, 0.5% yeast extract, 1% NaCl) medium at 37 °C in the presence of antibiotics.
Real-time quantitative PCR analysis
The stationary phase-grown cells were harvested and stored in RNAlater at −20 °C. Total RNA isolation was performed using an RNA isolation kit (NucleoSpin® RNA II kit, Macherey-Nagel), and a high-capacity cDNA reverse transcription kit from Applied Biosystems was used for the cDNA synthesis. Quantitative real-time PCR analyses were performed according to the protocol used in a previous study (30), using the primers listed in Table 2. The transcript analysis assays were conducted in triplicate. To normalize the gene expression, ACT1 (actin) was used as an endogenous control. The analyses of the transcript data are represented as the -fold change with respect to the control value, which was set to 1.
m6A Northern blot, dot blot, and MeRIP analyses
Total RNA was isolated from stationary phase-grown cells using the RNA isolation kit mentioned above. The m6A immunoblotting was performed according to the procedure reported previously (20). Briefly, equal amounts of RNA samples were denatured, followed by agarose gel electrophoresis and staining with ethidium bromide (EtBr) (to show as a loading control). Afterward, the gel was washed properly and transferred to a nylon membrane. The transferred RNA species were UV-cross-linked to the nylon membrane, followed by blocking of the membrane. The immunoblot was developed using the rabbit anti-m6A polyclonal antibody (ABE572, Merck Millipore) at a dilution of 1:1000 and ALP-conjugated anti-rabbit IgG antibody (A3687, Sigma-Aldrich) at a dilution of 1:5000.
Dot blot assays for m6A-modified mRNA species were performed essentially as mentioned above. Isolated total RNA was treated with DNase I (Invitrogen), followed by mRNA isolation from the total RNA using the DynabeadsTM mRNA DIRECTTM kit (Invitrogen) in the presence of RNase inhibitor (SUPERase-InTM, Invitrogen). The eluted mRNA was again passed through the oligo(dT) Dynabeads for mRNA isolation. Increasing amounts of mRNA from different genetic backgrounds were spotted onto a nylon membrane and probed with the m6A antibody.
Enrichment of the m6A-containing transcripts by a MeRIP assay was performed according to the procedure reported previously (20). MeRIP assays were conducted using the Dynabeads co-immunoprecipitation kit (Invitrogen). Dynabeads were coated with rabbit anti-m6A polyclonal antibody and stored at 4 °C until use. The mRNA was isolated from the total RNA using oligo(dT) Dynabeads as mentioned above. Equal amounts of mRNA from different genetic backgrounds were subjected to the MeRIP assays with the Dynabeads coated in m6A antibody. After washing, m6A antibody-bound transcripts were isolated using TRI reagent (Sigma-Aldrich), and increasing amounts of mRNA were spotted onto a nylon membrane and probed with the m6A antibody. To check the presence of the methylated FAA1 transcripts in diploid and haploid strains, the m6A antibody-bound transcripts were isolated using TRI reagent and analyzed by quantitative real-time PCR using FAA1-specific quantitative real-time primers as well as by standard PCR using a different set of FAA1-specific primers, listed in Table 2. A control MeRIP assay was also performed using rabbit IgG (Invitrogen) in place of the m6A polyclonal antibodies under the same experimental conditions.
Site-directed mutagenesis
A site-directed mutant was created to evaluate the role of motif IV of Ime4 in the TAG accumulation and vacuolar morphology. The predicted amino acid residues Asp-348 and Trp-351 were replaced with Ala. The mutations in motif IV were introduced by PCR-based amplification of the entire BG1805-IME4 construct using the primers listed in Table 2. The BG1805-IME4mut construct was confirmed by DNA sequencing. The mutated codons are underlined in the primer sequence. A QuikChange Lightning site-directed mutagenesis kit (Agilent Technologies) was used in this experiment.
In vivo [14C]acetate labeling and lipid profile analysis
The yeast cells were grown to the stationary phase in SM with 0.2 μCi of [14C]acetate/ml. Lipids were extracted from an equal quantity of cells (A600 = 25). The cells were vigorously vortexed in the presence of a chloroform, methanol, 2% orthophosphoric acid (1:2:1, v/v/v) solution with acid-washed glass beads. The chloroform, methanol, 2% orthophosphoric acid (1:1:1, v/v/v) solution was used for extraction of the total lipids. The nonpolar lipids were separated on a TLC plate using a solvent system (petroleum ether/diethyl ether/acetic acid, 70:30:1, v/v/v), followed by phosphorimaging. A Typhoon FLA 9500 laser scanner (GE Healthcare) was used for phosphorimaging. Every lipid species was quantified and represented much as reported previously (38). Briefly, in each genetic background, the amount of TAG + SE was determined relative to the total lipid content and compared with the obtained control value (mean, n = 3), which was set at 100%.
Confocal microscopy
The stationary phase–grown cells were collected, washed, and stained with the respective dyes. BODIPYTM 493/503 dye was used to stain the LDs. The cells were harvested and washed with 1× PBS (pH 7.4). After washing, the cells were incubated with 1 μg/ml BODIPYTM 493/503 dye in 1× PBS in the dark, and confocal images were captured. To quantify the LDs, 100–200 cells from multiple fields of view were scored in each strain, and the number of LDs was represented by a box plot. The yeast vacuole was stained with FM4-64 dye according to the procedure reported previously (39). A Zeiss LSM 700 confocal laser-scanning microscope was used for the imaging. For the quantification of vacuolar morphology, at least 200–300 cells were scored in each strain based on the four different vacuolar patterns. To avoid cell movement, the microscope slides were covered with a thin film of 2% agarose.
β-Galactosidase assay
The YEp357 and PFAA1-lacZ (YEp357-FAA1) plasmids were transformed into the WT, ime4Δ, and aft2Δ strains. To analyze the β-galactosidase activity of PFAA1-lacZ on the WT and ime4Δ backgrounds, the yeast cells harboring the YEp357 and PFAA1-lacZ plasmids were precultured and subcultured in SM − U + 2% glucose medium. Log phase–grown cells were harvested and washed with water. The cell-free extracts were prepared, and the β-galactosidase activity was measured according to the procedure reported previously (40). The β-galactosidase activity in the ime4Δ and aft2Δ strains was represented as a percentage of the WT activity, which was set at 100%.
ChIP assay
ChIP assays were conducted using the Dynabeads co-immunoprecipitation kit (Invitrogen) according to the procedure reported previously (41). Briefly, the yeast cells overexpressing Aft2 protein were collected and fixed with 1% (v/v) aqueous formaldehyde for 15 min. The excess amount of formaldehyde was quenched with 2.5 m glycine. Cells were washed with 1× PBS, and pellets were stored at −80 °C until use. Dynabeads were coated with a ChIP-grade monoclonal anti-HA antibody (H3663, lot 025M4772V) from Sigma-Aldrich. Similarly, for the control assay, Dynabeads were coated with the anti-RFP antibody (SAB2702214, lot 41232) from Sigma-Aldrich, and antibody-coated beads were stored at 4 °C until use. Cell extracts and chromatin samples were prepared according to the procedure reported previously (30). In each case, about one-tenth of the total chromatin was kept as input (IN) at −20 °C, and the rest of the chromatin was divided into two parts, one for immunoprecipitation (IP) and the other for control immunoprecipitation (CIP). The IP and CIP samples were incubated with the Dynabeads coated with anti-HA and anti-RFP antibodies, respectively, for 45 min at 4 °C. Afterward, the Dynabeads were washed, and DNA from the IN, IP, and CIP samples was recovered using the PCR-cleanup kit (Sigma-Aldrich). PCR-based data analysis was performed, and densitometric quantification of the PCR product band intensities was performed using the GeneTools software (SynGene, a division of Synoptics Ltd.). The obtained results were represented as reported earlier (42). Final template concentrations of 1% (IN) and 4% (IP and CIP) were used for the PCR. To validate the ChIP data, the qChIP analysis was also performed, and the obtained ChIP-qPCR data are represented as reported earlier (43). The primers used in the ChIP and qChIP assays are listed in Table 2.
SEM
To study the effect of the IME4 gene on the vacuolar morphology, a scanning electron microscope (LEO 435-VP, Carl Zeiss) was used. The stationary phase–grown cells were collected and processed for SEM analyses. The cells were fixed using 1% (v/v) aqueous formaldehyde for 30 min followed by gradient (10–100%) dehydration using molecular grade ethyl alcohol. The dried yeast cells were gold-plated and subjected to SEM analyses.
Statistical analysis
In the present study, the data are represented much as reported previously (31, 38). The data are represented as the mean ± S.E. (n = 3). For the data analyses, Student's t test or one-way analysis of variance with a Dunnett post hoc test was performed. Significance was determined at p < 0.05 (*) and p < 0.01 (**); ns in the figures represents not significant.
Author contributions
R. R. conceived and initiated the project. R. R. and P. K. Y. designed the experiments. P. K. Y. executed the experiments and analyzed the data. P. K. Y. and R. R. discussed the data and wrote the paper.
Acknowledgments
We are thankful to Prof. Jeffrey E. Gerst (Weizmann Institute of Science, Rehovot, Israel) for providing the pAD54-RFP-PTS1 construct. We are grateful to the Department of Biochemistry of the Indian Institute of Science in Bangalore for the use of their facility for the radioactive study.
This work was supported by the Council of Scientific and Industrial Research (CSIR), India, under the 12th 5-year plan project LIPIC (BSC0401). The authors declare that they have no conflicts of interest with the contents of this article.
A. Cadou and A. Mayer, poster presented at the Biochemical Society Conference, Edinburgh, UK (October 26–29, 2015).
- m6A
- N6-methyladenosine
- TAG
- triacylglycerol(s)
- PrA and PrB
- proteinase A and B, respectively
- SM
- synthetic minimal medium
- SE
- steryl ester(s)
- LD
- lipid droplet
- MeRIP
- methylated RNA immunoprecipitation
- qChIP
- quantitative ChIP
- NVJ
- nucleus–vacuole junction
- IN
- input
- IP
- immunoprecipitation
- CIP
- control IP
- DIC
- differential interference contrast.
References
- 1. Schwartz S., Agarwala S. D., Mumbach M. R., Jovanovic M., Mertins P., Shishkin A., Tabach Y., Mikkelsen T. S., Satija R., Ruvkun G., Carr S. A., Lander E. S., Fink G. R., and Regev A. (2013) High-resolution mapping reveals a conserved, widespread, dynamic mRNA methylation program in yeast meiosis. Cell 155, 1409–1421 [DOI] [PMC free article] [PubMed] [Google Scholar]
- 2. Yue Y., Liu J., and He C. (2015) RNA N6-methyladenosine methylation in post-transcriptional gene expression regulation. Genes Dev. 29, 1343–1355 [DOI] [PMC free article] [PubMed] [Google Scholar]
- 3. Dominissini D., Moshitch-Moshkovitz S., Schwartz S., Salmon-Divon M., Ungar L., Osenberg S., Cesarkas K., Jacob-Hirsch J., Amariglio N., Kupiec M., Sorek R., and Rechavi G. (2012) Topology of the human and mouse m6A RNA methylomes revealed by m6A-seq. Nature 485, 201–206 [DOI] [PubMed] [Google Scholar]
- 4. Agarwala S. D., Blitzblau H. G., Hochwagen A., and Fink G. R. (2012) RNA methylation by the MIS complex regulates a cell fate decision in yeast. PLoS Genet. 8, e1002732. [DOI] [PMC free article] [PubMed] [Google Scholar]
- 5. Clancy M. J., Shambaugh M. E., Timpte C. S., and Bokar J. A. (2002) Induction of sporulation in Saccharomyces cerevisiae leads to the formation of N6-methyladenosine in mRNA: a potential mechanism for the activity of the IME4 gene. Nucleic Acids Res. 30, 4509–4518 [DOI] [PMC free article] [PubMed] [Google Scholar]
- 6. Gelfand B., Mead J., Bruning A., Apostolopoulos N., Tadigotla V., Nagaraj V., Sengupta A. M., and Vershon A. K. (2011) Regulated antisense transcription controls expression of cell-type-specific genes in yeast. Mol. Cell. Biol. 31, 1701–1709 [DOI] [PMC free article] [PubMed] [Google Scholar]
- 7. Hongay C. F., Grisafi P. L., Galitski T., and Fink G. R. (2006) Antisense transcription controls cell fate in Saccharomyces cerevisiae. Cell 127, 735–745 [DOI] [PubMed] [Google Scholar]
- 8. Shah J. C., and Clancy M. J. (1992) IME4, a gene that mediates MAT and nutritional control of meiosis in Saccharomyces cerevisiae. Mol. Cell. Biol. 12, 1078–1086 [DOI] [PMC free article] [PubMed] [Google Scholar]
- 9. Chassang A., Roger M., Vezinhet F., and Galzy P. (1972) Variation of the lipid content of yeast cells during sporulation. Folia Microbiol. 17, 241–247 [DOI] [PubMed] [Google Scholar]
- 10. Illingworth R. F., Rose A. H., and Beckett A. (1973) Changes in the lipid composition and fine structure of Saccharomyces cerevisiae during ascus formation. J. Bacteriol. 113, 373–386 [DOI] [PMC free article] [PubMed] [Google Scholar]
- 11. Steele S. D., and Miller J. J. (1974) Ultrastructural changes in germinating ascospores of Saccharomyces cerevisiae. Can. J. Microbiol. 20, 929–933 [DOI] [PubMed] [Google Scholar]
- 12. Kurat C. F., Wolinski H., Petschnigg J., Kaluarachchi S., Andrews B., Natter K., and Kohlwein S. D. (2009) Cdk1/Cdc28-dependent activation of the major triacylglycerol lipase Tgl4 in yeast links lipolysis to cell-cycle progression. Mol. Cell 33, 53–63 [DOI] [PubMed] [Google Scholar]
- 13. Bryant N. J., and Stevens T. H. (1998) Vacuole biogenesis in Saccharomyces cerevisiae: protein transport pathways to the yeast vacuole. Microbiol. Mol. Biol. Rev. 62, 230–247 [DOI] [PMC free article] [PubMed] [Google Scholar]
- 14. Efe J. A., Botelho R. J., and Emr S. D. (2005) The Fab1 phosphatidylinositol kinase pathway in the regulation of vacuole morphology. Curr. Opin. Cell Biol. 17, 402–408 [DOI] [PubMed] [Google Scholar]
- 15. Betz H., and Weisner U. (1976) Protein degradation and proteinases during yeast sporulation. Eur. J. Biochem. 62, 65–76 [DOI] [PubMed] [Google Scholar]
- 16. Zubenko G. S., and Jones E. W. (1981) Protein degradation, meiosis and sporulation in proteinase-deficient mutants of Saccharomyces cerevisiae. Genetics 97, 45–64 [DOI] [PMC free article] [PubMed] [Google Scholar]
- 17. Jones E. W. (1984) The synthesis and function of proteases in Saccharomyces: genetic approaches. Annu. Rev. Genet. 18, 233–270 [DOI] [PubMed] [Google Scholar]
- 18. Roeder A. D., and Shaw J. M. (1996) Vacuole partitioning during meiotic division in yeast. Genetics 144, 445–458 [DOI] [PMC free article] [PubMed] [Google Scholar]
- 19. Michaillat L., and Mayer A. (2013) Identification of genes affecting vacuole membrane fragmentation in Saccharomyces cerevisiae. PLoS One 8, e54160. [DOI] [PMC free article] [PubMed] [Google Scholar]
- 20. Meyer K. D., Saletore Y., Zumbo P., Elemento O., Mason C. E., and Jaffrey S. R. (2012) Comprehensive analysis of mRNA methylation reveals enrichment in 3′ UTRs and near stop codons. Cell 149, 1635–1646 [DOI] [PMC free article] [PubMed] [Google Scholar]
- 21. Zweytick D., Athenstaedt K., and Daum G. (2000) Intracellular lipid particles of eukaryotic cells. Biochim. Biophys. Acta 1469, 101–120 [DOI] [PubMed] [Google Scholar]
- 22. Horvath S. E., Wagner A., Steyrer E., and Daum G. (2011) Metabolic link between phosphatidylethanolamine and triacylglycerol metabolism in the yeast Saccharomyces cerevisiae. Biochim. Biophys. Acta 1811, 1030–1037 [DOI] [PMC free article] [PubMed] [Google Scholar]
- 23. Black P. N., and DiRusso C. C. (2007) Yeast acyl-CoA synthetases at the crossroads of fatty acid metabolism and regulation. Biochim. Biophys. Acta 1771, 286–298 [DOI] [PubMed] [Google Scholar]
- 24. Wang C. W., Miao Y. H., and Chang Y. S. (2014) A sterol-enriched vacuolar microdomain mediates stationary phase lipophagy in budding yeast. J. Cell Biol. 206, 357–366 [DOI] [PMC free article] [PubMed] [Google Scholar]
- 25. Rudge S. A., Anderson D. M., and Emr S. D. (2004) Vacuole size control: regulation of PtdIns(3,5)P2 levels by the vacuole-associated Vac14-Fig 4 complex, a PtdIns(3,5)P2-specific phosphatase. Mol. Biol. Cell 15, 24–36 [DOI] [PMC free article] [PubMed] [Google Scholar]
- 26. Pan X., Roberts P., Chen Y., Kvam E., Shulga N., Huang K., Lemmon S., and Goldfarb D. S. (2000) Nucleus-vacuole junctions in Saccharomyces cerevisiae are formed through the direct interaction of Vac8p with Nvj1p. Mol. Biol. Cell 11, 2445–2457 [DOI] [PMC free article] [PubMed] [Google Scholar]
- 27. Subramanian K., Dietrich L. E., Hou H., LaGrassa T. J., Meiringer C. T., and Ungermann C. (2006) Palmitoylation determines the function of Vac8 at the yeast vacuole. J. Cell Sci. 119, 2477–2485 [DOI] [PubMed] [Google Scholar]
- 28. Rutherford J. C., Jaron S., Ray E., Brown P. O., and Winge D. R. (2001) A second iron-regulatory system in yeast independent of Aft1p. Proc. Natl. Acad. Sci. U.S.A. 98, 14322–14327 [DOI] [PMC free article] [PubMed] [Google Scholar]
- 29. Zheng J., Benschop J. J., Shales M., Kemmeren P., Greenblatt J., Cagney G., Holstege F., Li H., and Krogan N. J. (2010) Epistatic relationships reveal the functional organization of yeast transcription factors. Mol. Syst. Biol. 6, 420. [DOI] [PMC free article] [PubMed] [Google Scholar]
- 30. Yadav P. K., and Rajasekharan R. (2016) Misregulation of a DDHD domain-containing lipase causes mitochondrial dysfunction in yeast. J. Biol. Chem. 291, 18562–18581 [DOI] [PMC free article] [PubMed] [Google Scholar]
- 31. Sambri I., D'Alessio R., Ezhova Y., Giuliano T., Sorrentino N. C., Cacace V., De Risi M., Cataldi M., Annunziato L., De Leonibus E., and Fraldi A. (2017) Lysosomal dysfunction disrupts presynaptic maintenance and restoration of presynaptic function prevents neurodegeneration in lysosomal storage diseases. EMBO Mol. Med. 9, 112–132 [DOI] [PMC free article] [PubMed] [Google Scholar]
- 32. Roberts P., Moshitch-Moshkovitz S., Kvam E., O'Toole E., Winey M., and Goldfarb D. S. (2003) Piecemeal microautophagy of nucleus in Saccharomyces cerevisiae. Mol. Biol. Cell 14, 129–141 [DOI] [PMC free article] [PubMed] [Google Scholar]
- 33. Saletore Y., Meyer K., Korlach J., Vilfan I. D., Jaffrey S., and Mason C. E. (2012) The birth of the epitranscriptome: deciphering the function of RNA modifications. Genome Biol. 13, 175. [DOI] [PMC free article] [PubMed] [Google Scholar]
- 34. Kopelman P. G. (2000) Obesity as a medical problem. Nature 404, 635–643 [DOI] [PubMed] [Google Scholar]
- 35. Prinz W. A. (2010) Lipid trafficking sans vesicles: where, why, how? Cell 143, 870–874 [DOI] [PMC free article] [PubMed] [Google Scholar]
- 36. Rothstein R. (1991) Targeting, disruption, replacement, and allele rescue: integrative DNA transformation in yeast. Methods Enzymol. 194, 281–301 [DOI] [PubMed] [Google Scholar]
- 37. Westermann B., and Neupert W. (2000) Mitochondria-targeted green fluorescent proteins: convenient tools for the study of organelle biogenesis in Saccharomyces cerevisiae. Yeast 16, 1421–1427 [DOI] [PubMed] [Google Scholar]
- 38. Tamura Y., Onguka O., Hobbs A. E., Jensen R. E., Iijima M., Claypool S. M., and Sesaki H. (2012) Role for two conserved intermembrane space proteins, Ups1p and Ups2p, [corrected] in intra-mitochondrial phospholipid trafficking. J. Biol. Chem. 287, 15205–15218 [DOI] [PMC free article] [PubMed] [Google Scholar]
- 39. Vida T. A., and Emr S. D. (1995) A new vital stain for visualizing vacuolar membrane dynamics and endocytosis in yeast. J. Cell Biol. 128, 779–792 [DOI] [PMC free article] [PubMed] [Google Scholar]
- 40. Rose M., and Botstein D. (1983) Construction and use of gene fusions to lacZ (β-galactosidase) that are expressed in yeast. Methods Enzymol. 101, 167–180 [DOI] [PubMed] [Google Scholar]
- 41. van Attikum H., Fritsch O., Hohn B., and Gasser S. M. (2004) Recruitment of the INO80 complex by H2A phosphorylation links ATP-dependent chromatin remodeling with DNA double-strand break repair. Cell 119, 777–788 [DOI] [PubMed] [Google Scholar]
- 42. Laha S., Das S. P., Hajra S., Sanyal K., and Sinha P. (2011) Functional characterization of the Saccharomyces cerevisiae protein Chl1 reveals the role of sister chromatid cohesion in the maintenance of spindle length during S-phase arrest. BMC Genet. 12, 83. [DOI] [PMC free article] [PubMed] [Google Scholar]
- 43. Zhao H., Han Z., Liu X., Gu J., Tang F., Wei G., and Jin Y. (2017) The chromatin remodeler protein Chd4 maintains embryonic stem cell identity by controlling pluripotency- and differentiation-associated genes. J. Biol. Chem. 292, 8507–8519 [DOI] [PMC free article] [PubMed] [Google Scholar]