

Abstract
Autophagy has been shown to be important for normal homeostasis and adaptation to stress in the kidney. Yet, the molecular mechanisms regulating renal epithelial autophagy are not fully understood. Here, we explored the role of the stress-responsive transcription factor forkhead box O3 (FoxO3) in mediating injury-induced proximal tubular autophagy in mice with unilateral ureteral obstruction (UUO). We show that following UUO, FoxO3 is activated and displays nuclear expression in the hypoxic proximal tubules exhibiting high levels of autophagy. Activation of FoxO3 by mutating phosphorylation sites to enhance its nuclear expression induces profound autophagy in cultured renal epithelial cells. Conversely, deleting FoxO3 in mice results in fewer numbers of autophagic cells in the proximal tubules and reduced ratio of the autophagy-related protein LC3-II/I in the kidney post-UUO. Interestingly, autophagic cells deficient in FoxO3 contain lower numbers of autophagic vesicles per cell. Analyses of individual cells treated with autophagic inhibitors to sequentially block the autophagic flux suggest that FoxO3 stimulates the formation of autophagosomes to increase autophagic capacity but has no significant effect on autophagosome-lysosome fusion or autolysosomal clearance. Furthermore, in kidneys with persistent UUO for 7 days, FoxO3 activation increases the abundance of mRNA and protein levels of the core autophagy-related (Atg) proteins including Ulk1, Beclin-1, Atg9A, Atg4B, and Bnip3, suggesting that FoxO3 may function to maintain components of the autophagic machinery that would otherwise be consumed during prolonged autophagy. Taken together, our findings indicate that FoxO3 activation can both induce and maintain autophagic activities in renal epithelial cells in response to injury from urinary tract obstruction.
Keywords: autophagy, epithelial cell, hypoxia, kidney, stress, Atg proteins, FoxO3 activation
Introduction
Autophagy is essential for normal renal homeostasis (1) and serves as an adaptive response to stress and injury to the kidney (2–5). We have previously shown that autophagy is induced in the kidney tubules following ischemic injury and resolves when tubules enter the repair phase. Autophagy resolution and tubular regeneration requires mechanistic target of rapamycin (mTOR)3 activation (6). Despite the progress in the general understanding of autophagy regulation in many other cell types, little is known about its molecular regulation in the kidney beyond the role of mTOR in models of transient stress and injury to the kidney.
Here, we investigate the regulation of epithelial autophagy in the kidney with persistent stress following unilateral ureteral obstruction (UUO), where prolonged epithelial autophagy can be induced (7). We focused on FoxO3, which is a stress-induced transcription factor known to play an important role in energy metabolism, stress adaptation, longevity, cell proliferation, and death (8). It is indispensable for autophagy and cell atrophy in skeletal and cardiac muscles under stress (9–11). In the presence of survival factors, such as insulin-like growth factor-1 or nutrient abundance, FoxO3 is phosphorylated by kinases and exported from the nucleus to the cytoplasm, and becomes inactive. Cytoplasmic FoxO3 can then be degraded via the ubiquitin degradation system (12, 13). However, following stress, FoxO3 accumulates in the nucleus and functions as a transcription activator or repressor in a context-dependent fashion (12, 14).
There is only limited knowledge of the function of FoxO3 in the kidney. FoxO3 null mice (15) are born with no renal structural defects, indicating that FoxO3 is not required for nephrogenesis in the environment where growth factor and nutrient abundant favors cell growth. In the aging and hypoxic mouse kidneys, FoxO3 is activated following caloric restriction in a histone deacetylase Sirt1-dependent manner. Exposing renal tubular cells to serum obtained from caloric restricted aging mice activates FoxO3 and induces the expression of a core autophagy protein Bnip3, which plays a role in mitophagy. This FoxO3-mediated autophagic effect provides a mechanism for cytoprotection against hypoxia during aging (16). Given the importance of FoxO3 in stress response across many cell types (8), we explore its regulation of epithelial autophagy following UUO, in which autophagy is induced consistently (6, 7). We demonstrate here that FoxO3 is significantly activated in proximal tubules to stimulate autophagy via increasing the autophagic capacity in individual cells and stimulating transcriptional activation of core Atg proteins for sustained autophagic response in the obstructed kidneys.
Results
Obstructive injury induces the most significant autophagy in the hypoxic proximal tubules
Using the autophagy reporter mice CAG-RFP-EGFP-LC3 (named CREL here), we examined epithelial autophagy by the presence of RFP puncta that were known to be present in all stages of autophagic vesicles. We defined cells that contained 3 or more RFP dots as autophagic cells (6). In sham-operated control mice, 6.7 ± 2.2% of proximal tubules contained autophagic cells. UUO stimulated autophagy dramatically in the injured proximal tubules that expressed kidney injury molecule 1 (Kim1), in which 69.0 ± 6.8% at 3 days (n = 3, p < 0.005) and 88.8 ± 5.7% at 7 days (n = 3, p < 0.001) were autophagic. In comparison, collecting ducts that were closest to the site of obstruction showed less significant increases in autophagy in principal cells (dolichos biflorus agglutinin (DBA+)) from 8.4 ± 1.4% at the basal level to 20.8 ± 0.9% at 3 days (n = 3, p = 0.03), and 33.3 ± 3.9% at 7 days (n = 3, p < 0.05) following UUO. Intercalated cells (DBA−) of the collecting ducts, which are known to have a high basal level of autophagy (6) showed no increase in the number of autophagic cells from the basal level of 17.3 ± 1.0 to 14.9 ± 1.7% (n = 3) at 3 days and 17.4 ± 1.2% (n = 3) at 7 days (Fig. 1, A and B). Our results indicate a differential stress-induced autophagic response in renal tubules.
Figure 1.
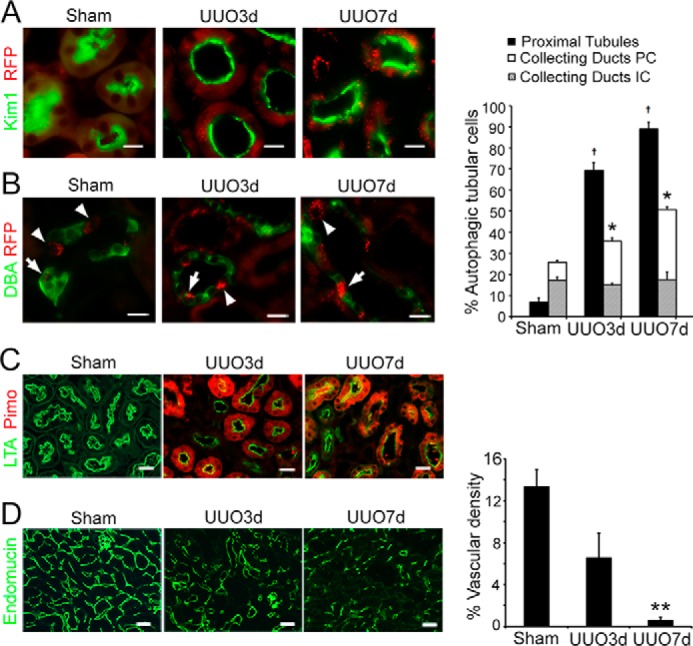
Obstructive injury induces significant autophagy in the hypoxic proximal tubules. A, increased number of autophagic cells that contain ≥3 RFP dots in proximal tubules that express Kim1 (green) following UUO. Proximal tubules in sham were identified by LTA staining in green. B, increased number of autophagic cells that contain ≥3 RFP dots in principal cells (PC, arrows) labeled positive for DBA (green) and no increase in autophagy in intercalated cells (IC, arrowheads) that are negative for DBA in the collecting ducts. Scale bar, 20 μm in A and B. Values are mean ± S.E., n = 3; †, p < 0.001 comparing UUO with sham in the proximal tubules; *, p < 0.05 comparing UUO with sham in the principal cells of the collecting ducts. C, proximal tubular hypoxia indicated by the accumulation of pimonidazole protein adducts (Pimo, red) following UUO. Proximal tubules were identified by LTA staining in green. D, reduced microvascular density indicated by endomucin staining of the endothelial cells of capillaries and small veins. Scale bar, 20 μm in C and D. Values are mean ± S.E. n = 4. **, p < 0.01 compared with sham in D.
Nutrient deprivation and energy deficiency are potent inducers for autophagy. In the proximal tubules where the most significant increase in autophagy occurred, tubular hypoxia indicated by the accumulation of pimonidazole protein adducts was apparent (Fig. 1C), whereas in the collecting ducts the protein adducts were below a detectable level (not shown). Peritubular microvascular density indicated by immunostaining of endomucin, which labeled endothelial cells of the capillaries and small veins was reduced significantly (n = 4 p < 0.01) in the post-obstructive kidneys (Fig. 1D), suggesting a decrease in oxygen and nutrient delivery to the kidney. It is likely that high demands for oxygen-dependent energy production in the mitochondrion-rich proximal tubules contribute to their more hypoxic status.
Hypoxia activates FoxO3 in renal tubular cells
To understand the molecular regulation of proximal tubular autophagy in post-obstructive hypoxic kidneys, we focused on FoxO3, which is a stress-responsive transcription factor shown to activate autophagy in a wide range of cell types (9–11). FoxO3 can mediate mitophagy to increase the adaptation to hypoxia in the aging kidney in mice with caloric restriction (16). Furthermore, hypoxia has been shown to cause FoxO3 accumulation through inhibition of FoxO3 degradation in a breast cancer cell line (13). Similarly, exposing primary cultures of proximal tubular cells to hypoxic conditions (1% O2) for 10 min to 4 h resulted in significant increases in FoxO3 protein abundance that peaked at 1 h. Autophagic levels measured by the ratio of LC3-II/I proteins increased concurrently (Fig. 2A).
Figure 2.

Hypoxia increases FoxO3 protein abundance and epithelial autophagy. A, hypoxia (1% O2) increases FoxO3 protein abundance and cell autophagy in primary cultures of renal epithelial cells. B, primary cultures grew in normoxic conditions were pre-treated with a PHD inhibitor DMOG or vehicle for 2 h before continuing treatment in the normoxic condition for an additional 30 min. Another group of cells were exposed to 1% oxygen for 30 min. Immunoblot analysis indicates Hif1 protein stabilization in cells treated with DMOG or exposed to 1% oxygen. C, DMOG treatment leads to increased levels of FoxO3 protein as well as higher ratio of LC3II/I. Values are mean ± S.E. n = 3. *, p < 0.05 comparing DMOG or vehicle treatment; **, p < 0.01 comparing cells in normoxic and 1% oxygen conditions.
Renal epithelial cells express prolyl hydroxylases (PHD1–3), that are oxygen- and 2-oxoglutarate-dependent in their enzyme activity (17, 18). To begin to understand whether PHDs could catalyze FoxO3 hydroxylation leading to protein degradation similar to that of breast cancer cell line, we treated primary cultures grown in normoxic conditions with a PHD inhibitor dimethyloxalylglycine (DMOG), which is an antagonist of 2-oxoglutarate. DMOG treatment stabilized the Hif1α that is a known substrate of PHD enzyme (Fig. 2B), indicating its effectiveness in enzyme inhibition. Moreover, DMOG mimicked the hypoxic condition to cause increased FoxO3 protein as well as the ratio of LC3-II/I (Fig. 2C). Our results suggest that prolyl hydroxylase activity may regulate FoxO3 protein abundance directly and/or via a Hif1-dependent mechanism that has been shown in other cells (19, 20). Future studies to delete Hif1α or FoxO3 specifically in renal tubular cells will help understand the interaction of Hif1 and FoxO3 in the hypoxic and diseased kidneys.
Obstructive injury activates FxO3 to induce proximal tubular autophagy
In the kidneys, expression of nuclear FoxO3 in proximal tubules was significantly increased from 6.0 ± 1.8% at basal level to 34.0 ± 3.4% at 3 days (n = 3, p < 0.01) and 45.5 ± 2.8% at 7 days (n = 3, p < 0.05) following UUO (Fig. 3A). Further analysis indicated that at 7 days post-UUO, 90.6 ± 0.3% of nuclear FoxO3-expressing cells underwent autophagy with 3 or more RFP dots in the cytoplasm (Fig. 3B), suggesting a role of FoxO3 in autophagy regulation.
Figure 3.
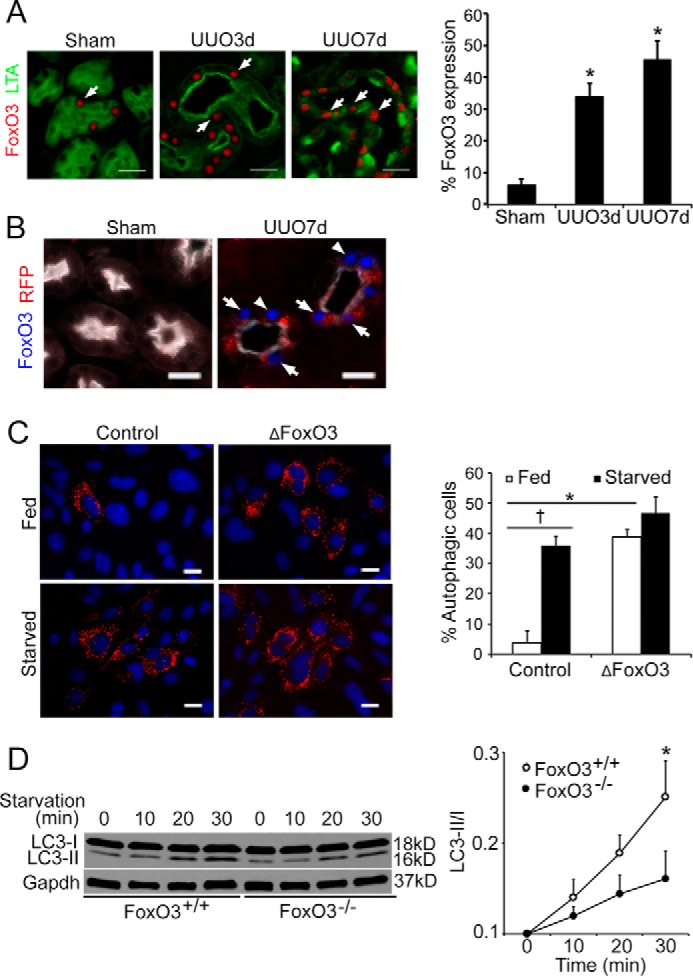
UUO activates FoxO3 to stimulate epithelial autophagy. A, UUO induces significant increases in nuclear FoxO3 expression (red, arrows) in injured proximal tubules that express Kim1 (green). Proximal tubules in sham were identified by the LTA staining in green. Values are mean ± S.E. n = 3. **, p < 0.05 compared with sham. Scale bar, 20 μm. B, abundant autophagy with the presence of RFP dots (arrows) in nuclear FoxO3 expressing proximal tubules that express Kim1 (white). Proximal tubules in sham were identified by the LTA staining in white. Scale bar, 20 μm. C, renal epithelial cells of CREL mice infected with ΔFoxO3 show abundant autophagic RFP dots under fed and starved conditions. Values are mean ± S.E. n = 4, *, p < 0.05. Cells with control infection show low levels of autophagy under fed conditions but respond to starvation with increased autophagy. Values are mean ± S.E. n = 4. †, p < 0.05. Scale bar, 10 μm. D, reduction of autophagy in cells deficient with FoxO3. Primary cultures of renal epithelial cells were isolated from FoxO3+/+ and FoxO3−/− mice and subjected to starvation by feeding with amino acid- and glucose-deficient medium. Immunoblots indicate lower levels in the ratio of LC3-II/I proteins in cells isolated from FoxO3−/− mice. Gapdh was used as a loading control. Values are mean ± S.E. n = 4. *, p < 0.05 compared with FoxO3+/− mice.
FoxO3 regulation by post-translational modifications has been extensively reported (21). Insulin and growth factors stimulate Akt to phosphorylate three serine and threonine residues in FoxO3 leading to FoxO3 nuclear-cytoplasmic shuttling. When localized to the nucleus, FoxO3 can function as a transcriptional activator or repressor (12, 14). To directly test whether nuclear-localized FoxO3 activated autophagy in kidney tubular cells, we isolated renal epithelial cells from CREL mice and infected the primary cultures with adenoviruses expressing a mutated FoxO3 (ΔFoxO3) in which all three Akt phosphorylation sites at serine and threonine residues were changed to alanine, thus restricting it to the nucleus. Under normal culture conditions, 3.8 ± 2.0% cells infected with control adenoviruses showed evidence of autophagy. In comparison, 38.8 ± 1.6% cells infected with adeno-ΔFoxO3 underwent autophagy (p < 0.05, n = 4). Starving cells by intubating in a basal medium (Earle's Balanced Salt Solution, EBSS) that contained no amino acids and glucose for 30 min led to an expected increase in autophagy in cells with control infections (10-fold increase), but no further increase of autophagy in cells with adeno-ΔFoxO3 infections (Fig. 3C). Our results suggest that expression of nuclear FoxO3 can activate autophagy in kidney epithelial cells. Conversely, cells lacking FoxO3 (isolated from FoxO3−/− mice) showed a reduced autophagic response with a lower ratio of LC3II/I when primary cultures were deprived of amino acid and glucose for 30 min (n = 4, p < 0.05) (Fig. 3D), further supporting the role of FoxO3 in autophagy activation.
FoxO3 activation increases autophagic capacity in epithelial cells
The effect of FoxO3 activation in epithelial autophagy was further tested in the kidneys with obstructive injury. FoxO3−/− mice have no renal structural and functional abnormalities and live normally, with the exception that female mice exhibit early ovarian failure due to accelerated differentiation of germ line stem cells (15). Although under basal conditions, FoxO3−/− mouse kidneys tended to have lower levels of the ratio of LC3-II/I proteins than that of FoxO3+/+ mouse kidneys, no significant differences in the ratio were detected (n = 4). Following UUO, FoxO3+/+ mice showed a progressive increase in LC3-II/I protein levels from the baseline, whereas the increases in LC3-II/I proteins did not reach a significant level in FoxO3−/− mice. At 3 and 7 days post-UUO, there was a 57 and 58% reduction in the ratio of LC3-II/I proteins in FoxO3−/− mouse kidneys, respectively (Fig. 4A).
Figure 4.
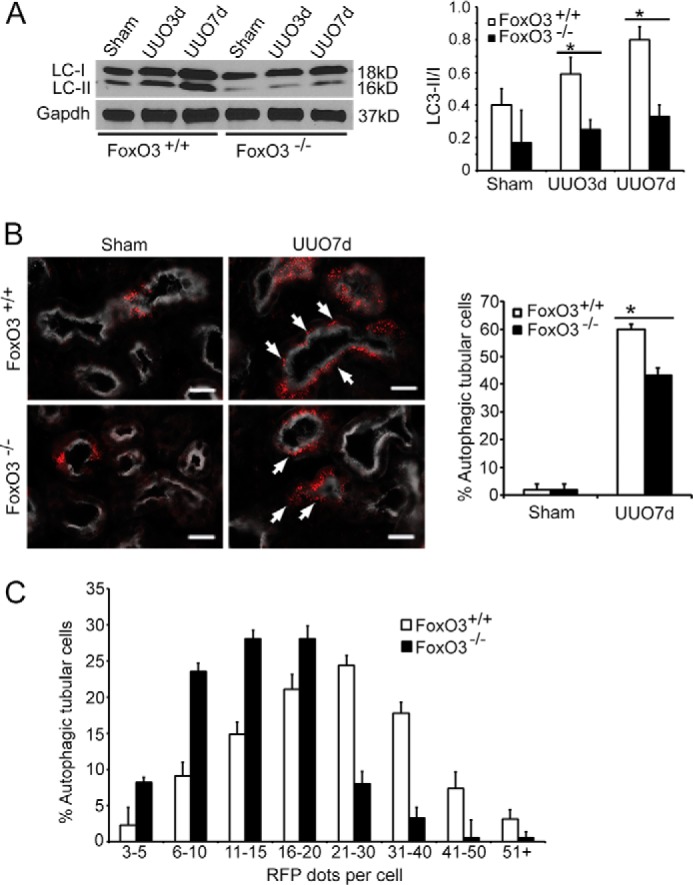
FoxO3 increases autophagic capacity in renal epithelial cells. A, significant increases in the ratio of LC3-II/I proteins in FoxO3+/+ but not in FoxO3−/− mice following obstructive injury. Gapdh was used as a loading control. *, p < 0.05, comparing UUO to sham. B, greater numbers of cells in the proximal tubules (labeled with LTA in white) exhibit autophagy with the presence of ≥3 RFP dots (arrows) in FoxO3+/+ than in those of FoxO3−/− mice. Values are mean ± S.E. n = 4. *, p < 0.01 between FoxO3+/+ and FoxO3−/− mice. Scale bar, 20 μm. C, the majority of autophagic proximal tubular cells (defined as cells containing ≥3 RFP dots) contain 20 or less RFP dots in FoxO3−/− mice, whereas the majority of autophagic cells in proximal tubules of FoxO3+/+ mice contain 20 or more dots.
Next, we crossed the CREL reporter with FoxO3 mice and quantified the proximal tubules for the number of autophagic cells indicated by the presence of 3 or more RFP dots. At 7 days post-UUO, a 30% reduction of autophagic cells was detected in CREL;FoxO3−/− mice compared with CREL;FoxO3+/+ mice (Fig. 4B) (n = 4, p < 0.01). Close examination of the number of RFP+ dots per cell indicated that the majority (88%) of autophagic cells in CREL;FoxO3−/− mice had 20 or fewer dots. In comparison, more than half (53%) of autophagic cells in CREL;FoxO3+/+ mice had more than 20 dots (Fig. 4C). Our results suggest that FoxO3 activation may increase the autophagic capacity in individual renal epithelial cells. Alternatively, FoxO3 could reduce the clearance of autophagic vesicles resulting in accumulation of RFP dots in each cell.
FoxO3 increases autophagy by stimulating the formation of autophagosomes
To study whether FoxO3 increased autophagic capacity or interfered with autophagic flux by reducing clearance, we first tested the utility of using renal epithelial cells isolated from CREL mice to track autophagic flux. We have previously generated CREL mice that expressed a tandem RFP (pKa 4.5) and EGFP (pKa 5.9) fused with LC3 protein with the goal to identify autophagosomes (AP), which appeared yellow due to emission of both RFP with EGFP fluorescence, and autolysosomes (AL), which would appear red if quenching of EGFP fluorescence in the acidic lysosomal pH was complete. We have previously shown that 14% of AL in cultured renal epithelial cells also emitted weak green signals, indicating that quenching of EGFP fluorescence could be incomplete in the lysosomal pH 4–5 (6). In addition, inhibitors commonly used to study autophagic flux may increase lysosomal pH, thus resulting in more AL to appear yellow. Therefore, we added staining for the lysosomal marker Lamp1 to distinguish autophagic dots before and after fusion with lysosomes to study the effect of FoxO3 on autophagic capacity and flux.
Upon starvation for 30 min, 15 ± 1.8% of yellow dots also expressed Lamp1. Treating cells with hydroxychloroquine, which increased the lysosomal pH, resulted in an increase in Lamp1-positive yellow dots to 59 ± 3.4%. Bafilomycin, a V-ATPase inhibitor that inhibited both fusion and lysosomal degradation, also increased the number of Lamp1-positive yellow dots to 48 ± 1.8%. Next, we treated cells with vinblastine, which inhibited fusion without affecting pH, and found the number of Lamp1-positive yellow dots to be 14 ± 1.5%, which was comparable with that in cells without inhibitor treatment. A combination of E64d and pepstatin A that inhibited lysosomal enzymes increased the Lamp1-positive yellow dots to 58 ± 1.3%, largely reflecting the accumulation of EGFP protein in the autolysosomes (Fig. 5A). Thus, our results confirm the pH sensitivity of EGFP fluorescence and cautioned the use of yellow dots as a single method to identify AP under certain experimental conditions. Additional use of Lamp1 would reliably identify AL that emits red and sometimes yellow signals as illustrated in the schematic (Fig. 5D). This method was used for the following studies to examine the autophagic flux.
Figure 5.

FoxO3 has no effect on autophagosome-lysosome fusion or autolysosomal clearance. A, representative images of autophagic flux in renal epithelial cells isolated from CREL mice subjected to starvation and treatment with and without autophagic inhibitors. Lamp1 staining (blue) was used in conjunction with fluorescent dots to identify autophagosomes (Lamp1−) or autolysosomes (Lamp1+). A, arrows point to yellow dots co-localized with Lamp1 (blue), indicating incomplete quenching of green fluorescence in acidic environment of the lysosomes. Scale bar, 10 μm. B, representative images showing the effect of inhibition of lysosomal fusion (vinblastine) or lysosomal clearance (E64d and pepstatin A) on autophagosomes (AP, yellow) and autolysosomes (AL, red) in cells isolated from CREL;FoxO3+/+ (wt) or CREL;FoxO3−/− (null) mice. C, quantification of the effects of inhibitors on lysosomal fusion (vinblastine) or lysosomal clearance (E64d and pepstatin A) on the number of autophagosomes (yellow) and autolysosomes (red). The proportions of the accumulation of autophagosomes or autolysosomes resulting from treatment with vinblastine or E64d combined with pepstatin A, respectively, were similar in cells competent or deficient with FoxO3. D, schematic illustration of the utility of the CREL mice to study autophagic flux.
Next, to investigate the effect of FoxO3 on autophagic flux, we treated cells isolated from CREL;FoxO3+/+ and CREL;FoxO3−/− mouse kidneys with vinblastine to prevent fusion of autophagosomes with lysosomes, or E64 combined with pepstatin A to inhibit lysosomal clearance. Under normal culture conditions and without inhibitor treatment, low basal levels of autophagy were detected and there were no significant differences in the number of fluorescent dots/cell between cells isolated from CREL;FoxO3+/+ and CREL;FoxO3−/− mouse kidneys (not shown). Following starvation with nutrient deprivation, cells isolated from CREL;FoxO3+/+ mice had 59% more increase in the total number of autophagic dots/cell compared with cells isolated from CREL;FoxO3−/− (119 ± 20 dots/cell versus 75 ± 6 dots/cell, n = 12, p < 0.05). As expected, treating both types of cells with fusion inhibitor vinblastine led to increases in the total number of dots/cell as a result of accumulation of AP. Consistent with results from starved cells without inhibitor treatment, more total dots were present in CREL;FoxO3+/+ (170 ± 38 dots/cell) than CREL;FoxO3−/− cells (129 ± 19 dots/cell). However, proportional increases in AP were comparable in both types of cells (2.1-fold in FoxO3+/+ and 2.6-fold in FoxO3−/− cells), suggesting that FoxO3 has no effect in the fusion of AP with lysosomes. Next, treating cells with E64d combined with pepstatin A led to an increase in the total number of autophagic dots/cell, which was largely due to accumulation of AL from blockage of clearance. Similar to the fusion process, no differences in the proportional increase in AL were detected in FoxO3+/+ (2.3-fold) and FoxO3−/− cells (2.7-fold) (Fig. 5, B and C), suggesting that FoxO3 did not affect autophagic clearance at the lysosomal level. Taken together, our results lead us to the conclusion that FoxO3 increases autophagic capacity by stimulating early autophagic flux, i.e. enhancing the formation of autophagosomes without affecting lysosomal fusion and clearance.
FoxO3 increases Atg mRNAs and proteins in the obstructed kidneys
Persistent obstruction of the ureter created prolonged stress and injury to kidney epithelial cells that exhibit FoxO3 activation and progressive increase in autophagy. We reasoned that maintaining prolonged autophagic activities may require synthesis of core autophagy components that would otherwise be consumed. We analyzed the kidney for the expression of mRNA and proteins levels of Atg proteins that are known to be FoxO3 targets (8). As shown in Fig. 6, there was a trend of increases in levels of Ulk1, Beclin-1, Atg9a, Atg4b, and Bnip3 mRNAs in both FoxO3+/+ and FoxO3−/− mouse kidneys with a longer duration of obstruction. However, these mRNAs were at significantly higher levels in FoxO3+/+ compared with FoxO3−/− mouse kidneys at 7 days post-UUO. The higher levels of mRNAs were accompanied by higher levels of proteins (Fig. 7A), suggesting transcriptional activation of Atg proteins by FoxO3. Immunostaining of a key autophagic core protein, Atg9, using a commercially available antibody confirmed the increase in the expression of Atg9 in tubules where abundant autophagic cells were present (Fig. 7B). Thus, results support the role of FoxO3 in increasing Atg protein expression in conditions where prolonged stress response occurs.
Figure 6.

FoxO3 activation induces the expression of mRNAs for Atg proteins in obstructed kidneys. Increased expression of mRNAs for UlK1, Beclin-1, Atg9a, Atg4b, and Bnip3 in the kidneys of FoxO3 wild-type mice. Values are mean ± S.E. n = 4. *, p < 0.05 comparing FoxO3+/+ and FoxO3−/− mice at 7 days post-UUO. 18s rRNA was used as control.
Figure 7.

FoxO3a activation maintains Atg proteins following prolonged obstruction. A, FoxO3 wild-type mouse kidneys exhibits significantly higher levels of Atg proteins following obstruction for 7 days. Gapdh was used as a loading control. B, increased expression of Atg9 (green) in tubular cells that contain abundant RFP dots (arrows) in CREL;FoxO3+/+ mouse kidneys 7 days post-UUO. Nuclei were counterstained with DAPI (blue). Scale bar, 20 μm.
Discussion
In this study, we show that persistent obstructive injury and hypoxia to renal tubules activates the FoxO3 transcription factor to regulate epithelial autophagy. Due to continuous fluid and electrolyte transport activities, kidney tubules, especially proximal tubular cells, are highly dependent on O2 and nutrients to produce ATP to meet metabolic requirements. Epithelial cells can accumulate reactive oxygen species over time as hypoxia and incomplete reduction of O2 in the mitochondria generate reactive oxygen species, which in turn causes further damage to the mitochondria and affects energy production. Autophagy is subsequently activated for energy reutilization by degrading unwanted or nonessential cellular constituents and removing damaged and dysfunctional organelles. In the kidneys following acute ischemia-reperfusion injury, autophagy has been shown to protect kidneys (1, 3, 22). In a chronic kidney disease model created by subtotal nephrectomy, autophagy is also induced for presumed cell survival under hypoxic conditions (23). We have previously shown that high numbers of autophagic vesicles co-exist in cells located in atrophic tubules following UUO (7). Because autophagy reflects cell stress, sustained autophagy following UUO certainly represents the cell's ability to respond to prolonged stress under this experimental condition. Whether epithelial autophagy contributes to tubular atrophy and interstitial fibrosis or exerts a beneficial effect to reduce renal fibrosis remains controversial (24, 25).
At the present time, mechanisms linking hypoxia to FoxO3 activation in the kidney are not fully understood. In an in vitro reconstitution system and a breast cancer cell line, prolyl hydroxylase 1 (PHD1 or EglN2) has been shown to hydroxylate FoxO3 leading to its degradation via the ubiquitin proteasomal system. Hypoxia limits FoxO3 hydroxylation thereby increasing its protein abundance, which has been shown to be Hif-independent in cancer cells (13). Here, we demonstrated significant proximal tubular hypoxia with a concurrent increase in nuclear FoxO3 following UUO. Furthermore, exposing cells to hypoxia for 30 min increased FoxO3 protein levels and induced autophagy, suggesting that hypoxia is an upstream activator for FoxO3, likely through a post-translational process. On the other hand, FoxO3a has also been shown to be a transcriptional target of Hif1 in some cancer cells (19, 20). We treated primary cultures of renal epithelial cells grown in normal oxygen tension with the prolyl hydroxylase inhibitor DMOG to mimic a hypoxic condition that stabilized Hif1. We detected increased abundance of FoxO3 protein over untreated cells, suggesting that FoxO3 could be a direct substrate for prolyl hydroxylase and/or regulated by a Hif1-dependent mechanism. Future studies utilizing cells and animals with Hif1α or FoxO3 deletion will help with in-depth understanding of FoxO3 regulation in kidneys with hypoxia that has been shown to be a common mediator for acute and chronic kidney disease.
In FoxO3 null mouse kidneys, we detected a 30% reduction in the number of autophagic cells defined by the presence of 3 or more RFP dots at 7 days post-UUO. Interestingly, there is a large variation in the total number of RFP dots in individual cells (ranging from 3 to more than 50). Autophagic cells in FoxO3 null mice demonstrate a shift toward fewer dots, which may explain a 58% reduction in the ratio of LC3-II/I proteins that incorporate into the membrane of each autophagic vesicle. Deletion of FoxO3 did not completely abolish the autophagic response in renal epithelial cells, suggesting that other pathways may regulate renal autophagy. Given the overlapping functions and their expression in the kidney, it is possible that FoxO1 and FoxO4 of the FoxO family could play a role. Future studies using individual and combined deletion of FoxO members in renal tubules will provide further answers to the relative contributions of specific FoxOs to tubular autophagy. It is also likely that FoxO-independent signaling may be involved. Hypoxia alters a myriad of biochemical reactions. pVHL/PHD/HIF is the best-characterized oxygen-sensing system to date (26, 27). Hypoxia stabilizes HIFs resulting in integrative adaptation including autophagic clearance of mitochondria during reticulocyte maturation and mouse embryonic fibroblast response to hypoxia (28, 29). Mammalian cells sense reduced cellular ATP by activating AMP-activated protein kinase that phosphorylates and activates the tuberous sclerosis complex 1/2 (TSC1/2) to inhibit mTOR. This well studied mechanism through down-regulation of mTOR could very likely contribute to autophagy stimulation under energy deprivation as well (30).
FoxO3 activity is mainly regulated at the post-translational level by phosphorylation, ubiquitination, glycosylation, acetylation/deacetylation, and methylation of the protein (21). The phosphorylation status at various serine and threonine residues of the protein determines its cytoplasmic or nuclear localization to affect transcriptional activation of its target genes. Insulin, growth factors, and nutrient abundance stimulate Akt to phosphorylate three serine and threonine residues resulting in the shuttling of FoxO3 from the nucleus to the cytoplasm where it can be degraded (12, 14, 31). Conversely, when the three phosphorylation sites were mutated (ΔFoxO3), the protein was restricted to the nuclei of primary cultures of renal epithelial cells resulting in profound autophagy, supporting the conclusion that expression of nuclear FoxO3 in proximal tubules can induce autophagy likely through transcriptional activation of proteins involved in autophagic regulation or the autophagic process.
In agreement with findings that FoxO3 induces the expression of multiple core autophagic components (32), we demonstrated that higher Atg protein levels are evident in the obstructed kidneys of FoxO3 wild-type mice. Deletion of FoxO3 resulted in a blunted autophagic response, characterized by lower levels of the Atg proteins that are essential for autophagic vesicle initiation, nucleation, and elongation. In primary cultures subjected to nutrient deprivation and treatment with inhibitors to autophagosome-lysosomal fusion or lysososomal clearance, we demonstrated that deletion of FoxO3 resulted in reduced autophagic capacity without significant effects on lysosomal fusion or clearance. FoxO3 was able to effectively induce more autophagosome formation during the 30 min of experimental conditions. Our results are consistent with the fact that rapid and transient autophagic responses require modification and assembly of autophagy-related proteins (Atg). In contrast, a long-term autophagic response may involve transcriptional regulation and synthesis of Atg proteins that could otherwise be consumed during autophagic digestion.
In summary, we identified FoxO3 as an upstream regulator for epithelial autophagy in the hypoxic proximal tubules injured by urinary tract obstruction. Future studies in delineating hypoxia-induced biochemical events leading to FoxO3 activation will pave the way to our long-term goal of understanding the potentially complex molecular network regulating renal tubular stress, survival, and repair.
Materials and methods
Unilateral ureteral obstruction
FoxO3+/+ or FoxO3−/− (obtained from Dr. Ron DiPinho, University of Texas MD Anderson Cancer Center), CAG-RFP-GFP-LC3 (CREL), CREL;FoxO3+/+, or CREL;FoxO3−/− mice at 6–8 weeks of age were used for UUO as previously described (33). Briefly, the mice were anesthetized with isoflurane, and the left ureter was obstructed by a two-point ligation with silk. The kidneys were harvested at 3 and 7 days following UUO. Sham-operated control mice underwent an identical procedure excluding the ligation of the ureter. For immunostaining, the mice were perfused with 30 ml of PBS followed by 15 ml of 4% PFA via the left ventricle. Kidneys were fixed further in 4% PFA for 4 h, then with 30% sucrose overnight and embedded in OCT. Tissue cryosections at 6 μm thickness were used. All experiments involving animals were performed with the approval of the Institutional Animal Care and Research Advisory Committee at Columbia University Medical Center.
Immunostaining and image analysis
Immunostaining was performed using established methods and conducted in duplicates (34). The following primary antibodies were used: FoxO3 (75D8) (Cell Signaling Technology, 2497, 1:50), Kim1 (R&D Systems, AF1817, 1:800), Atg9a (Abcam, ab124739, 1:1000), and Lamp1 (Abcam, ab24871, 1:100). Secondary antibodies included Alexa Fluor 488-conjugated goat anti-rabbit, goat anti-rat, or donkey anti-goat IgG, or donkey anti-goat IgG and Alexa Fluor 594-conjugated goat anti-rabbit IgG (Molecular Probes, A-11070, A-11006, A-21206A–11036, 1:200). Proximal tubules were stained using biotinylated lectin Lotus tetragonolobus agglutinin (LTA, Vector, B-1325, 1:800), which was detected with fluorochrome-conjugated streptavidin (DyLight 649 Streptavidin, Vector, SA-5649, 1:100). Fluorescein-conjugated LTA was also used to stain proximal tubules (FITC-LTA; FL-1321, Vector, 1:800). Collecting ducts were stained using the fluorescein-conjugated lectin DBA (Vector, FL-1031, 1:800). Tissue sections were fixed with 4% PFA in PBS for 4 h, permeabilized with 0.1% Triton X-100 in PBS for 30 min, then blocked with 10% goat serum and 0.5% bovine serum albumin (BSA) in PBS. Sections for FoxO3 staining were alternatively blocked with 5% goat serum and 0.3% Triton X-100 in PBS. Incubations with primary antibodies were carried out at 4 °C overnight. After washing, the sections were further incubated for 1 h at room temperature with the appropriate secondary antibodies. Nuclei were counterstained with DAPI (Vector, H-1200). Sections were visualized with a Zeiss AxioObserver.Z1 inverted fluorescence microscope, photographed with a digital camera, and analyzed with Axiovision software. For quantification of peritubular microvascular density, tissue sections were immunostained with endomucin (Santa Cruz, SC-65495, 1:200) and photographed at a magnification of ×200. 10 images per kidney were taken randomly in the cortical region. Images were analyzed using Adobe Photoshop CS5.1 by applying an arbitrary common threshold to all images, inverting the images, and determining total area fraction as described (35, 36).
For detection of renal hypoxia, mice received an intraperitoneal injection of HypoxyprobeTM (pimonidazole hydrochloride, Hypoxyprobe, Inc., HP3–100 Kit) at 60 mg/kg 90 min prior to kidney harvesting. Kidneys were fixed with 4% PFA and processed as cryosections. Pimonidazole hydrochloride formed protein adducts in cells with a pO2 < 10 mm Hg (1.4% O2) and tissue incorporation of pimonidazole was assessed with immunohistochemistry using anti-pimonidazole antisera (Hypoxyprobe, Inc., Pab2627, 1:100) as described (37).
Immunoblot analysis
Kidneys were snap-frozen in liquid nitrogen for protein isolation. Preparations of cellular extracts and immunoblot analyses were performed as previously described (7). Briefly, 2% SDS (62.5 mm Tris-HCl, pH 6.8, 10% glycerol, 2% SDS) or RIPA buffer (Thermo Scientific, 89900) were used for protein extraction from kidneys of primary cultured renal epithelial cells, respectively, in conjunction with protease inhibitor mixtures (Thermo Scientific, 78430), phosphatase inhibitors (Thermo Scientific, 1862495), and DNase I (Thermo Scientific, 90083, 1:50). Immunoblots were probed with antibodies to FoxO3 (75D8) (Cell Signaling, 2497, 1:1000), LC3 (Novus Biologicals, NB100–2220, 1:1000), Ulk1 (Abcam, ab128859, 1:500), Atg4b (Abcam, ab154843, 1:500), Atg9a (Abcam, ab124739, 1:1000), Beclin-1 (Santa Cruz, SC11427, 1:1000), Bnip3 (Abcam, ab10433, 1:800), and Hif1α (R&D, AF1935, 1:1000) and followed by further incubation with the appropriate secondary antibodies conjugated with horseradish peroxidase (HRP, Life Technologies, G21234, 1:5000) and detected by chemiluminescence (Thermo Scientific, 34076). Gapdh (Santa Cruz, SC-25778, 1:1000) was used as a loading control. Levels of protein expression were quantified by NIH Image J 1.47 software.
Renal epithelial cell culture and analysis of autophagic capacity and flux
Kidneys were collected from 3-week-old female mice and cells were isolated using established methods (38). Briefly, kidneys were cut into 1 mm3 pieces and digested with 0.02% collagenase (Sigma, C5138-100MG) in serum-free culture medium at 37 °C for 10–15 min. Cells were plated onto chamber slides or 10-cm culture dishes in DMEM/F-12 medium (Life Technologies, 12500-062) supplemented with 0.5% of ITS (insulin-transferrin-sodium selenite, Sigma, I-2521), 2 × 10⁻⁹ m 3,3,5-triiodo-l-thyronine sodium salt (Sigma, T-5516), and 2% BenchMarkTM FBS (Gemini Bio-Product, 100-106, lot A96B01A). This medium has been shown to favor the growth of renal tubular epithelial cells (39). The medium was changed 24 h after the initial plating. For adenovirus infection, cells growing at 70% confluence were infected with Ad-CMV-FOXO3 (AAA) (ΔFoxO3, Vector Biolabs, 1025) in the above epithelial culture medium at a ratio of 10 viruses per cell for 48 h. In ΔFoxO3, the three phosphorylation sites at Thr-32, Ser-253, and Ser-315 were replaced by alanine, thus retaining FoxO3 in the nucleus in a constitutively activated form. Cells infected with Ad-CMV-GFP (Vector Biolabs, 1060) were used as controls. After 48 h of infection, cells were starved with glucose- and amino acid-free EBSS (Sigma, E2888) or incubated with epithelial culture medium for 30 min before analyses. To study the level of autophagy, primary cultures of renal tubular epithelial cells from FoxO3+/+ and FoxO3−/− mice were incubated in EBSS for 10, 20, and 30 min prior to immunoblot analysis of LC3. Cells under nutrient abundant conditions were used as controls. To create a hypoxic culture condition, cells were exposed to 1% O2 in the hypoxic chamber (Biospherix Ltd., C21) for 0 min to 4 h before analyses. To create a pseudo-hypoxic condition, cells grown in normoxia conditions were pretreated with the prolyl-hydroxylase inhibitor DMOG (1 mm) (Sigma, D3695-50MG) or vehicle for 2 h before exposure to normaxic or 1% oxygen conditions for 30 min. Media used for the hypoxic study were equilibrated in the 1% O2 atmosphere overnight before use.
Autophagic capacity and flux were analyzed in cells grown on chamber slides (Lab-Tek, 154461). Cells were pre-treated with autophagic inhibitors for 1 h in epithelial culture medium prior to further treatment with autophagic inhibitors under starvation with EBSS for 30 min. The autophagy inhibitors used were chloroquine diphosphate salt (40 mg/ml, Sigma, C6628), vinblastine sulfate salt (50 μm, Sigma, V1377), bafilomycin A1 (100 nm, Sigma, B1793), and a combination of E64d (10 μg/ml, Sigma, E8640) and pepstatin A (10 μg/ml, Sigma, P5318). Cells were then fixed with cold 4% PFA (Affymetrix, 19943 1LT) for 10 min, dehydrated with gradient ethanol, and kept at −20 °C. To quantify the number of autophagic dots per cell, images at a magnification of ×630 were randomly selected and at least 10 cells were counted in each condition.
Real-time RT-PCR analysis
Total RNA was isolated from ¼ kidney tissue using 1 ml of TRIzol reagent (Life Technologies 15596-026). RNA concentration and integrity were measured with a EpochTM microplate spectrophotometer. DNA was eliminated from 1 μg of RNA with deoxyribonuclease I (DNase I, Invitrogen, 18068-015). Post-DNase I digestion, 1 μg of RNA was applied for reverse transcription with iScriptTM cDNA Synthesis Kit (Bio-Rad, 1708890). Each time, 100 ng of cDNA and 500 nm primers were used for real-time PCR in a 10-μl reaction mixture with iQ SYBR Green Supermix (Bio-Rad, 170-8880) using a Bio-RadTM CFX96TM Real-Time PCR System. Primers were designed with Integrated DNA Technologies Primer Quest Tool. The sequence of each primer is as follows: Ulk1, forward: 5′-GGTGTGGGTGAAGAATAAC-3′ and reverse: 5′-AGGCTGGGAAGGTATTAG-3′; Becn1, forward: 5′-CAGGAGAGGAGCCATTTA-3′ and reverse: 5′-CCGATCAGAGTGAAGCTA-3′; Atg9a, forward: 5′-CCCAGTATCCCTCACTTAC-3′ and reverse: 5′-GCTAGGGTGAGTCCATTAT-3′; Atg4b, forward: 5′-CTTCCTCCATGTTCTTTCTC-3′ and reverse: 5′-GAGCTACCTGCTGTCTAA-3′; Bnip3, forward: 5′-CAGCCTCCGTCTCTATTT-3′ and reverse: 5′-TTCAGCTCTGTTGGTATCT-3′; 18s rRNA forward: 5′-GTAACCCGTTGAACCCCATT-3′ and reverse: 5′-CCATCCAATCGGTAGTAGCG-3′. 18s rRNA was used as controls. The expression of each specific gene relative to 18s rRNA was calculated using the Pfaffl method (40).
Quantification and statistical analysis
To quantify autophagic signals in renal tubules, images at ×400 magnification were randomly selected and at least 500 cells were counted in each experiment. Cells that contained three or more RFP or EGFP puncta were counted as autophagic cells. To compare the autophagic capacity in renal epithelial cells of CREL;FoxO3+/+ and CREL;FoxO3−/− mice, images at ×630 magnification were randomly selected in Kim1+ tubules and at least 100 cells were counted in each experiment. Autophagic cells were further divided into 8 subgroups that contained 3–5, 6–10, 11–15, 16–20, 21–30, 31–40, 41–50, or >50 RFP dots per cell. Each immunostaining was conducted in duplicate sections. The number of animals used are indicated in each experiment. Data were presented as mean ± S.E. A Student's t test was used to determine statistical significance between the two groups. A two-tailed p value of <0.05 was considered to be statistically significant.
Author contributions
L. L. designed, performed, and analyzed the experiments, as well as assisted with the preparation of the figures and manuscript. R. Z. performed and analyzed experiment shown in Fig. 4 and assisted with the manuscript preparation. C. H. provided technical assistance and contributed to the preparation of figures. Z. V. W. and J. A. H. generated the autophagy reporter mouse line for the study. L. F. conceived and guided the study and wrote the paper. All authors reviewed the results and approved the manuscript.
This work was supported, in whole or in part, by National Institutes of Health Grants R01DK083411 and R01DK107653 and a March of Dimes research grant (to F. L.) and National Institutes of Health Grants HL-120732 and HL-100401, American Heart Association Grant 14SFRN20740000, Cancer Prevention and Research Institute of Texas (CPRIT) Grant RP110486P3, and the Leducq Foundation (11CVD04) (to J. A. H.). The authors declare that they have no conflicts of interest with the contents of this article. The content is solely the responsibility of the authors and does not necessarily represent the official views of the National Institutes of Health.
- mTOR
- mechanistic target of rapamycin
- UUO
- unilateral ureteral obstruction
- Kim1
- kidney injury molecule 1
- RFP
- red fluorescent protein
- EGFP
- enhanced green fluorescent protein
- LTA
- Lotus tetragonolobus agglutinin
- DBA
- dolichos biflorus agglutinin
- PFA
- paraformaldehyde
- EBSS
- Earl's balanced salt solution
- DMOG
- dimethyloxalylglycine
- PHD
- prolyl hydroxylase
- AP
- autophagosomes
- AL
- autolysosome.
References
- 1. Liu S., Hartleben B., Kretz O., Wiech T., Igarashi P., Mizushima N., Walz G., and Huber T. B. (2012) Autophagy plays a critical role in kidney tubule maintenance, aging and ischemia-reperfusion injury. Autophagy 8, 826–837 [DOI] [PubMed] [Google Scholar]
- 2. Huber T. B., Edelstein C. L., Hartleben B., Inoki K., Jiang M., Koya D., Kume S., Lieberthal W., Pallet N., Quiroga A., Ravichandran K., Susztak K., Yoshida S., and Dong Z. (2012) Emerging role of autophagy in kidney function, diseases and aging. Autophagy 8, 1009–1031 [DOI] [PMC free article] [PubMed] [Google Scholar]
- 3. Jiang M., Liu K., Luo J., and Dong Z. (2010) Autophagy is a renoprotective mechanism during in vitro hypoxia and in vivo ischemia-reperfusion injury. Am. J. Pathol. 176, 1181–1192 [DOI] [PMC free article] [PubMed] [Google Scholar]
- 4. Kaushal G. P., Kaushal V., Herzog C., and Yang C. (2008) Autophagy delays apoptosis in renal tubular epithelial cells in cisplatin cytotoxicity. Autophagy 4, 710–712 [DOI] [PubMed] [Google Scholar]
- 5. Lin F. (2017) Autophagy in renal tubular injury and repair. Acta Physiol. (Oxf.) 220, 229–231 [DOI] [PMC free article] [PubMed] [Google Scholar]
- 6. Li L., Wang Z. V., Hill J. A., and Lin F. (2014) New autophagy reporter mice reveal dynamics of proximal tubular autophagy. J. Am. Soc. Nephrol. 25, 305–315 [DOI] [PMC free article] [PubMed] [Google Scholar]
- 7. Li L., Zepeda-Orozco D., Black R., and Lin F. (2010) Autophagy is a component of epithelial cell fate in obstructive uropathy. Am. J. Pathol. 176, 1767–1778 [DOI] [PMC free article] [PubMed] [Google Scholar]
- 8. Webb A. E., and Brunet A. (2014) FOXO transcription factors: key regulators of cellular quality control. Trends Biochem. Sci. 39, 159–169 [DOI] [PMC free article] [PubMed] [Google Scholar]
- 9. Mammucari C., Milan G., Romanello V., Masiero E., Rudolf R., Del Piccolo P., Burden S. J., Di Lisi R., Sandri C., Zhao J., Goldberg A. L., Schiaffino S., and Sandri M. (2007) FoxO3 controls autophagy in skeletal muscle in vivo. Cell Metab. 6, 458–471 [DOI] [PubMed] [Google Scholar]
- 10. Sengupta A., Molkentin J. D., and Yutzey K. E. (2009) FoxO transcription factors promote autophagy in cardiomyocytes. J. Biol. Chem. 284, 28319–28331 [DOI] [PMC free article] [PubMed] [Google Scholar]
- 11. Zhao J., Brault J. J., Schild A., Cao P., Sandri M., Schiaffino S., Lecker S. H., and Goldberg A. L. (2007) FoxO3 coordinately activates protein degradation by the autophagic/lysosomal and proteasomal pathways in atrophying muscle cells. Cell Metab. 6, 472–483 [DOI] [PubMed] [Google Scholar]
- 12. Greer E. L., and Brunet A. (2005) FOXO transcription factors at the interface between longevity and tumor suppression. Oncogene 24, 7410–7425 [DOI] [PubMed] [Google Scholar]
- 13. Zheng X., Zhai B., Koivunen P., Shin S. J., Lu G., Liu J., Geisen C., Chakraborty A. A., Moslehi J. J., Smalley D. M., Wei X., Chen X., Chen Z., Beres J. M., Zhang J., Tsao J. L., et al. (2014) Prolyl hydroxylation by EglN2 destabilizes FOXO3a by blocking its interaction with the USP9x deubiquitinase. Genes Dev. 28, 1429–1444 [DOI] [PMC free article] [PubMed] [Google Scholar]
- 14. Huang H., and Tindall D. J. (2007) Dynamic FoxO transcription factors. J. Cell Sci. 120, 2479–2487 [DOI] [PubMed] [Google Scholar]
- 15. John G. B., Gallardo T. D., Shirley L. J., and Castrillon D. H. (2008) Foxo3 is a PI3K-dependent molecular switch controlling the initiation of oocyte growth. Dev. Biol. 321, 197–204 [DOI] [PMC free article] [PubMed] [Google Scholar]
- 16. Kume S., Uzu T., Horiike K., Chin-Kanasaki M., Isshiki K., Araki S., Sugimoto T., Haneda M., Kashiwagi A., and Koya D. (2010) Calorie restriction enhances cell adaptation to hypoxia through Sirt1-dependent mitochondrial autophagy in mouse aged kidney. J. Clin. Invest. 120, 1043–1055 [DOI] [PMC free article] [PubMed] [Google Scholar]
- 17. Nangaku M., and Eckardt K. U. (2007) Hypoxia and the HIF system in kidney disease. J. Mol. Med. 85, 1325–1330 [DOI] [PubMed] [Google Scholar]
- 18. Schödel J., Klanke B., Weidemann A., Buchholz B., Bernhardt W., Bertog M., Amann K., Korbmacher C., Wiesener M., Warnecke C., Kurtz A., Eckardt K. U., and Willam C. (2009) HIF-prolyl hydroxylases in the rat kidney: physiologic expression patterns and regulation in acute kidney injury. Am. J. Pathol. 174, 1663–1674 [DOI] [PMC free article] [PubMed] [Google Scholar]
- 19. Bakker W. J., Harris I. S., and Mak T. W. (2007) FOXO3a is activated in response to hypoxic stress and inhibits HIF1-induced apoptosis via regulation of CITED2. Mol. Cell 28, 941–953 [DOI] [PubMed] [Google Scholar]
- 20. Jensen K. S., Binderup T., Jensen K. T., Therkelsen I., Borup R., Nilsson E., Multhaupt H., Bouchard C., Quistorff B., Kjaer A., Landberg G., and Staller P. (2011) FoxO3A promotes metabolic adaptation to hypoxia by antagonizing Myc function. EMBO J. 30, 4554–4570 [DOI] [PMC free article] [PubMed] [Google Scholar]
- 21. Eijkelenboom A., and Burgering B. M. (2013) FOXOs: signalling integrators for homeostasis maintenance. Nat. Rev. Mol. Cell Biol. 14, 83–97 [DOI] [PubMed] [Google Scholar]
- 22. Livingston M. J., and Dong Z. (2014) Autophagy in acute kidney injury. Semin. Nephrol. 34, 17–26 [DOI] [PMC free article] [PubMed] [Google Scholar]
- 23. Li H., Satriano J., Thomas J. L., Miyamoto S., Sharma K., Pastor-Soler N. M., Hallows K. R., and Singh P. (2015) Interactions between HIF-1α and AMPK in the regulation of cellular hypoxia adaptation in chronic kidney disease. Am. J. Physiol. Renal Physiol. 309, F414–428 [DOI] [PMC free article] [PubMed] [Google Scholar]
- 24. Livingston M. J., Ding H. F., Huang S., Hill J. A., Yin X. M., and Dong Z. (2016) Persistent activation of autophagy in kidney tubular cells promotes renal interstitial fibrosis during unilateral ureteral obstruction. Autophagy 12, 976–998 [DOI] [PMC free article] [PubMed] [Google Scholar]
- 25. Ding Y., Kim S. L., Lee S. Y., Koo J. K., Wang Z., and Choi M. E. (2014) Autophagy regulates TGF-β expression and suppresses kidney fibrosis induced by unilateral ureteral obstruction. J. Am. Soc. Nephrol. 25, 2835–2846 [DOI] [PMC free article] [PubMed] [Google Scholar]
- 26. Maxwell P. H., and Eckardt K. U. (2016) HIF prolyl hydroxylase inhibitors for the treatment of renal anaemia and beyond. Nat. Rev. Nephrol. 12, 157–168 [DOI] [PubMed] [Google Scholar]
- 27. Semenza G. L. (2014) Oxygen sensing, hypoxia-inducible factors, and disease pathophysiology. Annu. Rev. Pathol. 9, 47–71 [DOI] [PubMed] [Google Scholar]
- 28. Sandoval H., Thiagarajan P., Dasgupta S. K., Schumacher A., Prchal J. T., Chen M., and Wang J. (2008) Essential role for Nix in autophagic maturation of erythroid cells. Nature 454, 232–235 [DOI] [PMC free article] [PubMed] [Google Scholar]
- 29. Zhang H., Bosch-Marce M., Shimoda L. A., Tan Y. S., Baek J. H., Wesley J. B., Gonzalez F. J., and Semenza G. L. (2008) Mitochondrial autophagy is an HIF-1-dependent adaptive metabolic response to hypoxia. J. Biol. Chem. 283, 10892–10903 [DOI] [PMC free article] [PubMed] [Google Scholar] [Retracted]
- 30. He C., and Klionsky D. J. (2009) Regulation mechanisms and signaling pathways of autophagy. Annu. Rev. Genet. 43, 67–93 [DOI] [PMC free article] [PubMed] [Google Scholar]
- 31. Zhang X., Gan L., Pan H., Guo S., He X., Olson S. T., Mesecar A., Adam S., and Unterman T. G. (2002) Phosphorylation of serine 256 suppresses transactivation by FKHR (FOXO1) by multiple mechanisms: direct and indirect effects on nuclear/cytoplasmic shuttling and DNA binding. J. Biol. Chem. 277, 45276–45284 [DOI] [PubMed] [Google Scholar]
- 32. Feng Y., Yao Z., and Klionsky D. J. (2015) How to control self-digestion: transcriptional, post-transcriptional, and post-translational regulation of autophagy. Trends Cell Biol. 25, 354–363 [DOI] [PMC free article] [PubMed] [Google Scholar]
- 33. Li L., Zepeda-Orozco D., Patel V., Truong P., Karner C. M., Carroll T. J., and Lin F. (2009) Aberrant planar cell polarity induced by urinary tract obstruction. Am. J. Physiol. Renal Physiol. 297, F1526–1533 [DOI] [PMC free article] [PubMed] [Google Scholar]
- 34. Lin F., Cordes K., Li L., Hood L., Couser W. G., Shankland S. J., and Igarashi P. (2003) Hematopoietic stem cells contribute to the regeneration of renal tubules after renal ischemia-reperfusion injury in mice. J. Am. Soc. Nephrol. 14, 1188–1199 [DOI] [PubMed] [Google Scholar]
- 35. Hernandez S. L., Banerjee D., Garcia A., Kangsamaksin T., Cheng W. Y., Anastassiou D., Funahashi Y., Kadenhe-Chiweshe A., Shawber C. J., Kitajewski J. K., Kandel J. J., and Yamashiro D. J. (2013) Notch and VEGF pathways play distinct but complementary roles in tumor angiogenesis. Vasc. Cell 5, 17. [DOI] [PMC free article] [PubMed] [Google Scholar]
- 36. Wild R., Ramakrishnan S., Sedgewick J., and Griffioen A. W. (2000) Quantitative assessment of angiogenesis and tumor vessel architecture by computer-assisted digital image analysis: effects of VEGF-toxin conjugate on tumor microvessel density. Microvasc. Res. 59, 368–376 [DOI] [PubMed] [Google Scholar]
- 37. Basile D. P., Donohoe D. L., Roethe K., and Mattson D. L. (2003) Chronic renal hypoxia after acute ischemic injury: effects of l-arginine on hypoxia and secondary damage. Am. J. Physiol. Renal Physiol. 284, F338–348 [DOI] [PubMed] [Google Scholar]
- 38. Li L., Truong P., Igarashi P., and Lin F. (2007) Renal and bone marrow cells fuse after renal ischemic injury. J. Am. Soc. Nephrol. 18, 3067–3077 [DOI] [PubMed] [Google Scholar]
- 39. Sweeney W. E. Jr, Kusner L., Carlin C. R., Chang S., Futey L., Cotton C. U., Dell K. M., and Avner E. D. (2001) Phenotypic analysis of conditionally immortalized cells isolated from the BPK model of ARPKD. Am. J. Physiol. Cell Physiol 281, C1695–1705 [DOI] [PubMed] [Google Scholar]
- 40. Pfaffl M. W. (2001) A new mathematical model for relative quantification in real-time RT-PCR. Nucleic Acids Res. 29, e45. [DOI] [PMC free article] [PubMed] [Google Scholar]